HAL Id: hal-00298190
https://hal.archives-ouvertes.fr/hal-00298190
Submitted on 27 Jun 2007HAL is a multi-disciplinary open access
archive for the deposit and dissemination of sci-entific research documents, whether they are pub-lished or not. The documents may come from teaching and research institutions in France or abroad, or from public or private research centers.
L’archive ouverte pluridisciplinaire HAL, est destinée au dépôt et à la diffusion de documents scientifiques de niveau recherche, publiés ou non, émanant des établissements d’enseignement et de recherche français ou étrangers, des laboratoires publics ou privés.
LGM and Late Glacial glacier advances in the Cordillera
Real and Cochabamba (Bolivia) deduced from 10Be
surface exposure dating
R. Zech, Ch. Kull, P. W. Kubik, H. Veit
To cite this version:
R. Zech, Ch. Kull, P. W. Kubik, H. Veit. LGM and Late Glacial glacier advances in the Cordillera Real and Cochabamba (Bolivia) deduced from 10Be surface exposure dating. Climate of the Past Discussions, European Geosciences Union (EGU), 2007, 3 (3), pp.839-869. �hal-00298190�
CPD
3, 839–869, 2007 Surface exposure dating in Bolivia R. Zech et al. Title Page Abstract Introduction Conclusions References Tables Figures ◭ ◮ ◭ ◮ Back CloseFull Screen / Esc
Printer-friendly Version Interactive Discussion
EGU Clim. Past Discuss., 3, 839–869, 2007
www.clim-past-discuss.net/3/839/2007/ © Author(s) 2007. This work is licensed under a Creative Commons License.
Climate of the Past Discussions
Climate of the Past Discussions is the access reviewed discussion forum of Climate of the Past
LGM and Late Glacial glacier advances in
the Cordillera Real and Cochabamba
(Bolivia) deduced from
10
Be surface
exposure dating
R. Zech1, Ch. Kull2, P. W. Kubik3, and H. Veit3
1
Geographical Institute, University of Bern, Switzerland
2
OcCC, Scwarztorstr. 9, 3007 Bern, Switzerland
3
Paul Scherrer Institute c/o Institute of Particle Physics, ETH Zurich, Switzerland Received: 30 May 2007 – Accepted: 5 June 2007 – Published: 27 June 2007 Correspondence to: R. Zech (roland.zech@giub.unibe.ch)
CPD
3, 839–869, 2007 Surface exposure dating in Bolivia R. Zech et al. Title Page Abstract Introduction Conclusions References Tables Figures ◭ ◮ ◭ ◮ Back CloseFull Screen / Esc
Printer-friendly Version Interactive Discussion
EGU
Abstract
Surface exposure dating (SED) is an innovative tool being already widely applied for moraine dating and for Late Quaternary glacier and climate reconstruction. Here we present exposure ages of 28 boulders from the Cordillera Real and the Cordillera Cochabamba, Bolivia. Our results indicate that the local Last Glacial Maximum (LGM)
5
in the Eastern Cordilleras occurred at ∼22–25 ka and thus synchronous to the global temperature minimum. We were also able to date several Late Glacial moraines to ∼11–13 ka, which likely document lower temperatures and increased precipitation (“Coipasa” humid phase). Additionally, we recognize the existence of older Late Glacial moraines re-calculated to ∼15 ka from published cosmogenic nuclide data. Those may
10
coincide with the cold Heinrich 1 event in the North Atlantic region and the pronounced “Tauca” humid phase. We conclude that (i) exposure ages in the tropical Andes may have been substantially overestimated so far due to methodological uncertainties, and (ii) although precipitation plays an important role for glacier mass balances in the trop-ical Andes, it becomes the dominant forcing for glaciation only in the drier and thus
15
more precipitation-sensitive regions further west and south.
1 Introduction
Reconstruction of past climatic conditions is important to identify relevant forcings and mechanisms of climate change (“the past is the key to the future”,http://www.pages. unibe.ch). Long high-resolution records are available at high latitudes (ice-cores from
20
Greenland and Antarctica) and from marine sediments. Comparable tropical and sub-tropical terrestrial records, however, are more scarce. Here, glacial deposits may pro-vide valuable information about temperature and precipitation changes, the two domi-nant controls on glacier extent (Kaser, 2001; Kull et al., 2003, 2007). So far, the lack of organic material for radiocarbon dating has been a major limiting factor for the
estab-25
CPD
3, 839–869, 2007 Surface exposure dating in Bolivia R. Zech et al. Title Page Abstract Introduction Conclusions References Tables Figures ◭ ◮ ◭ ◮ Back CloseFull Screen / Esc
Printer-friendly Version Interactive Discussion
EGU the Central Andes (Harrison, 2004; Heine, 2004; Mark et al., 2004). Surface Exposure
Dating (SED) is an innovative new method that may provide the means to date glacial deposits more accurately (Gosse and Phillips, 2001).
The Central Andes are part of the PEP I transect (Markgraf et al., 2000, Pole-Equator-Pole American Transect: http://www.pages.unibe.ch) and are a key area for
5
global climate reconstruction because they lie at the transition zone between the mid-latitude and the tropical atmospheric circulation (the westerlies in the south: Vuille and Ammann, 1997; and the South American Summer Monsoon (SASM) in the north: Zhou and Lau, 1998; Vuille and Keimig, 2004, see also Fig. 1). Intensity changes and shifts of the two circulation systems should therefore be recorded in suitable archives,
10
for example glacial chronologies. Extensive SED was recently conducted in the East-ern Cordillera of Bolivia and Peru by Smith et al. (2005a, b). They concluded that glaciers reached their greatest extent at ∼34 ka and were retreating by ∼21 ka. This would imply that tropical controls on ice volumes were asynchronous with those in the northern hemisphere, which would have far-reaching consequences concerning the
15
inter-hemispheric linkages. It has already been speculated that the Andean tropics and the mid-latitude southern hemisphere may lead the polar regions (Shulmeister et al., 2006). On the other hand, Schaefer et al. (2006) interpreted this very dataset of Smith et al. as evidence for a near-synchronous interhemispheric termination of the LGM (Last Glacial Maximum) in mid-latitudes.
20
With this study, we hope to further illustrate the high potential of SED, while increas-ing awareness of the method’s current limitations. We
(i) present results of our 10Be (beryllium) SED in the Cordillera Cochabamba and the Cordillera Real, Bolivia,
(ii) derive a “relative” glacial chronology addressing potential causes for the observed
25
scatter in ages,
(iii) highlight the systematic uncertainties of the exposure ages and, finally, (iv) discuss the paleoclimatic context and the possible implications of our results.
CPD
3, 839–869, 2007 Surface exposure dating in Bolivia R. Zech et al. Title Page Abstract Introduction Conclusions References Tables Figures ◭ ◮ ◭ ◮ Back CloseFull Screen / Esc
Printer-friendly Version Interactive Discussion
EGU
2 Regional setting
The Cordillera Cochabamba and the Cordillera Real form the north-eastern boundary of the Altiplano plateau (∼3800 m) towards the Amazon Basin (Fig. 1). Some sum-mits reach altitudes of more than 6000 m. The steep altitude gradient causes a pro-nounced climatic gradient. Precipitation decreases from >1500 mm/a in the lowlands
5
to ∼1000 mm/a in the Cordilleras and to less than 500 mm/a on the Altiplano. Further south, where the so-called “Arid Diagonal” crosses the Central Andes (25–27◦S), no
glaciers exist even at altitudes above 6000 m (Ammann et al., 2001; Kull et al., 2002). Large moraines in the Eastern Cordillera document Late Quaternary periods much more favourable for glaciation than today, i.e. lower temperatures and/or increased
pre-10
cipitation. However, considerable uncertainties concerning the glacial chronology exist. Based on soil development on moraines, bedded slope deposits and basal radiocarbon ages, various authors have suggested a local LGM either before, synchronous or after the global LGM (recently reviewed by Heine, 2004; and Mark et al., 2004). In addition, there is no consensus concerning the exact timing of Late Glacial readvances such
15
as the Younger Dryas (YD) or the Antarctic Cold Reversal (ACR). The reviews of the region’s glacial history by Heine (2004) and Mark et al. (2004) both highlight the need for improved age control.
In order to provide some dating control on the glacial chronology in the Eastern Cordillera, we selected three research areas for10Be SED based on the occurrence of
20
well-defined moraine stratigraphy and the availability of suitable, i.e. large and quartz-bearing, boulders (Fig. 1):
– Valle San Francisco (south-western side of the Illampu massif, 16.00◦S, 68.54◦W), ∼80 km northwest of La Paz
– Valle de Rio Suturi (17.23◦S, 66.45◦W), ∼30 km northwest of Cochabamba
25
CPD
3, 839–869, 2007 Surface exposure dating in Bolivia R. Zech et al. Title Page Abstract Introduction Conclusions References Tables Figures ◭ ◮ ◭ ◮ Back CloseFull Screen / Esc
Printer-friendly Version Interactive Discussion
EGU
3 Materials and methods
Fieldwork included mapping of the moraines, sampling of suitable boulders (∼0.5 kg from the flat top of preferentially large, stable and uneroded boulders), and documen-tation of the samples (geographic location (GPS), topographic shielding, sample geom-etry, and photographs: see supplementary material A.1 (http://www.clim-past-discuss.
5
net/3/839/2007/cpd-3-839-2007-supplement.pdf) for the sample photos). Laboratory preparation and analysis followed standard procedures (e.g. Ivy-Ochs, 1996). In brief, this involved (i) separation of quartz, (ii) dissolution of the quartz in HF after addition of
9
Be carrier, (iii) chromatographical purification of beryllium (Be), (iv) precipitation and oxidation, and (v) AMS measurement of the10Be over9Be ratio.
10
Surface exposure dating is based on the production and accumulation of cosmogenic nuclides (e.g.10Be) in the upper few decimetres of an exposed rock surface (Gosse and Phillips, 2001). In order to calculate the exposure age of a sample from its10Be con-centration, the local10Be production rate must be estimated. This is accomplished by scaling a reference production rate (typically at sea level and high latitude, SLHL) to the
15
sampling location, using scaling models that describe the latitude and altitude depen-dence of the cosmic radiation. Several scaling models have been proposed (Lal, 1991; Dunai, 2000; Stone, 2000; Desilets and Zreda, 2001, 2003; Dunai, 2001; Lifton et al., 2005; Desilets et al., 2006), but currently there is debate as to which is most appropri-ate. Uncertainties in the predictions of these various models are variable, but are
typi-20
cally quoted as on the order of 10–15% (Gosse and Phillips, 2001). Major international efforts currently aim at the development of an internationally accepted protocol to cal-culate exposure ages with accuracy of at least 5% (CRONUS-Earth and CRONUS-EU projects:www.physics.purdue.edu/cronusandhttp://www.cronus-eu.net, respectively). Therefore, while we calculated the exposure ages below using the scaling model of
25
Lifton et al. (2005), we also examined the sensitivity of our calculated exposure ages to various calculations schemes and assumptions. All presented ages are corrected for topographic shielding (Dunne et al., 1999) and sample thickness, whereas snow and
CPD
3, 839–869, 2007 Surface exposure dating in Bolivia R. Zech et al. Title Page Abstract Introduction Conclusions References Tables Figures ◭ ◮ ◭ ◮ Back CloseFull Screen / Esc
Printer-friendly Version Interactive Discussion
EGU vegetation cover can likely be neglected due to the relatively dry conditions and the
scarce vegetation cover.
4 Results and discussion
Exposure ages and the relevant sample data are given in Table 1. We will first present the exposure ages in their stratigraphic context (Figs. 2–4). Then, we will address the
5
age scatter due to sample-specific effects, i.e. possible over- or underestimation of the deposition age of the respective moraine (all ages plotted in Fig. 5). Subsequently, we will discuss the systematic uncertainties (Fig. 6). Finally, the paleoclimatic context and the paleoclimatic implications of our results will be addressed.
4.1 Stratigraphy and exposure ages in the Valle San Francisco, Rio Suturi and Huara
10
Loma
Our stratigraphic field work in the Valle San Francisco corroborates previous detailed work by e.g. Jordan et al. (1993). A large number of (recessional) stages is docu-mented by numerous lateral and terminal moraines. Only the major stages could be sampled, however, due to the need for large boulders, which were not present on
15
moraines associated with minor stages (see Fig. 2 for the sampling locations). The oldest dated glacial deposit is an outer lateral moraine at ∼4670 m altitude, where three boulders yielded exposure ages of 18.5±0.8, 22.6±0.8 and 24.1±0.9 ka (sam-ples SF41-3). The dominant inner lateral moraine yields boulder ages of 17.2±0.7 and 19.3±0.6 ka (SF32 and 33) and probably correlates with a lateral moraine on the other
20
side of the valley, where two boulders date to 15.3±0.7 and 20.3±0.8 ka (SF12 and 13). Three boulders from a recessional terminal moraine in the valley bottom yield ex-posure ages of 9.4±0.6, 12.9±0.6 and 11.5±0.5 ka (SF51-3), and the youngest dated recessional terminal moraine, which dams the Laguna San Francisco, yielded boulder ages of 10.4±0.5 and 10.0±0.5 ka (SF21 and 22).
CPD
3, 839–869, 2007 Surface exposure dating in Bolivia R. Zech et al. Title Page Abstract Introduction Conclusions References Tables Figures ◭ ◮ ◭ ◮ Back CloseFull Screen / Esc
Printer-friendly Version Interactive Discussion
EGU In the Valle de Rio Suturi, two boulders from the prominent latero-frontal moraine
date to 13.0±0.8 and 11.6±0.6 ka (RM31 and 33, see Fig. 3). A boulder from an adjacent, stratigraphically older lateral moraine remnant has an exposure age of 10.1±0.8 ka (RM22). The oldest age in the Valle de Rio Suturi was obtained from the remnants of a middle moraine preserved between Valle de Rio Suturi and the
north-5
ern neighbouring valley: Boulder RM41 has an exposure age of 22.0±1.2 ka. Another boulder (RM42) from that location is 12.2±0.9 ka old. The most prominent of a number of recessional moraines was sampled as well. Boulder ages there are 12.2±0.7 and 10.3±0.7 ka (RM13 and 14). The youngest age was obtained from a terminal moraine up-valley (boulder RM51: 7.0±0.5 ka).
10
The stratigraphic situation in the Valle Huara Loma may be more complicated than initially thought (Fig. 4). The oldest exposure ages that we obtained are from boulders on an outer lateral moraine (16.9±0.6 and 14.6±0.5 ka, HH51 and 52). Just inside, another lateral moraine yields two boulder ages of 11.8±0.5 and 11.4±0.5 ka (HH41 and HH43). Up-valley, boulders on the large prominent lateral moraine yield exposure
15
ages of 13.3±0.6 and 11.5±0.4 ka (HH11 and 22). Two boulders from a recessional moraine are dated to 10.4±0.5 and 11.0±0.4 ka (HH31 and 32).
4.2 Exposure age scatter: inheritance versus degradation
Interpretation of exposure ages is principally limited by two possible sources of errors: “Inheritance” and “degradation”. Inherited nuclide concentration due to exposure
be-20
fore moraine deposition can lead to an overestimation of the deposition age. Although it is difficult to determine whether and to what extent a boulder was “pre-exposed”, prob-ability for inheritance is generally assumed to be very low (Shanahan and Zreda, 2000; Putkonen and Swanson, 2003). On the other hand, exposure ages may underestimate the deposition age, when formerly covered boulders were exposed after deposition,
25
e.g. due to denudation of the moraine matrix, frost-induced upheaval, toppling of boul-ders, melting of buried glacier ice etc. (Briner et al., 2005; Zech et al., 2005; Putkonen and O’neal, 2006). Furthermore, rock surface erosion has the same effect, as it results
CPD
3, 839–869, 2007 Surface exposure dating in Bolivia R. Zech et al. Title Page Abstract Introduction Conclusions References Tables Figures ◭ ◮ ◭ ◮ Back CloseFull Screen / Esc
Printer-friendly Version Interactive Discussion
EGU in loss of accumulated cosmogenic nuclides. The “oldest age model” suggests that,
generally, the oldest exposure age from a landform feature yields the best, although possibly still a too low estimate for its deposition age, unless, of course, it is identified as an old outlier due to inheritance based on the age distribution of a large dataset or based on the stratigraphic context.
5
In order to illustrate the scatter in our data and to identify possible outliers, we plot all exposure ages in stratigraphic order (Fig. 5). Our data set is admittedly too lim-ited to identify with certainty all boulders, which may have problems with prior expo-sure. Applying the “oldest age model” allows us to establish the following tentative chronology. In the Valle San Francisco the outer lateral moraine documents a glacial
10
advance at ∼24.1±0.9 ka (SF43). The subsequent prominent glacial advance is dated to ∼20.3±0.8 ka (SF13), and the recessional stages also yield stratigraphically con-sistent ages of 12.9±0.6 (SF52) and 10.4±0.5 ka (SF21), respectively. The age of the oldest deposit in the Valle de Rio Suturi clearly requires verification; it may be as old as 22.0±1.2 ka (RM41), but this conclusion is based only on a single age. The
15
prominent latero-frontal moraine is more confidently dated to ∼13.0±0.8 ka (RM31), although a younger exposure age of 10.1±0.8 ka (RM22) is obtained from the ad-jacent, stratigraphically older moraine remnant. The assumption that this 10.1 age is a “degradation” age is corroborated by the recessional moraine up-valley dated to ∼12.2±0.7 ka (RM13). Finally, a much younger age (7.0±0.5 ka, RM51) is obtained
20
from another recessional stage, but it awaits corroboration. In the Valle Huara Loma, a minimum age of 16.9±0.6 ka (HH51) characterizes the outer lateral moraine. We can only speculate about its correlation with the older moraines in the other two valleys, since both boulders clearly had signs of erosion and are not perfectly suited for SED (see photos in the supplementary material). The inner lateral moraine yields an age of
25
11.8±0.5 ka (HH41). This seems to contradict the minimum age inferred for the upper lateral moraine, which is tentatively dated to 13.3±0.6 ka (HH11). We note, however, that the complicated stratigraphic situation does not rule out that the lower, inner lateral moraine actually documents a glacial advance inside the older, high lateral moraine.
CPD
3, 839–869, 2007 Surface exposure dating in Bolivia R. Zech et al. Title Page Abstract Introduction Conclusions References Tables Figures ◭ ◮ ◭ ◮ Back CloseFull Screen / Esc
Printer-friendly Version Interactive Discussion
EGU Finally, the innermost recessional moraine is dated to 11.0±0.4 ka (HH32).
The above discussion shows that interpreting our dataset using the “oldest age model” leads to a generally consistent picture of glaciation: The oldest deposits are roughly dated to 22–25 ka (>17 ka in the Valle Huara Loma), and substantial read-vances – especially in the Cordillera Cochabamba – occurred between ∼11–13 ka.
5
Undoubtedly, more exposure ages would help to corroborate and refine the glacial chronologies in the research areas.
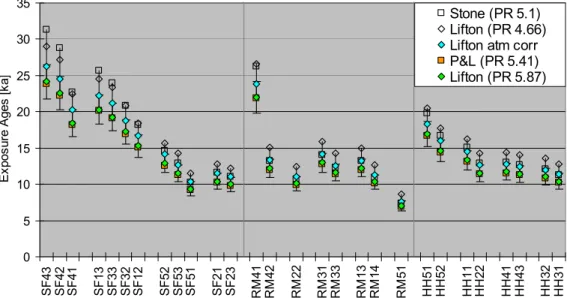
4.3 Systematic uncertainties of the exposure ages
Interpretation of exposure age chronologies in the paleoclimatic context requires awareness about the systematic uncertainties. These are uncertainties due to
scal-10
ing and the reference production rate. As already mentioned, there is no internation-ally accepted way to calculate exposure ages so far. The exposure ages presented above have been calculated according to Lifton et al. (2005). Their model takes into account past changes of the geomagnetic field intensity (composite model based on Guyodo and Valet, 1999; (Sint800); and Yang et al., 2000), the dipole wobble for the
15
Holocene (composite model based on Merrill and Mcelhinny, 1983; and Ohno and Hamano, 1993), and solar modulation (based on Solanki et al., 2004). Additionally, fast and slow muons are scaled independently of the neutron flux. We used a total ref-erence production rate of 5.87 atoms a−1g−1SiO2. This value has been derived from
calibration of the cosmogenic nuclide data that were used by Stone (2000) to derive
20
a production rate of 5.1 atoms a−1 g−1 SiO
2. Respective data were accessed in May
2007 from the website of the “Cosmogenic Isotope Laboratory, University of Washing-ton” (http://depts.washington.edu/cosmolab).Note that significantly younger exposure ages are obtained when using the scaling system of Lifton et al. (2005) instead of Stone (2000) (open squares in Fig. 6). Due to its simplicity, the scaling system of
25
Stone is still widely used, but major potential error sources are (i) that it is based on a relatively small neutron flux dataset, (ii) it neglects the altitude dependence of the energy spectrum of the cosmic radiation, and (iii) it does not take into account past
CPD
3, 839–869, 2007 Surface exposure dating in Bolivia R. Zech et al. Title Page Abstract Introduction Conclusions References Tables Figures ◭ ◮ ◭ ◮ Back CloseFull Screen / Esc
Printer-friendly Version Interactive Discussion
EGU changes of the geomagnetic field.
The 10% error bars for the “Lifton ages” in Fig. 6 illustrate the estimated total system-atic uncertainty of exposure dating according to Gosse and Phillips (2001). It includes mainly uncertainties related to the reference production rate and to scaling. Given that uncertainty the exposure ages calculated according to Pigati and Lifton (2004) (orange
5
squares in Fig. 6) are in very good agreement with the “Lifton ages”. Note that we up-dated the Pigati and Lifton spreadsheet, which is based on the scaling system of Desilets and Zreda (2003), with the new scaling coefficients published in Desilets et al. (2006). The reference production rate to use is 5.41 a−1 g−1 SiO2 – based on the
same calibration sites as outlined above. Calculations according to Dunai (2001) are
10
also in very good agreement, but results are not shown here because the applica-tion of that latter calculaapplica-tion scheme would ideally require local inclinaapplica-tion data of the geomagnetic field.
Apart from the selection of the applied scaling system, three more factors contribut-ing to the exposure age uncertainties shall briefly be discussed here: the use the
Stan-15
dard Atmosphere, neo-tectonics and the eustatic sea level change: (i) Altitude scaling requires the calculation of the atmospheric depth and the pressure, respectively, for the sampling locations. The application of the Standard Atmosphere, as used in the calculations above, is only a rough estimate for the real atmospheric conditions (Stone, 2000). Parameterisation of the pressure-altitude relationship in the Central Andes
ac-20
cording to Farber et al. (2005: sea level pressure 1012.8 instead of 1013.15 mbar, and sea-level temperature 301.73 instead of 288.15 K) would result in ages slightly older than the ones presented above (blue diamonds in Fig. 6). However, neither the temper-ature nor the lapse rate can be assumed to have been constant over time and reliable reconstructions of these parameters are not available. (ii) Concerning neo-tectonics,
25
they would also affect altitude scaling. Whereas Holocene exposure ages would hardly change, an uplift rate of 5 mm/a would already increase the calculated age of a “20 ka-boulder” by ∼2.5% (i.e. 0.5 ka). Although the main Andean orogenesis is generally assumed to have ceased several million years ago, there is geomorphologic evidence
CPD
3, 839–869, 2007 Surface exposure dating in Bolivia R. Zech et al. Title Page Abstract Introduction Conclusions References Tables Figures ◭ ◮ ◭ ◮ Back CloseFull Screen / Esc
Printer-friendly Version Interactive Discussion
EGU for very active regions today, e.g. faulted moraines, so that exposure age errors due
to neo-tectonics cannot be excluded. (iii) Finally, the lowering of the eustatic sea level during the LGM (e.g. Fleming et al., 1998) increases the “apparent” altitude of the samples. A correction of ∼2.5% towards younger ages would, for example, seem to be necessary for a 20 ka-boulder. However, according to Osmaston (2006), air pressure
5
and thus altitude scaling at a given location do not change because of replacement of air by the growing ice sheet masses during the LGM.
Summarizing, we emphasize that although we currently favour the application of the calculation scheme according to Lifton et al. (2005) as outlined above, there is an urgent need for local calibration studies in the Andes in order to better constrain the
10
systematic uncertainties. This is not only important with regards to the scaling system, but also with regards to the reference production rate, which will be addressed later on in more detail.
4.4 Paleoclimatic context and implications
In the following, we will first compare our results with the surface exposure age
15
chronologies of Smith et al. (2005a, b) and Farber et al. (2005), then with independent age controls on the glacial history in the research area. Thereafter, we will discuss the role of temperature and precipitation on the glaciation in the Central Andes.
4.4.1 Comparison with published surface exposure ages
Our exposure age dataset from Bolivia is admittedly small. In order to derive
mean-20
ingful paleoclimatic interpretations we can, however, refer to the large dataset of Smith et al. (2005a, 5b) and Farber et al. (2005). Based on more than hundred10Be surface exposure ages Smith et al. had suggested that glaciers reached their greatest extent at ∼34 ka and were retreating by ∼21 ka (Ages published in Smith et al., 2005a; are slightly younger than the ones published in Smith et al., 2005b, because geomagnetic
25
CPD
3, 839–869, 2007 Surface exposure dating in Bolivia R. Zech et al. Title Page Abstract Introduction Conclusions References Tables Figures ◭ ◮ ◭ ◮ Back CloseFull Screen / Esc
Printer-friendly Version Interactive Discussion
EGU glacial advances to ∼29 and 16.5 ka (geomagnetically corrected), respectively. These
results seem to disagree with our chronology (glacial advances at ∼22–25 and 11– 13 ka), but re-calculation of the exposure ages of Smith et al. and Farber et al. using Lifton et al. (2005) instead of Stone (2000) yields considerably lower ages. Figure 7 illustrates this for the samples from Valle Antacocha in Peru. The recalculated
expo-5
sure ages are in much better agreement with our results, indicating that the maximum glaciation during the last glacial cycle occurred at ∼22–25 ka, i.e. much later than pre-viously assumed and roughly synchronous with the global temperature minimum. A recessional moraine in the Valle Antacocha is recalculated to ∼15 ka. This advance is clearly older than the Late Glacial advances that we dated. Younger Late Glacial
10
moraines (recalculated ages ∼12 ka) are described, however, for example in the Cal-calcocha Valley (Smith et al.) or at the “Breque” site in Peru (also shown in Fig. 7) (Farber et al., 2005). Note that for illustration in Fig. 7 we intentiously chose moraines with a low scatter in ages only. Larger scatter indicates that the glacial morphologies may be more complicated or that dating those moraines is more challenging due to
15
rock surface erosion or landscape instability.
The Breque moraine deserves further emphasis, because it may actually serve as a local calibration site, independently dated to ∼13.1 cal. ka BP (Rodbell and Seltzer, 2000; Farber et al., 2005) (blue box in Fig. 7). Although the “Lifton ages” seem to be too young, we argue that his scaling system is nevertheless preferable over the one of
20
Stone (2000) based on the reasons outlined above. Including atmospheric correction (blue diamonds) increases the exposure ages, but still the mean of all boulders seems to result in a significant age underestimation. Because the Breque site yields a ref-erence production rate of only 4.66 atoms a−1 g−1 SiO2and appears to be an outlier
compared to all other calibration sites, we currently hesitate to include it in the
calcu-25
lation of the mean reference production rate (5.87 atoms a−1g−1SiO
2). On the other
hand, we cannot totally exclude the possibility that using Breque as local calibration site yields the best estimates for the real exposure ages in the tropical Andes. Cor-responding results are therefore also shown in Fig. 6. The need for further research
CPD
3, 839–869, 2007 Surface exposure dating in Bolivia R. Zech et al. Title Page Abstract Introduction Conclusions References Tables Figures ◭ ◮ ◭ ◮ Back CloseFull Screen / Esc
Printer-friendly Version Interactive Discussion
EGU to reduce the exposure age uncertainties, particularly the need for more high-altitude
calibration sites, is obvious. 4.4.2 Independent age control
There is not much independent dating control on the glacial advances in the Central Andes with which to evaluate our exposure age chronology. Most previous work is
5
based on morphology, soil development and bedded slope deposits (e.g. Lauer and Rafiqpoor, 1986; Lauer and Rafiqpoor, 1989; Jordan et al., 1993; Reuter et al., 1995; Heine, 1996). Numerous minimum radiocarbon ages for moraines have been reported from basal peat and lake sediments (summarized in Smith et al., 2005c: minimum ages range from 9 to 12 14C ka BP. Note that calibrated ages are older than 14C
10
ages. Use e.g. http://www.calpal-online.de if necessary). In Peru, maximum-limiting
14
C ages suggest that substantial glacial stillstands or readvances there occurred be-tween ∼16-13 cal ka BP (Rodbell, 1993; Seltzer et al., 1995; Rodbell and Seltzer, 2000). Maximum-limiting14C ages in Bolivia are available for the Valle San Francisco (∼3314C ka BP: Argollo, 1980) and bracketing ages exist for the Rio Kollpa ˜na (Servant
15
et al., 1981: 16.6 and 2714C ka BP, respectively). All these data are in agreement with our results of a maximum glaciation at ∼22–25 ka and deglaciation after ∼11 ka.
There are, however, also findings that have been interpreted to corroborate an early local LGM: First, a minimum age for a glacial advance of ∼20 14C ka BP has been reported from the Laguna Kollpa Khota (Seltzer, 1994). We argue that this age
20
(∼24 cal ka BP) does not necessarily contradict our proposed chronology, because it is just a minimum age for a potentially much older, and more extensive glaciation than the last one. Secondly, the sudden drops of magnetic susceptibility (MS, a proxy for glacial flour) in the sediments of Lake Titicaca and Lake Junin at ∼20 ka BP have led Seltzer et al. (2002) to conclude that deglaciation occurred much earlier than in the Northern
25
Hemisphere. Glacial flour may be trapped very effectively as soon as the most exten-sive glacial stage is abandoned and a sediment trap is created behind the terminal moraines. Subsequent, although still significant, glacier fluctuations may therefore not
CPD
3, 839–869, 2007 Surface exposure dating in Bolivia R. Zech et al. Title Page Abstract Introduction Conclusions References Tables Figures ◭ ◮ ◭ ◮ Back CloseFull Screen / Esc
Printer-friendly Version Interactive Discussion
EGU be recorded in the MS signal. In fact, the MS signal in core NE985PC in Lake
Titi-caca (close to the Cordillera Real) reaches high values only between 25 and 20 ka BP (Seltzer et al., 2002), indicating that the glaciers there (e.g. in the Valle San Francisco) advanced during and not before that time. Our chronology is also in good agreement with a maximum14C age of 24.4 ka BP (∼27.4 cal ka BP) obtained from a soil
inter-5
calated between two moraines in the Cordillera Tunari near Cochabamba (J.-H. May, 2007, personal communication). The last glacial ice advance thus did not reach that site before that time. The basal moraine is much more weathered and older; it prob-ably correlates with glacial advances from earlier glacial cycles (see e.g. Smith et al., 2005a).
10
4.4.3 Glaciation – the role of temperature
Modelling studies in the humid parts of the Eastern Cordillera show the high sensi-tivity of the glacier mass balance to temperature changes (Klein et al., 1999; Kull et al., 2003; Imhof et al., 2006; Kull et al., 2007). Provided that moisture availability did not become a limiting factor in the past, glacial advances should therefore have
co-15
incided with temperature minima, i.e. particularly the LGM at ∼20–25 ka. During the Late Glacial and the general warming trend, a sudden drop in temperature occurred both in Antarctica, known as Antarctic Cold Reversal (ACR) (Petit et al., 1999), and in the Northern Hemisphere, known as the Younger Dryas (YD) (NGRIP members 2004). The ACR slightly predates the YD. Both high-latitude cold events were likely able to
sig-20
nificantly affect the low-latitude temperatures (Clement et al., 2004; Chiang and Bitz, 2005) and thus to provide favourable conditions for the Late Glacial advances in the Eastern Cordilleras between ∼11 and 13 ka. The earlier advances dated to 15 ka may coincide with the Heinrich 1 event, during which very cold conditions are documented in the North Atlantic region.
25
Based on climate modelling, Clement et al. (2004) suggested that, in contrast to glacial forcing by high-latitude temperatures, precessional solar forcing has only a mi-nor influence on tropical temperatures. Nevertheless, we point out that the significant
CPD
3, 839–869, 2007 Surface exposure dating in Bolivia R. Zech et al. Title Page Abstract Introduction Conclusions References Tables Figures ◭ ◮ ◭ ◮ Back CloseFull Screen / Esc
Printer-friendly Version Interactive Discussion
EGU Late Glacial advances dated to ∼11–13 ka coincide with the minimum austral summer
insolation (December). Their large extent relative to the LGM advances may therefore partly be due to direct insolation forcing, i.e. reduced ablation.
4.4.4 Glaciation – the role of precipitation
It has previously been suggested that glacial advances in the Central Andes were
5
synchronous with massive pre-LGM and Late Glacial wet phases on the Altiplano (Choqueyapu I and Choqueyapu II advances, and the ‘Minchin’ and ‘Tauca’ phases, respectively) (e.g. Servant and Fontes, 1978; Clayton and Clapperton, 1995; Clapper-ton et al., 1997; ClayClapper-ton and ClapperClapper-ton, 1997; Sylvestre et al., 1999). A recent study applying14C and U/Th dating techniques could, however, not corroborate the existence
10
of the Minchin wet period (Placzek et al., 2006). Shorelines from three deep paleolakes on the Altiplano were dated to 120–98 ka (called “Ouki”), 18–14 ka (“Tauca”) and 13– 11 ka (“Coipasa”). Only shallow lakes existed between 98 and 18 ka. Note that these findings do not necessarily disagree with sediment-core records in the Salar de Uyuni indicating wet conditions from ∼25 to 15 ka (Baker et al., 2001b). This is because the
15
cores do not only provide information about the local hydrological conditions, but also record overflow of Lake Titicaca to the north. There, several lake level proxies show high moisture availability since 25 ka except for the dry Mid-Holocene (Baker et al., 2001a).
With regard to the glacial history, the precipitation records on the Altiplano are
20
interpreted as follows: Glaciers in the relatively “wet” Eastern Cordilleras are sen-sitive to temperature changes and therefore advanced at ∼20–25, ∼15 and ∼11– 13 ka. Of course, very humid conditions during the Tauca and Coipasa phase provided favourable conditions for Late Glacial glacier advances. This is corroborated by high accumulation-ablation-ratios (AARs ∼0.8) reconstructed for the respective moraines
25
(Kull et al., 2007). On the other hand, glaciation in the “dry” areas further south and west is much more sensitive to moisture availability (Kull, 1999; Kull and Grosjean, 2000; Kull et al., 2007). This is reflected by the lack of LGM moraines. Instead,
mas-CPD
3, 839–869, 2007 Surface exposure dating in Bolivia R. Zech et al. Title Page Abstract Introduction Conclusions References Tables Figures ◭ ◮ ◭ ◮ Back CloseFull Screen / Esc
Printer-friendly Version Interactive Discussion
EGU sive Late Glacial glacier advances on the Altiplano and the Western Cordillera have
been described and dated for example by Clapperton et al. (1997) and Clayton and Clapperton (1997).
5 Conclusions
We conducted10Be surface exposure dating on 28 boulders from moraines in three
5
research areas in the Cordillera Real and the Cordillera Cochabamba. Being aware of sample-specific uncertainties, like pre-exposure, landform surface instability and rock surface erosion, we tentatively established a glacial chronology applying the “oldest age model”. Maximum glaciation is dated to ∼22–25 ka, and Late Glacial advances occurred between 11 and 13 ka. Our results are in good agreement with previously
10
published exposure age chronologies from the Eastern Cordillera in Bolivia and Peru (Farber et al., 2005; Smith et al., 2005a; Smith et al., 2005b), provided that the same calculation schemes are applied. We argue that the application of the recently pub-lished scaling system of Lifton et al. (2005) yields more accurate exposure ages than the still most widely used calculation scheme of Stone (2000). Apart from the selection
15
of the scaling system, exposure age uncertainties are due to the choice of the refer-ence production rate, i.e. the choice of the calibration sites. In the Andes, exposure ages may require large corrections for persistent altitude-pressure anomalies.
Our glacial chronology derived from surface exposure dating is consistent with pub-lished radiocarbon data, lake sediment analyses, and results from
glacier-climate-20
modelling. Glaciation in the relatively wet areas of the Andes are mainly temperature-sensitive, i.e. roughly synchronous with the global LGM and the cold reversals during the Late Glacial (YD and ACR). On the other hand, glaciation in the drier parts of the Andes is mainly precipitation-sensitive; glaciers therefore reached a maximum extent synchronous with the ‘Tauca’ and “Coipasa” humid phase during the Late Glacial.
25
Overall, our study highlights (i) the limitations of exposure studies due to sample-specific uncertainties and the resultant need for a large exposure age dataset, (ii) the
CPD
3, 839–869, 2007 Surface exposure dating in Bolivia R. Zech et al. Title Page Abstract Introduction Conclusions References Tables Figures ◭ ◮ ◭ ◮ Back CloseFull Screen / Esc
Printer-friendly Version Interactive Discussion
EGU limitations due to systematic uncertainties and the resultant need for local calibration
studies, and (iii) the huge potential of surface exposure dating for the reconstruction of the glacial and climate history in the Central Andes, and a better understanding of the forcings and mechanisms of Late Quaternary climate change in general.
Acknowledgements. We thank the Swiss National Science Foundation for funding (SNF project
5
21-067937.02/1), N. Lifton and M. Vuille for very detailed and helpful comments and discus-sions on a previous version of this manuscript, and J. Ilgner for help with calculating production rates and exposure ages. R. Zech gratefully acknowledges the support by the “Studienstiftung des deutschen Volkes e.V.”.
References
10
Ammann, C., Jenny, B., Kammer, K., and Messerli, B.: Late Quaternary Glacier response to hu-midity changes in the arid Andes of Chile (18–29◦S), Palaeogeography, Palaeoclimatology,
Palaeoecology, 172, 313–326, 2001.
Argollo, J.: Los Pie de Montes de la Cordillera Real entre los Valles de La Paz y de Tuni: Estu-dio Geologico, Evolution Plio-Cuaternaria. Tesis de Grado, Departamento de Geociencias,
15
Facultad de Ciencias Puras y Naturales, Universidad Mayor de San Andres, La Paz, Bolivia, 100 pp, 1980.
Baker, P. A., Rigsby, C. A., Seltzer, G. O., Fritz, S. C., Lowenstein, T. K., Bacher, N. P., and Veliz, C.: The history of South American tropical precipitation for the past 25 000 years, Science, 291, 640–643, 2001a.
20
Baker, P. A., Rigsby, C. A., Seltzer, G. O., Fritz, S. C., Lowenstein, T. K., Bacher, N. P., and Veliz, C.: Tropical climate changes at millennial and orbital timescales on the Bolivian Altiplano, Nature, 409, 698–701, 2001b.
Briner, J. P., Kaufman, D. S., Manley, W. F., Finkel, R. C., and Caffee, M. W.: Cosmogenic exposure dating of late Pleistocene moraine stabilization in Alaska, Geological Society of
25
America Bulletin, 117(7), 1108–1120, 2005.
Chiang, J. and Bitz, C.: Influence of high latitude ice cover on the marine Intertropical Conver-gence Zone, Climate Dynamics, 25(5), 477–496, 2005.
CPD
3, 839–869, 2007 Surface exposure dating in Bolivia R. Zech et al. Title Page Abstract Introduction Conclusions References Tables Figures ◭ ◮ ◭ ◮ Back CloseFull Screen / Esc
Printer-friendly Version Interactive Discussion
EGU glacier advances and palaeolake highstands in the Bolivian Altiplano, Quaternary
Interna-tional, 38–39, 49–59, 1997.
Clayton, J. D. and Clapperton, C. M.: The last glacial cycle and paleolake synchrony in the southern Bolivian Altiplano: Cerro Azanaques case study, Bull. Inst. Fr. Etudes Andines, 24, 563–571, 1995.
5
Clayton, J. D. and Clapperton, C. M.: Broad Synchrony of a Late-Glacial Glacier Advance and the Highstand of Palaeolake Tauca in the Bolivian Altiplano, Journal of Quaternary Science, 12, 169–182, 1997.
Clement, A. C., Hall, A., and Broccoli, A. J.: The importance of precessional signals in the tropical climate, Clim. Dyn., 22(4), 327–341, 2004.
10
Desilets, D. and Zreda, M.: On scaling cosmogenic nuclide production rates for altitude and latitude using cosmic-ray measurements, Earth Planet. Sci. Lett., 193, 213–225, 2001. Desilets, D. and Zreda, M.: Spatial and temporal distribution of secondary cosmic-ray nucleon
intensities and applications to in situ cosmogenic dating, Earth Planet. Sci. Lett., 206, 21–42, 2003.
15
Desilets, D., Zreda, M., and Prabu, P.: Extended scaling factors for in situ cosmogenic nuclides: New measurements at low latitude, Earth Planet. Sci. Lett., 246, 265–276, 2006.
Dunai, T. J.: Scaling factors for production rates of in-situ produced cosmogenic nuclides: a critical reevaluation, Earth Planet. Sci. Lett., 176, 157–169, 2000.
Dunai, T. J.: Influence of secular variation of the geomagnetic field on production rates of in situ
20
produced cosmogenic nuclides, Earth Planet. Sci. Lett., 193, 197–212, 2001.
Dunne, A., Elmore, D., and Muzikar, P.: Scaling factors for the rates of production of cosmogenic nuclides for geometric shielding and attenuation at depth on sloped surfaces, Geomorphol-ogy, 27, 3–11, 1999.
Farber, D. L., Hancock, G. S., Finkel, R. C., and Rodbell, D. T.: The age and extent of tropical
25
alpine glaciation in the Cordillera Blanca, Peru, J. Quat. Sci., 20(7–8), 759–776, 2005. Fleming, K., Johnston, P., Zwartz, D., Yokoyama, Y., Lambeck, K., and Chappell, J.: Refining
the eustatic sea-level curve since the Last Glacial Maximum using far- and intermediate-field sites, Earth Planet. Sci. Lett., 163(1–4), 327–342, 1998.
Gosse, J. C. and Phillips, F. M.: Terrestrial in situ cosmogenic nuclides: theory and application,
30
Quat. Sci. Rev., 20, 1475–1560, 2001.
Guyodo, Y. and Valet, J. P.: Global changes in intensity of the Earth’s magnetic field during the past 800 kyr, Nature, 399, 249–252, 1999.
CPD
3, 839–869, 2007 Surface exposure dating in Bolivia R. Zech et al. Title Page Abstract Introduction Conclusions References Tables Figures ◭ ◮ ◭ ◮ Back CloseFull Screen / Esc
Printer-friendly Version Interactive Discussion
EGU Harrison, S. P.: The Pleistocene glaciations of Chile, in: Quaternary Glaciations – Extent and
Chronology. Part III: South America, Asia, Africa, Australasia, Antarctica, edited by: Ehlers, J. and Gibbard, P. L., Cambridge, 2004.
Heine, K.: The extent of the last glaciation in the Bolivian Andes (Cordillera Real) and paleocli-mate implications, Z. Geomorph. N.F., 104, 187–202, 1996.
5
Heine, K.: Late Quaternary glaciations of Bolivia. in: Quaternary Glaciations - Extent and Chronology. Part III: South America, Asia, Africa, Australasia, Antarctica, edited by: Ehlers, J. and Gibbard, P. L., Cambridge, 2004.
Imhof, S., Kull, C., May, J.-H., Grosjean, M., and Veit, H.: Massive cooling of –6.5◦C caused local last glaciation maximum (LLGM) in the east-Andean Cordillera around
10
Cochabamba/Bolivia (17◦S), Geographica Helvetica, 61, 91–106, 2006.
Ivy-Ochs, S.: The dating of rock surface using in situ produced10Be,26Al and36Cl, with ex-amples from Antarctica and the Swiss Alps. Dissertation ETH No. 11763, Z ¨urich, 197 pp., 1996.
Jordan, T. E., Reuter, G., Leinweber, P., Alfaro, H., and Condo, A.: Pleistocene moraine
se-15
quences in different areas of glaciation in the Bolivian Andes, Zbl. Geol. Pal ¨aontol., H 1/2, 455–470, 1993.
Kaser, G.: Glacier-climate interaction at low latitudes, Journal of Glaciology, 47(157), 195–204, 2001.
Klein, A. G., Seltzer, G. O., and Isacks, B. L.: Modern and Last Local Glacial Maximum
snow-20
lines in the Central Andes of Peru, Bolivia and Northern Chile, Quat. Sci. Rev., 18, 63–84, 1999.
Kull, C.: Modellierung pal ¨aoklimatischer Verh ¨altnisse basierend auf der jungpleistoz ¨anen Ver-gletscherung in Nordchile – Ein Fallbeispiel aus den Nordchilenische Anden, Z. Gletscherk. Glazialgeol., 35, 35–64, 1999.
25
Kull, C. and Grosjean, M.: Late Pleistocene climate conditions in the North Chilean Andes drawn from a Climate-Glacier Model, J. Glaciol., 46, 622–632, 2000.
Kull, C., Grosjean, M., and Veit, H.: Modeling Modern and Late Pleistocene Glacio-Climatological Conditions in the North Chilean Andes (29–30◦), Climatic Change, 52, 359–
381, 2002.
30
Kull, C., Hanni, F., Grosjean, M., and Veit, H.: Evidence of an LGM cooling in NW-Argentina (22◦S) derived from a glacier climate model, Quaternary International, 108(1), 3–11, 2003.
CPD
3, 839–869, 2007 Surface exposure dating in Bolivia R. Zech et al. Title Page Abstract Introduction Conclusions References Tables Figures ◭ ◮ ◭ ◮ Back CloseFull Screen / Esc
Printer-friendly Version Interactive Discussion
EGU the Central Andes: Temperature versus humidity control - A case study from the
east-ern Bolivian Andes (17◦S) and regional synthesis, Global and Planetary Change, in press,
doi:10.1016/j.gloplacha.2007.03.011, 2007.
Lal, D.: Cosmic ray labeling of erosion surfaces: In situ nuclide production rates and erosion models, Earth Planet. Sci. Lett., 104, 429–439, 1991.
5
Lauer, W. and Rafiqpoor, M. D.: Die jungpleistoz ¨ane Vergletscherung im Vorland der Apolobamba-Kordillere (Bolivien), Erdkunde, 40, 125-145, 1986.
Lauer, W. and Rafiqpoor, M. D.: Zum Stand der Pleistoz ¨anforschung in der nord ¨ostlichen Ko-rdillere von Bolivien, Erdkunde, 43, 228–231, 1989.
Lifton, N. A., Bieber, J. W., Clem, J. M., Duldig, M. L., Evenson, P., Humble, J. E., and Pyle,
10
R.: Addressing solar modulation and long-term uncertainties in scaling secondary cosmic rays for in situ cosmogenic nuclide applications, Earth Planet. Sci. Lett., 239(1–2), 140–161, 2005.
Mark, B. G., Seltzer, G. O., and Rodbell, D. T.: Late Quaternary glaciations of Ecuador, Peru and Bolivia. in: Quaternary Glaciations – Extent and Chronology. Part III: South America,
15
Asia, Africa, Australasia, Antarctica, edited by: Ehlers, J. and Gibbard, P. L., Cambridge, 2004.
Markgraf, V., Baumgartner, T. R., Bradbury, J. P., Diaz, H. F., B. Dunbar, R., Luckman, B. H., Seltzer, G. O., Swetnam, T. W., and Villalba, R.: Paleoclimate reconstruction along the Pole-Equator-Pole transect of the Americas (PEP 1), Quat. Sci. Rev., 19(1–5), 125–140, 2000.
20
Merrill, R. T. and Mcelhinny, M. W.: The Earth’s Magnetic Field: Its History, Origin, and Plane-tary Perspective, London (Academic Press), pp. 401 pp., 1983.
Ngrip Members: High-resolution record of Northern Hemisphere climate extending into the last interglacial period, Nature, 431, 147–151, 2004.
Ohno, M. and Hamano, Y.: Global analysis of the geomagnetic field: Time variation of the dipole
25
moment and the geomagnetic pole in the Holocene, J. Geomag. Geoelectr., 45, 1455–1466, 1993.
Osmaston, H. A.: Should Quaternary sea-level changes be used to correct glacier ELAs, veg-etation belt altitudes and sea level temperatures for inferring climate changes?, Quat. Res., 65, 244–251, 2006.
30
Petit, J. R., Jouzel, J., Raynaud, D., Barkov, N. I., Barnola, J.-M., Basile, I., Bender, M., Chap-pellaz, J., Davis, M., Delaygue, G., Delmotte, M., Kotlyakov, V. M., Legrand, M., Lipenkov, V. Y., Lorius, C., Pepin, L., Ritz, C., Saltzman, E., and Stievenard, M.: Climate and atmospheric
CPD
3, 839–869, 2007 Surface exposure dating in Bolivia R. Zech et al. Title Page Abstract Introduction Conclusions References Tables Figures ◭ ◮ ◭ ◮ Back CloseFull Screen / Esc
Printer-friendly Version Interactive Discussion
EGU history of the past 420 000 years from the Vostok ice core, Antarctica, Nature, 399, 6735,
429–436, 1999.
Pigati, J. S. and Lifton, N. A.: Geomagnetic effects on time-integrated cosmogenic nuclide production with emphasis on in situ14C and 10Be, Earth Planet. Sci. Lett., 226, 193–205, 2004.
5
Placzek, C., Quade, J., and Patchett, P. J.: Geochronology and stratigraphy of late Pleistocene lake cycles on the southern Bolivian Altiplano: Implications for causes of tropical climate change, Geological Soc. Am. Bull., 118(5), 515–532, 2006.
Putkonen, J. and O’neal, M.: Degradation of unconsolidated Quaternary landforms in the west-ern North America, Geomorphology, 75(3–4), 408–419, 2006.
10
Putkonen, J. and Swanson, T.: Accuracy of cosmogenic ages for moraines, Quaternary Re-search, 59, 255–261, 2003.
Reuter, G., Jordan, T. E., Leinweber, P., and Condo, A.: Eigenschaften, Entwicklungstenden-zen und Altersunterschiede von Mor ¨anenb ¨oden in den bolivianischen Anden, Petermanns Geographische Mitteilungen, 139, 259–282, 1995.
15
Rodbell, D. T.: The timing of the last deglaciation in Cordillera Oriental, northern Peru, based on glacial geology and lake sedimentology, Geological Soc. Am. Bull., 105, 923–934, 1993. Rodbell, D. T. and Seltzer, G. O.: Rapid ice margin fluctuations during the Younger Dryas in the
Tropical Andes, Quaternary Research, 54, 328-338, 2000.
Schaefer, J. M., Denton, G. H., Barrell, D. J. A., Ivy-Ochs, S., Kubik, P., Andersen, B. G., Phillips,
20
F. M., Lowell, T. V., and Schl ¨uchter, C.: Near-synchronous interhemispheric termination of the Last Glacial Maximum in mid-latitudes, Science, 312, 1510–1513, 2006.
Seltzer, G. O.: A lacustrine record of late Pleistocene climatic change in the subtropical Andes, Boreas, 23, 105–111, 1994.
Seltzer, G. O., Rodbell, D. T., and Abbott, M.: Andean glacial lakes and climate variability since
25
the last glacial maximum, Bulletin de L’Institut Francais d’Etudes Andines, 24(3), 539–549, 1995.
Seltzer, G. O., Rodbell, D. T., Baker, P. A., Fritz, S. C., Tapia, P. M., Rowe, H. D., and Dunbar, R. B.: Early warming of tropical South America at the last glacial-interglacial transition, Science, 296, 1685–1686, 2002.
30
Servant, M. and Fontes, J.: Les lacs quaternaires des hauts plateaux des Andes Boliviennes: Premieres interpretations paleoclimatiques, Cah. O.R.S.T.O.M., Ser. Geol, 10, 9–23, 1978. Servant, M., Fontes, J., Argollo, J., and Saliege, J. F.: Variations du regime et de la nature
CPD
3, 839–869, 2007 Surface exposure dating in Bolivia R. Zech et al. Title Page Abstract Introduction Conclusions References Tables Figures ◭ ◮ ◭ ◮ Back CloseFull Screen / Esc
Printer-friendly Version Interactive Discussion
EGU des precipitations au cours des 15 derniers millenaires dans les Andes de Bolivie, Comptes
Rendus de l’Academie des Sciences Paris, Serie II 292, 1209–1212, 1981.
Shanahan, T. M. and Zreda, M.: Chronology of Quaternary glaciations in East Africa, Earth Planet. Sci. Lett., 177, 23–42, 2000.
Shulmeister, J., Rodbell, D. T., Gagan, M. K., and Seltzer, G. O.: Inter-hemispheric linkages in
5
climate change: paleo-perspectives for future climate change, Clim. Past Discuss., 2, 79– 122, 2006,
http://www.clim-past-discuss.net/2/79/2006/.
Smith, J. A., Finkel, R. C., Farber, D. L., Rodbell, D. T., and Seltzer, G. O.: Moraine preservation and boulder erosion in the tropical Andes: interpreting old surface exposure ages in glaciated
10
valleys, J. Quat. Sci., 20(7–8), 735–758, 2005a.
Smith, J. A., Seltzer, G. O., Farber, D. L., Rodbell, D. T., and Finkel, R. C.: Early Local Last Glacial Maximum in the Tropical Andes, Science, 308, 678–681, 2005b.
Smith, J. A., Seltzer, G. O., Rodbell, D. T., and Klein, A. G.: Regional synthesis of last glacial maximum snowlines in the tropical Andes, South America, Quaternary International, 138–
15
139, 145–167, 2005c.
Solanki, S. K., Usoskin, I. G., Kromer, B., Sch ¨ussler, M., and Beer, J.: Unusual activity of the Sun during recent decades compared to the previous 11 000 years, Nature, 431, 1084–1087, 2004.
Stone, J. O.: Air pressure and cosmogenic isotope production, J. Geophys. Res., 105, 23 753–
20
23 759, 2000.
Sylvestre, F., Servant, M., Servant-Vildary, S., Causse, C., Fournier, M., and Ybert, J.-P.: Lake-Level Chronology on the Southern Bolivian Altiplano (18–23 S) during Late-Glacial Time and the Early Holocene, Quat. Res., 51, 54–66, 1999.
Vuille, M. and Ammann, C.: Regional Snowfall Patterns in the High, Arid Andes (South
Amer-25
ica), Climatic Change, 36, 413–423, 1997.
Vuille, M. and Keimig, F.: Interannual Variability of Summertime Convective Cloudiness and Precipitation in the Central Andes Derived from ISCCP-B3 Data, J. Climate, 17(17), 3334– 3348, 2004.
Yang, S., Odah, H., and Shaw, J.: Variations in the geomagnetic dipole moment over the last
30
12 000 years, Geophys. J. Int., 140, 158–162, 2000.
Zech, R., Glaser, B., Sosin, P., Kubik, P. W., and Zech, W.: Evidence for long-lasting landform surface instability on hummocky moraines in the Pamir Mountains from surface exposure
CPD
3, 839–869, 2007 Surface exposure dating in Bolivia R. Zech et al. Title Page Abstract Introduction Conclusions References Tables Figures ◭ ◮ ◭ ◮ Back CloseFull Screen / Esc
Printer-friendly Version Interactive Discussion
EGU dating, Earth Planet. Sci. Lett. 237, 453–461, 2005.
Zhou, J. and Lau, K.-M.: Does a monsoon climate exist over South America?, Journal of Climate, 11(5), 1020–1040, 1998.
CPD
3, 839–869, 2007 Surface exposure dating in Bolivia R. Zech et al. Title Page Abstract Introduction Conclusions References Tables Figures ◭ ◮ ◭ ◮ Back CloseFull Screen / Esc
Printer-friendly Version Interactive Discussion
EGU Table 1. Sample data and exposure ages calculated according to Lifton et al. (2005), Pigati
and Lifton (2004) (“P & L”) and Stone (2000). Reference production rates are 5.87, 5.41 and 5.1 atoms a−1g−1SiO
2, respectively, calculated from the calibrations sites used by Stone (2000).
Sample Latitude Longitude Altitude 10Be AMS SD aTopographic
Shielding Exposure Ages c Exposure Ages Exposure Ages °S °W [m a.s.l.] [105 at/g SiO
2] [%] Factor b Lifton [ka] P & L Stone
Valle San Francisco:
SF12 15.97 68.53 4752 10.78 4.3 1 15.3± 0.7 15.1 18.2 SF13 15.97 68.53 4750 15.19 3.9 1 20.3± 0.8 20.1 25.7 SF21 15.94 68.53 4600 6.32 4.5 0.98 10.4± 0.5 10.2 11.6 SF23 15.94 68.53 4601 6.02 4.5 0.98 10.0± 0.5 9.8 11.0 SF32 15.97 68.55 4690 12.05 4.0 1 17.2± 0.7 16.9 20.9 SF33 15.98 68.55 4691 13.85 3.2 1 19.3± 0.6 19.1 24.0 SF41 15.98 68.54 4665 12.95 4.4 1 18.5± 0.8 18.2 22.7 SF42 15.98 68.54 4666 16.42 3.5 1 22.6± 0.8 22.3 28.8 SF43 15.98 68.54 4667 17.87 3.5 1 24.1± 0.9 23.8 31.3 SF51 16.00 68.54 4470 5.40 6.1 1 9.4± 0.6 9.2 10.3 SF52 16.00 68.54 4471 7.64 4.3 1 12.9± 0.6 12.6 14.6 SF53 16.00 68.54 4472 6.80 4.0 1 11.5± 0.5 11.3 13.0 Valle de Rio Suturi:
RM13 17.23 66.44 3930 5.33 5.8 0.97 12.2± 0.7 12.0 13.3 RM14 17.23 66.44 3931 4.40 6.8 0.97 10.3± 0.7 10.1 10.9 RM22 17.23 66.46 3801 4.02 7.6 0.97 10.1± 0.8 9.9 10.7 RM31 17.23 66.46 3780 5.24 5.9 0.97 13.0± 0.8 12.8 14.0 RM33 17.23 66.46 3780 4.61 5.2 0.97 11.6± 0.6 11.4 12.3 RM41 17.22 66.47 3863 10.30 5.6 0.98 22.0± 1.2 21.9 26.3 RM42 17.22 66.47 3868 5.23 7.0 0.98 12.2± 0.9 12.0 13.3 RM51 17.22 66.41 4344 3.59 7.6 0.97 7.0± 0.5 6.9 7.3 Valle Huara Loma:
HH11 17.22 66.26 4380 7.74 4.7 1 13.3± 0.6 13.1 15.1 HH22 17.21 66.26 4360 6.56 3.7 1 11.5± 0.4 11.4 12.9 HH31 17.21 66.27 4212 5.25 4.9 0.98 10.4± 0.5 10.2 11.3 HH32 17.21 66.27 4213 5.61 3.8 0.98 11.0± 0.4 10.8 12.1 HH41 17.20 66.26 4225 6.20 4.6 1 11.8± 0.5 11.5 13.0 HH43 17.20 66.26 4225 6.04 4.4 1 11.4± 0.5 11.3 12.6 HH51 17.21 66.26 4222 9.41 3.6 1 16.9± 0.6 16.7 19.8 HH52 17.21 66.26 4223 7.93 3.5 1 14.6± 0.5 14.4 16.7 σ σ a
AMS SD = 1σ standard deviation of the AMS measurement
b
all ages are additionally corrected with a sample thickness factor of 0.97 (∼3–4 cm)
CPD
3, 839–869, 2007 Surface exposure dating in Bolivia R. Zech et al. Title Page Abstract Introduction Conclusions References Tables Figures ◭ ◮ ◭ ◮ Back CloseFull Screen / Esc
Printer-friendly Version Interactive Discussion
EGU Fig. 1. Location of the research areas. The Valle San Francisco (Cordillera Real) and the
Valle de Rio Suturi and Huara Loma (Cordillera Cochabamba) are situated at the north-eastern transition zone from the Altiplano to the lowlands of Bolivia and the Amazon Basin. SASM = South American Summer Monsoon.
CPD
3, 839–869, 2007 Surface exposure dating in Bolivia R. Zech et al. Title Page Abstract Introduction Conclusions References Tables Figures ◭ ◮ ◭ ◮ Back CloseFull Screen / Esc
Printer-friendly Version Interactive Discussion
EGU Fig. 2. Landsat image (RGB 742) showing the geomorphological and stratigraphical situation
in the Valle San Francisco. Sampling locations and exposure ages in ka (calculated according to Lifton et al., 2005, and a reference production rate of 5.87 atoms a−1g−1SiO
CPD
3, 839–869, 2007 Surface exposure dating in Bolivia R. Zech et al. Title Page Abstract Introduction Conclusions References Tables Figures ◭ ◮ ◭ ◮ Back CloseFull Screen / Esc
Printer-friendly Version Interactive Discussion
EGU Fig. 3. Same as Fig. 2 for the Valle de Rio Suturi. The arrows show the former ice-flow direction.
CPD
3, 839–869, 2007 Surface exposure dating in Bolivia R. Zech et al. Title Page Abstract Introduction Conclusions References Tables Figures ◭ ◮ ◭ ◮ Back CloseFull Screen / Esc
Printer-friendly Version Interactive Discussion
EGU Fig. 4. Same as Fig. 2 for the Huara Loma (here a Corona image was draped over the Landsat
CPD
3, 839–869, 2007 Surface exposure dating in Bolivia R. Zech et al. Title Page Abstract Introduction Conclusions References Tables Figures ◭ ◮ ◭ ◮ Back CloseFull Screen / Esc
Printer-friendly Version Interactive Discussion
EGU Fig. 5. Exposure ages from all three research areas arranged in stratigraphic order.
Calcula-tions according to Lifton et al. (2005) with a reference production rate of 5.87 atoms a−1 g−1 SiO2. Errors bars illustrate the 1σ AMS errors. The shaded red bar indicates the LGM glacial advances (22–25 ka), the blue bar the Late Glacial ones (11–13 ka).
CPD
3, 839–869, 2007 Surface exposure dating in Bolivia R. Zech et al. Title Page Abstract Introduction Conclusions References Tables Figures ◭ ◮ ◭ ◮ Back CloseFull Screen / Esc
Printer-friendly Version Interactive Discussion EGU 0 5 10 15 20 25 30 35 SF 4 3 SF 4 2 SF 4 1 SF 1 3 SF 3 3 SF 3 2 SF 1 2 SF 5 2 SF 5 3 SF 5 1 SF 2 1 SF 2 3 R M 4 1 R M 4 2 R M 2 2 R M 3 1 R M 3 3 R M 1 3 R M 1 4 R M 5 1 H H 5 1 H H 5 2 H H 1 1 H H 2 2 H H 4 1 H H 4 3 H H 3 2 H H 3 1 E x p o s u re A g e s [ k a ] Stone (PR 5.1) Lifton (PR 4.66) Lifton atm corr P&L (PR 5.41) Lifton (PR 5.87)
Fig. 6. Exposure ages calculated according to Lifton et al. (2005) with a reference production rate (PR) of 5.87, Pigati and Lifton (2004) PR 5.41, Stone (2000) PR 5.1, Lifton et al. (2005) including an estimated atmospheric correction, and Lifton et al. with a PR of 4.66 (Breque calibration site). Error bars: 10% for Lifton et al. (2005), PR 5.87.
CPD
3, 839–869, 2007 Surface exposure dating in Bolivia R. Zech et al. Title Page Abstract Introduction Conclusions References Tables Figures ◭ ◮ ◭ ◮ Back CloseFull Screen / Esc
Printer-friendly Version Interactive Discussion
EGU Fig. 7. Recalculated exposure ages (using Lifton et al., 2005, PR 5.87) from the Valle
Anta-cocha (Smith et al., 2005a, b; open diamonds: uncorrected; black diamonds: geomagnetically corrected) and the “Breque” moraine (Farber et al., 2005: black circles). The orange box illus-trates the14C age of the Breque moraine, a potential but controversial calibration site.