HAL Id: hal-00303031
https://hal.archives-ouvertes.fr/hal-00303031
Submitted on 6 Aug 2007HAL is a multi-disciplinary open access
archive for the deposit and dissemination of sci-entific research documents, whether they are pub-lished or not. The documents may come from teaching and research institutions in France or abroad, or from public or private research centers.
L’archive ouverte pluridisciplinaire HAL, est destinée au dépôt et à la diffusion de documents scientifiques de niveau recherche, publiés ou non, émanant des établissements d’enseignement et de recherche français ou étrangers, des laboratoires publics ou privés.
Weekly periodicities of aerosol optical thickness over
Central Europe ? evidence of an anthropogenic direct
aerosol effect
D. Bäumer, R. Rinke, B. Vogel
To cite this version:
D. Bäumer, R. Rinke, B. Vogel. Weekly periodicities of aerosol optical thickness over Central Europe ? evidence of an anthropogenic direct aerosol effect. Atmospheric Chemistry and Physics Discussions, European Geosciences Union, 2007, 7 (4), pp.11545-11560. �hal-00303031�
ACPD
7, 11545–11560, 2007Weekly periodicities of AOT over Central
Europe D. B ¨aumer et al. Title Page Abstract Introduction Conclusions References Tables Figures ◭ ◮ ◭ ◮ Back Close Full Screen / Esc
Printer-friendly Version Interactive Discussion
EGU
Atmos. Chem. Phys. Discuss., 7, 11545–11560, 2007 www.atmos-chem-phys-discuss.net/7/11545/2007/ © Author(s) 2007. This work is licensed
under a Creative Commons License.
Atmospheric Chemistry and Physics Discussions
Weekly periodicities of aerosol optical
thickness over Central Europe – evidence
of an anthropogenic direct aerosol effect
D. B ¨aumer, R. Rinke, and B. Vogel
Institut f ¨ur Meteorologie und Klimaforschung, Forschungszentrum Karlsruhe/Universit ¨at Karlsruhe, Karlsruhe, Germany
Received: 9 July 2007 – Accepted: 2 August 2007 – Published: 6 August 2007 Correspondence to: D. B ¨aumer (dominique.baeumer@imk.fzk.de)
ACPD
7, 11545–11560, 2007Weekly periodicities of AOT over Central
Europe D. B ¨aumer et al. Title Page Abstract Introduction Conclusions References Tables Figures ◭ ◮ ◭ ◮ Back Close Full Screen / Esc
Printer-friendly Version Interactive Discussion
EGU
Abstract
Statistical analyses of data from 14 ground-based sun photometer stations all over Central Europe are presented. All stations are part of the Aerosol Robotic Network (AERONET), and only data of the highest data quality level 2.0 had been applied. The averages by weekday of aerosol optical thickness (AOT) at a wavelength of 440 nm 5
of 12 of the 14 stations show a weekly periodicity with lowest values on Sunday and Monday, but greatest values from Wednesday until Saturday, that is significant at least on a 90% level. The stations in Germany and in Greater Paris show weekly cycles with ranges of about 20% on average. In Northern Italy and Switzerland this range is about 10% on average. The corresponding weekly cycle of anthropogenic gaseous and par-10
ticulate emissions leads us to the conclusion of the anthropogenic origin of the weekly AOT cycle. Since these AOT patterns are derived from the reduction of the direct sun radiation by the columnar atmospheric aerosol, this result represents strong evidence for an anthropogenic direct aerosol effect on shortwave radiation. Furthermore, this study makes a first contribution to the understanding and explanation of recently ob-15
served weekly periodicities in meteorological variables as temperature in Germany.
1 Introduction
Despite the progress that recently has been made in climate research, the role of an-thropogenic aerosol is still a key factor of uncertainty in understanding and quantifying the present and future global climate change (IPCC, 2007). Although the knowledge 20
about the direct aerosol effect is better than the one about the indirect aerosol effect, solely the range of uncertainty of the anthropogenic direct effect is of the order of half the size of the total anthropogenic radiative forcing according to that report. The range of uncertainty of the anthropogenic indirect effect is even quantified as of the same order as the total anthropogenic radiative forcing, to some extent a consequence of its 25
ACPD
7, 11545–11560, 2007Weekly periodicities of AOT over Central
Europe D. B ¨aumer et al. Title Page Abstract Introduction Conclusions References Tables Figures ◭ ◮ ◭ ◮ Back Close Full Screen / Esc
Printer-friendly Version Interactive Discussion
EGU
to improve our knowledge about the atmospheric aerosol, its interactions, and its better representation in meteorological models are needed.
In the recent years, a series of studies reported weekly periodicities in various mete-orological variables. Gordon (1994) found a significant but very small weekly tempera-ture cycle for the northern hemisphere for the period 1979–1992. Simmonds and Keay 5
(1997) published local weekly cycles in temperature and precipitation in Melbourne, Australia, for the years 1960–1994. Cerveny and Balling (1998) showed weekly peri-odicities of precipitation and tropical cyclone maximum wind speed over the North-West Atlantic region, and also the difference of day and night wind speed in tropical cyclones had a weekly periodicity (Cerveny and Balling, 2005). Forster and Solomon (2003) 10
found a weekend effect in the daily temperature range in different regions of the world, and especially large scale patterns of areas with a positive or a negative weekend effect over the USA. Gong et al. (2006) reported increasing weekly cycles in various meteoro-logical parameters including temperature and precipitation in most parts of China that depend on the season. B ¨aumer and Vogel (2007) found weekly periodicities in various 15
meteorological parameters including temperature and precipitation in Germany in the period 1991–2005, and the temperature cycle with maxima on Wednesday and minima on Saturday also occurred at remote sites as on high mountains.
In some of these studies, the anthropogenic fraction of the atmospheric aerosol was made responsible for the weekly periodicities, but this hypothesis has not been proven 20
yet in a satisfying way. In fact, there are weekly periodicities of near-surface aerosol properties at different locations as shown by e.g. Delene and Ogren (2002) and Shut-ters and Balling (2006). Differences of the visibility and the PM10 concentration be-tween weekdays and weekends in Taiwan were published by Tsai (2005). With respect to column properties, Jin et al. (2005) reported a weekly cycle of aerosol optical thick-25
ness in New York, but only in summer and under further additional conditions that sig-nificantly reduced the size of the used data set. But still the question remains whether there is a weekly cycle of aerosol with a considerable vertical extent on larger horizon-tal scales than the urban scale. In the case of the trace gas NO2 this could be shown
ACPD
7, 11545–11560, 2007Weekly periodicities of AOT over Central
Europe D. B ¨aumer et al. Title Page Abstract Introduction Conclusions References Tables Figures ◭ ◮ ◭ ◮ Back Close Full Screen / Esc
Printer-friendly Version Interactive Discussion
EGU
by Beirle et al. (2003). They analyzed satellite data and demonstrated weekly cycles of tropospheric columnar NO2 over many industrialized regions in the world including Germany.
In this paper, we investigate if there is a weekly periodicity in the columnar aerosol content over Central Europe. Therefore, we analyze time series of AERONET sun 5
photometer aerosol optical thickness (AOT).
2 Data
Aerosol Robotic Network (AERONET) is a federated international network of sun and sky radiometers that exists since 1993. There are more than 300 automatically op-erating instruments worldwide (Holben et al., 1998, 2001) that have been used for a 10
large number of applications. For instance, Eck et al. (1999) investigated the optical properties of biomass burning aerosol. Smirnov et al. (2002) found a diurnal variability of aerosol optical thickness at urban and industrial sites. Most of the stations showed an increase of the AOT by about 10% to 20% in the course of the day, predominantly as a response to anthropogenic emissions.
15
In this study, we have been testing the data sets measured at 14 AERONET sun photometer stations all over Central Europe for a weekly periodicity. We solely used data of the best data quality level 2.0 provided as daily averages. These data are cloud-screened and quality-assured. This comprises several checks by AERONET as e.g. pre- and post-field calibration, instrument performance check, data consistency 20
checks, and AOT spectral dependency check. Since the sun photometer carries out di-rect sun radiation measurements, there are no data available from completely overcast days. The list of applied stations, their coordinates, the respective according measure-ment period, and the number of measuremeasure-ment days is given in Table 1. Not all the sta-tions measure AOT at a wavelength of 500 nm but at 440 nm. Hence we have chosen to 25
solely show results for AOT at 440 nm, but where available, the AOTs at 500 nm show the same pattern. The stations are situated in France, Belgium, Germany, Switzerland,
ACPD
7, 11545–11560, 2007Weekly periodicities of AOT over Central
Europe D. B ¨aumer et al. Title Page Abstract Introduction Conclusions References Tables Figures ◭ ◮ ◭ ◮ Back Close Full Screen / Esc
Printer-friendly Version Interactive Discussion
EGU
and Italy. Figure 1 shows a map including the positions of the stations.
3 Results
In Table 2, an overview of the statistics for all the applied AERONET stations is given. Average AOT440 absolute values vary from about 0.2 at Laegeren in Switzerland to 0.39 in Venice, Italy. The minimum between Saturday and Tuesday and the maximum 5
between Wednesday and Saturday of the average weekday AOT440 could be proven as significantly different for 12 of the 14 stations at least on a 90% level by applying a t-test for these two weekdays.
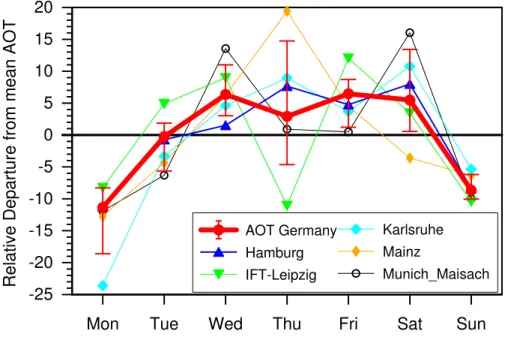
Figure 2 shows the mean relative weekly variability of AOT at 440 nm for the 5 Ger-man AERONET stations and their average AOT at 440 nm that is computed as the 10
relative percent departure from the mean value. Despite some variation from day to day and station to station, all stations have above average AOT values in the second half of the working week, usually from Wednesday to Friday or Saturday, and minimum values on Sunday and Monday. The average over all 5 German stations also shows this cycle with a range of almost 20%. This average has been weighted with the number 15
of measurement days of the single stations. The error bars denote the corresponding 95% confidence level. Additionally, we carried out two-tailed t-tests for the data of each station and compared minimum AOT on Monday with maximum AOT that occurred on Thursday, Friday or Saturday. We found the difference to be significant on the 95% level (α<0.05) for the stations IFT Leipzig, Mainz and Munich-Maisach, and significant 20
on the 90% level (α<0.10) for Karlsruhe and Hamburg.
Figure 3 illustrates the mean relative weekly variability of AOT at 440 nm for the 3 AERONET stations situated in Greater Paris and their average as the relative percent departure from the mean value. Again, there is a clear weekly periodicity with a max-imum AOT at the end of the working week that is greater than the minmax-imum by about 25
20% which occurs on Sunday and Monday. The t-test for data of Monday and Friday resulted in a significant difference on the 95% level for the stations Fontainebleau and
ACPD
7, 11545–11560, 2007Weekly periodicities of AOT over Central
Europe D. B ¨aumer et al. Title Page Abstract Introduction Conclusions References Tables Figures ◭ ◮ ◭ ◮ Back Close Full Screen / Esc
Printer-friendly Version Interactive Discussion
EGU
Palaiseau, and a significant difference on the 90% level for Paris. In contrast to Ger-many, the decrease takes place already on Saturday, whereas the AOT over Germany is constantly high on Saturday. This is probably a consequence of less up-stream sources close to Paris in respect to prevailing westerly winds in comparison to the con-ditions in Germany, which leads to an advection of relatively clean air within a shorter 5
time period.
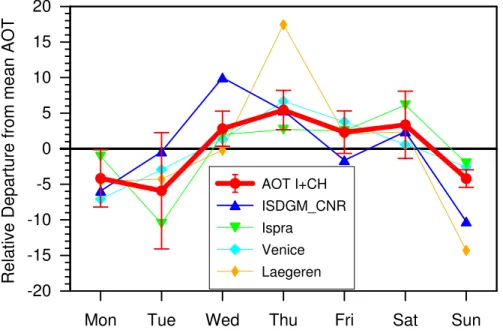
Figure 4 shows the mean relative weekly variability of AOT at 440 nm for 4 AERONET stations situated in Northern Italy and Switzerland and their average AOT at 440 nm, again as relative percent departure from the mean value. There is also a clear weekly cycle visible, although the difference between minimum and maximum is about 10% 10
and, consequently, lower than in Germany or Greater Paris. The t-test for the data of single stations carried out as comparison of the day with the minimum AOT in the period Sunday to Tuesday, and of the day with the maximum AOT in the period Wednesday to Saturday. For each of these four stations this resulted in a significant difference on the 95% level.
15
Data of the stations Oostende at the Belgian North Sea coast and Carpentras in Southern France do not display a significant weekly cycle, but a weak minimum on Sunday (Table 2). At both stations, the maximum occurred on Wednesday. The t-test resulted in α>0.10 for the comparison of data of Wednesday and Sunday, i.e. there is no significant difference between weekdays on the 90% level.
20
4 Conclusions
Many stations as all the German stations, the stations in or close to Paris, France, or the stations in or close to Venice, Italy, show significant weekly periodicities of the aerosol optical thickness. Low AOT values on Sunday and Monday are in contrast to relatively high AOT values from Wednesday to Friday or Saturday. To our knowledge, 25
this is the first time that ground-based measurements with high accuracy demonstrate these weekly AOT cycles with a considerable horizontal extent. In comparison to the
ACPD
7, 11545–11560, 2007Weekly periodicities of AOT over Central
Europe D. B ¨aumer et al. Title Page Abstract Introduction Conclusions References Tables Figures ◭ ◮ ◭ ◮ Back Close Full Screen / Esc
Printer-friendly Version Interactive Discussion
EGU
characteristic ranges of the diurnal AOT variability shown by Smirnov et al. (2002), the weekly variability is at least of the same order as the mean daily variability at various urban or industrial sites.
In our opinion, these weekly periodicities are a result of human activity that leads to a characteristic weekly emission cycle. In Fig. 5, typical relative weekly emission 5
cycles of gaseous and particulate substances for South-Western Germany and adja-cent areas are shown that consist of nearly constant emissions from Monday to Friday and distinctly lower emissions on Saturday and Sunday (T. Pregger, Institut f ¨ur En-ergiewirtschaft und Rationelle Energieanwendung (IER), University Stuttgart, personal communication, 2006). The applied emission model is based on work carried out in the 10
EUROTRAC subproject GENEMIS (Friedrich and Reis, 2004). Emissions on working days are on average 40% to 60% higher than emissions on Sunday. A very similar weekly emission cycle for NOx for Germany can be found in Beirle et al. (2003). This means that there is a phase shift of about one day at the end of the week between the emission cycle and the AOT cycle, especially in Germany and Northern Italy. A 15
possible explanation for that is that not all the aerosol particles are directly emitted, but are formed in the atmosphere from gaseous precursors. Similarly, it takes until Wednesday to reach the maximum level of AOT in Germany. Thus, there is a period from Wednesday to Saturday with a relatively strong anthropogenic direct aerosol ef-fect, and a weaker one during the rest of the time. In Germany, a widespread weekly 20
temperature periodicity with relative maxima on Wednesday and relative minima on Saturday has been observed recently (B ¨aumer and Vogel, 2007). Hence we follow that the relatively strong anthropogenic direct aerosol effect indicated by relatively high AOT may contribute to the observed weekly temperature periodicity.
Acknowledgements. We thank the station PIs P. Goloub, C. Francois, J. B ¨osenberg, A.
Ans-25
mann, L. Alberotanza, G. Zibordi, S. Wunderle, M. Andreae, P. K ¨opke, K. Ruddick, and J. Pelon, and their staff for their effort in establishing and maintaining the AERONET sites listed in Ta-ble 1 of this study. We also thank the AERONET staff for their commitment, and J. Brombach for his assistance in the processing of the data. Furthermore, we thank T. Pregger from IER at University Stuttgart for providing the emission data.
ACPD
7, 11545–11560, 2007Weekly periodicities of AOT over Central
Europe D. B ¨aumer et al. Title Page Abstract Introduction Conclusions References Tables Figures ◭ ◮ ◭ ◮ Back Close Full Screen / Esc
Printer-friendly Version Interactive Discussion
EGU
References
B ¨aumer, D. and Vogel, B.: An unexpected pattern of distinct weekly periodicities in climato-logical variables in Germany, Geophys. Res. Lett., 34, L03819, doi:10.1029/2006GL028559, 2007.
Beirle, S., Platt, U., Wenig, M., and Wagner, T.: Weekly cycle of NO2 by GOME measurements:
5
a signature of anthropogenic sources, Atmos. Chem. Phys., 3, 2225–2232, 2003,
http://www.atmos-chem-phys.net/3/2225/2003/.
Cerveny, R. S. and Balling Jr., R. C.: Weekly cycles of air pollutants, precipitation and tropical cyclones in the coastal NW Atlantic region, Nature, 394, 561–563, 1998.
Cerveny, R. S. and Balling Jr., R. C.: Variations in the diurnal character of tropical cyclone wind
10
speed, Geophys. Res. Lett., 32, L06706, doi:10.1029/2004GL021177, 2005.
Delene, D. J. and Ogren, J. A.: Variability of Aerosol Optical Properties at Four North American Surface Monitoring Sites, J. Atmos. Sci., 59, 1135–1150, 2002.
Eck, T. F., Holben, B. N., Reid, J. S., Dubovik, O., Smirnov, A., O’Neill, N. T., Slutsker, I., and Kinne, S.: Wavelength dependence of the optical depth of biomass burning, urban, and
15
desert dust aerosol, J. Geophys. Res., 104, 31 333–31 350, 1999.
Forster, P. M. de F. and Solomon, S.: Observations of a “weekend effect” in diurnal temperature range, Proc. Natl. Acad. Sci. USA, 100, 11 225–11 230, 2003.
Friedrich, R. and Reis, S. (Eds.): Emissions of Air Pollutants – Measurements, Calculation, Uncertainties – Results from the EUROTRAC Subproject GENEMIS, Springer Publishers,
20
pp.279–332, 2004.
Gong, D.-Y., Guo, D., and Ho, C.-H.: Weekend effect in diurnal temperature range in China: Opposite signals between winter and summer, J. Geophys. Res., 111, D18113, doi:10.1029/2006JD007068, 2006.
Gordon, A. H.: Weekdays warmer than weekends? Nature, 367, 325–326, 1994.
25
IPCC: Climate Change 2007 – The Physical Science Basis. Contribution of Working Group I to the Fourth Assessment Report of the Intergovernmental Panel on Climate Change [edited by: Solomon, S., Qin, D., Manning, M., Chen, Z., Marquis, M., Averyt, K. B., Tignor, M., and Miller, H. L. ], Cambridge University Press, Cambridge, United Kingdom and New York, NY, USA, 2007.
30
Holben, B. N., Eck, T. F., Slutsker, I., Tanre, D., Buis, J. P., Setzer, A., Vermote, E., Reagan, J. A., Kaufman, Y. J., Nakajima, T., Lavenu, F., Jankowiak, I., and Smirnov, A.: AERONET
ACPD
7, 11545–11560, 2007Weekly periodicities of AOT over Central
Europe D. B ¨aumer et al. Title Page Abstract Introduction Conclusions References Tables Figures ◭ ◮ ◭ ◮ Back Close Full Screen / Esc
Printer-friendly Version Interactive Discussion
EGU
– A federated instrument network and data archive for aerosol characterization, Rem. Sens. Environ., 66, 1–16, 1998.
Holben, B. N., Tanre, D., Smirnov, A., Eck, T. F., Slutsker, I., Abuhassan, N., Newcomb, W. W., Schafer, J., Chatenet, B., Lavenue, F., Kaufman, Y. J., Vande Castle, J., Setzer, A., Markham, B., Clark, D., Frouin, R., Halthore, R., Karnieli, A., O’Neill, N. T., Pietras, C., Pinker, R. T.,
5
Voss, K., and Zibordi, G.: An emerging ground-based aerosol climatology: Aerosol Optical Depth from AERONET, J. Geophys. Res., 106, 12 067–12 097, 2001.
Jin, M., Shepherd, J. M., and King, M. D.: Urban aerosols and their variations with clouds and rainfall: A case study for New York and Houston, J. Geophys. Res., 110, D10S20, doi:10.1029/2004JD005081, 2005.
10
Lohmann, U. and Feichter, J.: Global indirect aerosol effects: a review, Atmos. Chem. Phys., 5, 715–737, 2005,
http://www.atmos-chem-phys.net/5/715/2005/.
Simmonds, I. and Keay, K.: Weekly cycle of meteorological variations in Melbourne and the role of pollution and anthropogenic heat release, Atmos. Environ., 31, 1589–1603, 1997.
15
Smirnov, A., Holben, B. N., Eck, T. F., Slutsker, I., Chatenet, B., and Pinker, R. T.: Diurnal variability of aerosol optical depth observed at AERONET (Aerosol Robotic Network) sites, Geophys. Res. Lett., 29(23), 2115, doi:10.1029/2002GL016305, 2002.
Tsai, Y. I.: Atmospheric visibility trends in an urban area in Taiwan 1961-2003, Atmos. Environ., 39, 5555–5567, 2005.
ACPD
7, 11545–11560, 2007Weekly periodicities of AOT over Central
Europe D. B ¨aumer et al. Title Page Abstract Introduction Conclusions References Tables Figures ◭ ◮ ◭ ◮ Back Close Full Screen / Esc
Printer-friendly Version Interactive Discussion
EGU
Table 1. List of AERONET sun photometer stations and available data used in this study (in alphabetical order).
AERONET Station Coordinates Measurement Period Number of Days with Measurements Carpentras 44.08 N 5.06 E 18.02.2003–13.04.2006 722 Fontainebleau 48.41 N 2.68 E 25.03.2002–30.11.2004 427 Hamburg 53.57 N 9.97 E 15.06.2000–25.10.2006 614 IFT-Leipzig 51.35 N 12.44 E 20.05.2001–14.03.2006 644 ISDGM CNR 45.44 N 12.33 E 12.03.2002–08.11.2004 659 Ispra 45.80 N 8.63 E 28.06.1997–24.04.2006 1910 Karlsruhe 49.09 N 8.43 E 23.03.2005–31.10.2005 133 Laegeren 47.48 N 8.35 E 13.08.2003–05.07.2005 275 Mainz 50.00 N 8.30 E 05.11.2003–05.07.2006 360 Munich Maisach 48.21 N 11.26 E 13.03.2002–09.06.2004 210 Oostende 51.23 N 2.93 E 05.09.2001–04.10.2003 296 Palaiseau 48.70 N 2.21 E 24.07.1999–03.10.2005 701 Paris 48.87 N 2.33 E 18.07.2000–24.11.2005 182 Venice 45.31 N 12.51 E 16.06.1999–01.04.2006 1586
ACPD
7, 11545–11560, 2007Weekly periodicities of AOT over Central
Europe D. B ¨aumer et al. Title Page Abstract Introduction Conclusions References Tables Figures ◭ ◮ ◭ ◮ Back Close Full Screen / Esc
Printer-friendly Version Interactive Discussion
EGU
Table 2. Average AOT440 (and AOT500 where available), standard deviation of AOT440, 95% confidence interval of average AOT440, average AOT440 weekday 95% confidence interval, and minimum (Saturday until Tuesday)/maximum (Wednesday until Saturday) average week-day AOT440 and corresponding weekweek-day with result of t-test for these two weekweek-days of the AERONET sun photometer station data. Note that some of the stations do not measure AOT at a wavelength of 500 nm.
AERONET Station Average
AOT440 (AOT500) St. Dev. (440) CI 95% (440) Average week-day CI 95% (440)
Min/Max AOT440 and cor-responding weekday, signifi-cant (95%, 90%, no)
Carpentras 0.217
(0.174)
0.136 ±0.009 ±0.026 0.205 Sun/0.230 Wed (no)
Fontainebleau 0.279 (0.243) 0.173 ±0.016 ±0.042 0.236 Sat/0.331 Fri (90%) Hamburg 0.233 (0.193) 0.175 ±0.014 ±0.036 0.207 Mon/0.251 Sat (90%) IFT-Leipzig 0.281 (0.238) 0.186 ±0.014 ±0.037 0.252 Sun/0.315 Fri (95%) ISDGM CNR 0.390 (0.335) 0.260 ±0.020 ±0.053 0.350 Sun/0.429 Wed (95%) Ispra 0.388 (0.317) 0.326 ±0.015 ±0.039 0.347 Tue/0.411 Sat (95%) Karlsruhe 0.297 (0.251) 0.170 ±0.029 ±0.074 0.226 Mon/0.328 Sat (90%) Laegeren 0.199 (0.166) 0.118 ±0.014 ±0.036 0.171 Sun/0.234 Thu (95%) Mainz 0.262 (0.223) 0.156 ±0.016 ±0.042 0.230 Mon/0.311 Thu (95%)
Munich Maisach 0.288 (–) 0.140 ±0.019 ±0.049 0.253 Mon/0.334 Sat (95%)
Oostende 0.281
(0.245)
0.214 ±0.024 ±0.064 0.254 Sun/0.323 Wed (no)
Palaiseau 0.248 (–) 0.158 ±0.012 ±0.030 0.217 Sun/0.276 Fri (95%)
Paris 0.265 (–) 0.164 ±0.024 ±0.061 0.222 Mon/0.289 Fri (90%)
Venice 0.338
(0.289)
ACPD
7, 11545–11560, 2007Weekly periodicities of AOT over Central
Europe D. B ¨aumer et al. Title Page Abstract Introduction Conclusions References Tables Figures ◭ ◮ ◭ ◮ Back Close Full Screen / Esc
Printer-friendly Version Interactive Discussion
EGU
ACPD
7, 11545–11560, 2007Weekly periodicities of AOT over Central
Europe D. B ¨aumer et al. Title Page Abstract Introduction Conclusions References Tables Figures ◭ ◮ ◭ ◮ Back Close Full Screen / Esc
Printer-friendly Version Interactive Discussion EGU -25 -20 -15 -10 -5 0 5 10 15 20 R e la ti ve D e p a rt u re fr o m m e a n A O T
Mon Tue Wed Thu Fri Sat Sun
AOT Germany Hamburg IFT-Leipzig Karlsruhe Mainz Munich_Maisach
Fig. 2. Mean relative weekly variability of AOT at a wavelength of 440 nm for the 5 German AERONET stations and their average AOT at 440 nm computed as relative percent departure from mean value.
ACPD
7, 11545–11560, 2007Weekly periodicities of AOT over Central
Europe D. B ¨aumer et al. Title Page Abstract Introduction Conclusions References Tables Figures ◭ ◮ ◭ ◮ Back Close Full Screen / Esc
Printer-friendly Version Interactive Discussion EGU -30 -20 -10 0 10 20 30 R e la ti ve D e p a rt u re fr o m m e a n A O T
Mon Tue Wed Thu Fri Sat Sun
AOT Gr. Paris Fontainebleau
Palaiseau Paris
Fig. 3. Same as Fig. 2, but for the 3 AERONET stations situated in Greater Paris and their average.
ACPD
7, 11545–11560, 2007Weekly periodicities of AOT over Central
Europe D. B ¨aumer et al. Title Page Abstract Introduction Conclusions References Tables Figures ◭ ◮ ◭ ◮ Back Close Full Screen / Esc
Printer-friendly Version Interactive Discussion EGU -20 -15 -10 -5 0 5 10 15 20 R e la ti ve D e p a rt u re fr o m m e a n A O T
Mon Tue Wed Thu Fri Sat Sun
AOT I+CH ISDGM_CNR Ispra
Venice Laegeren
Fig. 4. Same as Fig. 2, but for 4 AERONET stations situated in Northern Italy and Switzerland. Note: The station “ISDGM CNR” is situated in the city of Venice.
ACPD
7, 11545–11560, 2007Weekly periodicities of AOT over Central
Europe D. B ¨aumer et al. Title Page Abstract Introduction Conclusions References Tables Figures ◭ ◮ ◭ ◮ Back Close Full Screen / Esc
Printer-friendly Version Interactive Discussion EGU 0.9 1.0 1.1 1.2 1.3 1.4 1.5 1.6 1.7 E m issi o n s re la ti ve to S u n d a y
Mon Tue Wed Thu Fri Sat Sun
SO2
NOX
PM10 EC
Fig. 5. Emissions of different gaseous and particulate substances by day of the week relative to Sunday for the domain 46◦N 6◦E to 51◦N 10◦E (South-Western Germany and adjacent areas) for June 2000.