HAL Id: hal-02989700
https://hal.archives-ouvertes.fr/hal-02989700
Submitted on 12 Nov 2020
HAL is a multi-disciplinary open access
archive for the deposit and dissemination of sci-entific research documents, whether they are pub-lished or not. The documents may come from teaching and research institutions in France or abroad, or from public or private research centers.
L’archive ouverte pluridisciplinaire HAL, est destinée au dépôt et à la diffusion de documents scientifiques de niveau recherche, publiés ou non, émanant des établissements d’enseignement et de recherche français ou étrangers, des laboratoires publics ou privés.
The oxidation state of iron in Mid-Ocean Ridge basalt
glasses by Raman spectroscopy
Charles Le Losq, Andrew Berry, Mark Kendrick, Daniel Neuville, Hugh
O'neill
To cite this version:
Charles Le Losq, Andrew Berry, Mark Kendrick, Daniel Neuville, Hugh O'neill. The oxidation state of iron in Mid-Ocean Ridge basalt glasses by Raman spectroscopy. American Mineralogist, Min-eralogical Society of America, 2019, 104 (7), pp.1032-1042. �10.2138/am-2019-6887�. �hal-02989700�
The oxidation state of iron in Mid-Ocean Ridge basalt glasses determined by Raman 1
spectroscopy 2
3
Charles Le Losq1, Andrew J. Berry1, Mark A. Kendrick1, Daniel R. Neuville2, Hugh St. C. 4
O’Neill1
5 6
1
Research School of Earth Sciences, Australian National University, Canberra, ACT 2601, 7
Australia. 8
2
Géomatériaux, Institut de Physique du Globe de Paris, CNRS, USPC, Paris 75005, France. 9
10
Abstract 11
12
Synthetic Mid-Ocean Ridge Basalt (MORB) glasses, for which Fe3+/FeTOT had been 13
determined previously by Mössbauer spectroscopy and found to vary from 0 to 1, were used 14
to test methods for determining Fe3+/FeTOT by Raman spectroscopy. Six numerical data 15
reduction methods were tested, based on conventional approaches and supervised and 16
unsupervised machine learning algorithms. For the set of glass standards, with fixed 17
composition, the precision of all methods is ≤ ± 0.04. This suggests that Raman spectroscopy 18
may be a readily available method for determining the oxidation state of Fe in natural 19
volcanic glasses with good precision and high spatial resolution. Raman spectra were 20
recorded for 42 natural MORB glasses from a wide range of locations. There is a strong 21
correlation between the Raman spectra and composition, despite relatively limited variability, 22
such that the methods calibrated using the glass standards are not directly applicable to the 23
natural samples. This compositional effect can be corrected by using a compositional term 24
when linking spectral variations to the glass Fe3+/FeTOT. The resulting Fe3+/FeTOT value 25
determined by Raman spectroscopy was of 0.090 ± 0.067 (n=42). This value agrees with the 26
latest Fe K-edge XANES and wet-chemistry estimates of 0.10 ± 0.02. The larger uncertainty 27
of the Raman determination reflects the sensitivity of Raman spectroscopy to small changes 28
in glass composition and hence structure. This sensitivity allows Raman spectroscopy to be 29
used to determine the major element composition of natural MORB glasses within 1 mol% 30
through the use of a neural network. This suggests that Raman spectrometers may be used to 31
determine the composition of samples in situ at difficult to access locations that are 32
incompatible with X-ray spectrometry (e.g. Mid-Ocean Ridges or Mars). 33
1. Introduction 35
36
Mid-Ocean Ridge Basalts (MORB), derived from partial melting of the upper mantle, are of 37
critical importance for understanding the geochemistry of the mantle and the formation of the 38
oceanic crust (e.g. Langmuir et al., 1992; Asimow et al., 2004; Gale et al., 2013; O’Neill et 39
al., 2018). MORB glasses, formed by rapid cooling at the rim of pillow lavas enable the 40
composition (Jenner and O’Neill, 2012; O’Neill and Jenner, 2012), including volatile content 41
(Kendrick et al., 2013), and oxidation state (Christie et al., 1986; Bézos and Humler, 2005; 42
Cottrell and Kelley, 2011, 2013; Berry et al., 2018; Zhang et al., 2018) of the melts to be 43
determined. This, in turn, allows the intensive and extensive thermodynamic conditions of the 44
mantle source to be calculated (e.g. Asimow et al., 2004). In particular, the iron oxidation 45
state of Fe in MORB, expressed as Fe3+/FeTOT with FeTOT = Fe2+ + Fe3+, is important because 46
it affects estimations of temperature, mineral assemblages, and the speciation of volatile 47
elements, at both the surface and magmatic source. 48
49
The latest average Fe3+/FeTOT values of natural MORB glasses from global sources have been 50
determined to be 0.10 ± 0.02 (Berry et al., 2018) or 0.14 ± 0.01 (Zhang et al., 2018) by Fe K-51
edge XANES spectroscopy, and 0.11 ± 0.02 by wet-chemistry (corrected for plagioclase 52
phenocrysts, Bézos and Humler, 2005). Wet chemistry is a destructive method that lacks 53
spatial resolution and is unsuitable for inhomogeneous glasses or small samples such as melt 54
inclusions (e.g. see Bézos and Humler, 2005). Fe K-edge XANES spectroscopy has excellent 55
precision and micron spatial resolution in two dimensions, but requires standards that are 56
compositionally matched and for which Fe3+/FeTOT is determined by another technique, such 57
as 57Fe Mössbauer spectroscopy (e.g. Berry et al., 2008). There are also questions concerning 58
possible photo-oxidation during analysis of hydrous glasses (e.g. Cottrell et al., in press). A 59
considerable drawback is that it also requires access to a synchrotron light source. 60
61
Raman spectroscopy is an alternative technique for determining Fe3+/FeTOT that is easily 62
accessible for most investigators, is non-destructive, has micron-scale spatial resolution, 63
requires minimal sample preparation, is easy to perform, and spectra can be acquired within 64
minutes. Previous studies have shown how Raman spectroscopy can be used for quantifying 65
the concentration of H2O (Thomas, 2000; Zajacz et al., 2005; Behrens et al., 2006; Thomas et
66
al., 2008; Mercier et al., 2009, 2010; Le Losq et al., 2012) and CO2 (Morizet et al., 2013) in
67
glasses, with applications to pumices and melt inclusions (Shea et al., 2014; Métrich et al., 68
2016). The potential of Raman spectroscopy to determine Fe3+/FeTOT in glasses has been 69
demonstrated previously using various data treatment protocols (Magnien et al., 2004, 2006, 70
2008; Roskosz et al., 2008; Di Muro et al., 2009; Di Genova et al., 2016). The simplest 71
method requires correlating changes in Fe3+/FeTOT with changes in the intensity of the Raman 72
spectra at given Raman shift (Magnien et al., 2006; Roskosz et al., 2008). A more complex 73
method involves peak fitting the Raman signals assigned to stretching of tetrahedral SiO4 and
74
AlO4 units in order to extract the Fe3+-O signal, which can be related to Fe3+/FeTOT (Di Muro
75
et al., 2009; Welsch et al., 2017). Recently, Di Genova et al. (2016) proposed another 76
approach based on interpolation between two endmember spectra (e.g., one from a glass with 77
oxidized iron and one from a glass with the same composition but reduced iron). Those 78
different studies focused on demonstrating the ability of Raman spectroscopy to quantify 79
Fe3+/FeTOT in glasses of known composition. To date, no systematic use of Raman 80
spectroscopy has been attempted to tackle a problem such as the quantification of Fe3+/FeTOT 81
in MORB glasses. 82
83
The existing methods for quantifying Fe3+/FeTOT of glasses from Raman spectra rely on either 84
simple treatments (e.g. the intensity of one or several peaks, mixing end-member spectra) or 85
peak fitting. To our knowledge, machine learning algorithms, which remove subjectivity in 86
the data reduction protocol, have not been used for determining Fe3+/FeTOT of glasses. Here 87
we compare existing data reduction methods (conventional methods), based on spectral 88
intensity variations and mixing of spectra, with new supervised and unsupervised machine 89
learning approaches. We avoided the peak fitting procedure (e.g. Di Muro et al., 2009) 90
because it is complex to perform and equivocal of interpretation (Welsch et al., 2017), and 91
thus may not be suited to a routine protocol. Conventional methods and supervised machine 92
learning require the Fe3+/FeTOT values of the glass standards to be known. Unsupervised 93
machine learning methods, however, do not require prior knowledge of Fe3+/FeTOT of the 94
standards, such that they offer an independent way of determining Fe3+/FeTOT for comparison 95
with the results of other techniques. Those methods were assessed for a set of 13 synthetic 96
glasses with a typical but simplified MORB composition and known Fe3+/FeTOT (Berry et al., 97
2018). Following the proof of concept, the methods were used to determine Fe3+/FeTOT of a 98
representative set of 42 natural MORB glasses from the Atlantic, Indian and Pacific oceans, 99
with known major and trace elements compositions (Melson et al., 2002; Jenner and O’Neill, 100
2012; Kendrick et al., 2013) and Fe K-edge XANES Fe3+/FeTOT values (Berry et al., 2018). 101
103
2. Material and Methods 104
105
2.1 Starting Glasses
106 107
The MORB standards were prepared from mixtures of reagent grade SiO2 (52.0 wt%), Al2O3
108
(16.1 wt%), CaCO3 = CaO (12.4 wt%), Fe2O3 = FeO (10.0 wt%), MgO (8.2 wt%) and TiO2
109
(1.3 wt%) that were equilibrated at 1400 ˚C and values of log fO2 between 0 and -11 (-4.7
110
and 6.3 in log units relative to the quartz-fayalite-magnetite, QFM, buffer) for ~ 24 h before 111
quenching in water. A sample was also prepared at logfO2 = 4.8 (QFM + 11.2) using a
piston-112
cylinder apparatus. The Fe3+/FeTOT ratio of each glass was determined by Mössbauer 113
spectroscopy, and found to vary from ~ 0 to 1 (Table 1). For further details see Berry et al. 114
(2018). 115
116
Samples of natural MORB glass were obtained from the Department of Mineral Sciences, 117
Smithsonian Institution, as polished chips mounted in epoxy resin and are listed by MNNH 118
catalogue numbers in Supplementary Table 1. The sample details and major element 119
composition are given in Melson et al. (2002), their trace element composition in Jenner and 120
O’Neill (2012), and their Fe3+
/FeTOT values determined by Fe K-edge XANES spectroscopy 121
in Berry et al. (2018). From the set analysed by Berry et al. (2018), the Raman spectra of five 122
glasses (NMNH No. 111235-85, 115083-41, 113828-5, 111241-1, 111237-67) were 123
contaminated by contributions from crystals (see supplementary code) and were not 124
considered during the data reduction. Five samples previously studied by Kendrick et al. 125
(2013) from Juan de Fuca (Alv 2262-8 and Alv 2269-2), the East Pacific Rise Clipperton (CL 126
DR01) and Mid-Atlantic Ridge MAPCO (CH98 DR08 and CH98 DR11) were also analysed. 127
128
2.2 Raman Spectra Acquisition
129 130
Raman spectra of glasses were recorded using a Renishaw InVia spectrometer, equipped with 131
a Peltier-cooled detector, a 2400 l/mm grating and a confocal system. Samples were excited 132
using a 532 nm laser line focused ~ 3 m below the surface using a x100 Leica objective. 133
The laser power on the sample was ~ 1.2 mW. The spatial resolution was < 1 m, and the 134
spectral resolution ~ 1.2 cm-1. Five spectra were recorded from different points for each 135
sample. They are treated separately during the data reduction process. The acquisition time 136
varied between 120 and 180 s. For water-bearing natural MORB samples, oxidation of Fe by 137
the laser has been reported at high laser power (Di Genova et al., 2017). The combination of 138
a laser power less than 5 mW (Di Genova et al., 2017) with a relatively short counting time 139
of 120 s, and the analysis of five different spots, was used to prevent Fe oxidation during 140
spectral acquisition. We checked this by recording Raman maps for six samples, by acquiring 141
120 spectra with an acquisition time of 1 s over an area of 10 m by 12 m. During the 142
acquisition of these maps, the sample was continuously moved, such that the beam spent less 143
than 1 s at a given location. The individual spectra were noisy, but their average produced a 144
spectrum with a signal to noise ratio similar to that of a spectrum acquired in 120 s at a single 145
point. No difference was observed between spectra obtained in these two ways, indicating 146
that no variation of Fe3+/FeTOT was induced the during acquisition. 147
148
2.3 Data pre-processing
149 150
The spectra (Fig. 1) were pre-processed in Python using the Rampy library (Le Losq, 2018). 151
The data were corrected for temperature and excitation line effects following Galeener and 152
Sen (1978). We focus the data reduction methods on the 800-1300 cm-1 region of the spectra, 153
which contains signals from Si-O, Al-O and Fe3+-O stretching in the glass structure (Brawer 154
and White, 1975, 1977; Virgo et al., 1980; Mysen et al., 1982; Virgo et al., 1982). This 155
region also avoided signals due to nanolites (< 800 cm-1), which were observed in the spectra 156
of some of the natural glasses (see supplementary materials). We chose to fit a linear baseline 157
to subtract the background (Fig. 2A), with the aim of having only Si-O, Al-O and Fe3+-O 158
stretching signals in the background-corrected spectra that will be used for Fe3+/FeTOT 159
determination. The low and high frequency anchors of the linear baseline were determined 160
using a grid-search algorithm as those resulting in the lowest root mean square error (RMSE) 161
between the Mössbauer Fe3+/FeTOT values and those predicted by the intensity and mixing 162
methods described in sections 2.4.1 and 2.4.2. This resulted in the subtraction of a linear 163
baseline interpolated between the intensities at 850 and 1140 cm-1 (Fig. 2A). The baseline 164
corrected spectra were smoothed using a Whittaker function to maximize the signal to noise 165
ratio (Eilers, 2003; see supplementary code for an example), and then the intensity 166
normalised to vary between 0 and 1 (Fig 2B). The spectra resulting from this arbitrary 167
baseline correction can not be used to infer the glass structure. However, the correction 168
provides a simple method for isolating variations in the Raman signals related to changes in 169
Fe oxidation state (Fig 2B). Furthermore, the arbitrary baseline correction was found to be 170
beneficial because it avoids the introduction of random errors associated with variations in 171
the real spectral background when the sample signal is low (e.g. near 1250 cm-1). 172
173
2.4 Determining the oxidation state of iron by Raman spectroscopy
174 175
In this study, six different methods were evaluated to determine the oxidation state of Fe in 176
the suite of MORB glass standards (Table 1) from the background subtracted 850-1140 cm-1 177
region of the Raman spectra (Fig. 2B). The idea is to relate, for a set of glass standards with 178
fixed major element composition, changes in the Raman spectra to changes in Fe3+/FeTOT. 179
The six methods investigated are described below. 180
181
2.4.1 Intensity method
182 183
The intensity of the Raman spectra between 850 and 1140 cm-1 varies systematically with 184
Fe3+/FeTOT in the glass standards (Figs. 1, 2B). In particular, the intensity at 930 cm-1 varies 185
strongly with Fe3+/FeTOT. This feature has contributions from Fe3+-O (Virgo et al., 1982; 186
Magnien et al., 2006; Di Muro et al., 2009), and thus should be ideal for determining 187
Fe3+/FeTOT. Two methods were tested to quantify the intensity at 930 cm-1: direct 188
measurement at fixed frequency (the average of values between 929 and 931 cm-1) and by 189
peak fitting the 850-1140 cm-1 spectral envelop with arbitrary Gaussian components. Direct 190
measurements of the intensity at 930 cm-1 (hereafter abbreviated I930) provided the better
191
precision and this approach was used. 192
193
2.4.2 Mixing method
194 195
The Mixing method is based on the bilinear model that describes the matrix dataset , of 196
dimension n spectra times m features (i.e. Raman shifts), as: 197
198
, (1)
199 200
where is the matrix of component fractions, the matrix of partial spectral
201
components (endmember spectra), k the number of components and a noise term. In the 202
present case, k = 2 (reduced and oxidised endmembers), as verified by a principal component 203
analysis of the 13 standards, which revealed that two components account for more than 204
99.8% of the variance in the data. Using the notation SOX and SRED to designate the oxidised
205
(Fe3+/FeTOT = 1) and reduced (Fe3+/FeTOT = 0) Raman spectral components, and FOX as the
206
fraction of SOX, eq. (1) can be re-arrange as:
207 208
. (2)
209 210
We used least absolute regression (LAD) to determine FOX, because LAD is more robust than
211
least squares with respect to outliers or non-Gaussian distributions (Tarantola, 2005). The 212
optimised FOX values can then be related to the glass Fe3+/FeTOT values (Di Genova et al.,
213
2016). 214
215
2.4.3 Alternative Least Square Multivariate Curve Resolution (ALS MCR)
216 217
Solving eq. (1) usually requires either or . For example, are obtained from
218
in the Mixing method (sec. 2.4.2). However, several techniques allow both and to
219
be estimated from , as for example independent component analysis (e.g. Hyvärinen et
220
al., 2001), non-negative matrix factorisation (e.g. Lin, 2007), and iterative optimisation (e.g. 221
Zakaznova-Herzog et al., 2007). For the present dataset of spectra, several conditions need to 222
be satisfied: (i) ; (ii) = 1 - ; and (iii) . Of the available
223
methods, self-modelling curve resolution (Jiang et al., 2004; de Juan and Tauler, 2006), also 224
known as multivariate curve resolution, can help solve the present problem. As they do not 225
require prior knowledge of neither nor , those methods belong to the class of 226
unsupervised machine learning algorithms. 227
228
In this study, the Alternative Least Square Multivariate Curve Resolution (ALS MCR) method 229
was used to iteratively optimise and . The PyMCR python library was used, starting 230
the algorithm with estimations of obtained from mean spectra from our spectral dataset. 231
The algorithm was allowed to perform 50 iterations. After convergence, usually achieved in 232
only a few iterations, optimised and matrices are available for the investigated 233
dataset. The spectral endmembers stored in the optimised matrix (i.e. optimised FOX and
234
FRED) can then be used with the Mixing method for new samples.
235 236
Convergence of the ALS MCR algorithm is inherently dependent on the starting conditions 237
(e.g. Valderrama et al., 2016). The effects of the range of Fe3+/FeTOT values included in , 238
and the starting components, were tested using iterative protocols. The Fe3+/FeTOT 239
dataset range can be represented by two variables: (i) Fe3+/FeTOT of , which represents 240
the difference of Fe3+/FeTOT between the most reduced and the most oxidized samples in the 241
dataset; and (ii) mean Fe3+/FeTOT of , which is the mean value of Fe3+/FeTOT of the 242
dataset. 243
Similarly, variations in the initial components are represented using two parameters: (i)
244
Fe3+/FeTOT of represents the difference of Fe3+/FeTOT between the two initial
245
components; and (ii) mean Fe3+/FeTOT of , which is the average value of the Fe3+/FeTOT of 246
the two initial components. 247
To determine how the root-mean-square deviations between the estimated and nominal 248
Fe3+/FeTOT values of the standard vary with Fe3+/FeTOT and mean Fe3+/FeTOT of , and
249
Fe3+/FeTOT and mean Fe3+/FeTOT of , these values were varied by iteration, such that 250
different subsets of and were generated. These subsets were provided to the ALS 251
MCR algorithm to calculate optimised and matrices. These optimised matrices
252
were then used to determine Fe3+/FeTOT for the entire and datasets. 253
254
2.4.4 Neural Networks, Kernel Ridge and Support Vector regressions
255 256
The three other techniques that were investigated used the supervised machine learning 257
regression algorithms Neural Networks, Kernel Ridge, and Support Vector from the Scikit 258
Learn library (Pedregosa et al., 2011). An interface for using these algorithms for Raman data 259
was implemented in the Rampy library (Le Losq, 2018) through the class mlregressor (see 260
the Jupyter notebook in the supplementary materials as well as the rampy.mlregressor help). 261
The machine learning algorithms require the data to be divided into two subsets: a training 262
subset to train the different algorithms, and a testing subset that are treated as unknowns to
263
evaluate the predictive error of the algorithms. The train-test split was performed by 264
randomly sorting the dataset according to their Fe3+/FeTOT values (function chemical_splitting 265
from the rampy library). The testing data subset was ~ 38 % of the total dataset. 266
267
The Neural Network technique uses a network of activation units, which are Rectifier 268
functions [y = max(0,x)] (Glorot et al., 2011) in the present study, to map the relationship 269
between the Raman spectra and Fe3+/FeTOT values of the glasses(see description in Bengio, 270
2009 and references therein). The activation units have adjustable parameters, called weights 271
and bias, that are optimised by least square regression. This method makes no assumptions 272
about the linearity of variations in the Raman spectra with Fe3+/FeTOT. The network was 273
optimised by testing different architectures to minimize the training and testing errors, and to 274
keep those two values as close as possible to each other. A simple architecture with three 275
activation units in a single hidden layer provided the most robust fits. Adding more 276
activations units or layers did not decrease the error metrics of the network, and hence this 277
simple architecture was used. The Limited-memory Broyden-Fletcher-Goldfarb-Shanno 278
(lbfgs) solver was chosen, as it performs better than others for the present small dataset. 279
Bagging, which consists of training multiple networks and returning the average of their 280
outputs (Breiman and Breiman, 1996), was performed to avoid over-fitting and to promote 281
the ability of the network to predict new values. A total of 100 networks were trained, and the 282
results represent the average output of these 100 networks. 283
284
The Kernel Ridge and Support Vector techniques regress the data after their projection in a 285
high-dimensionality space. This projection was done using a non-linear radial basis kernel 286
function, such that the Raman intensity can non-linearly depend on Fe3+/FeTOT. The 287
difference between the Kernel Ridge and Support Vector regressions lies in the use of 288
different loss functions: Kernel Ridge regression uses a penalized (l2 normalisation) residual
289
of the sum of squares, whereas Support Vector regression uses a -insensitive loss function ( 290
is a deviation term in the loss function, i.e. the predictions are allowed to be as far from the 291
calibration data as ). More information on these algorithms is available in Murphy (2012), 292
Smola and Schölkopf (2004) and Vapnik (1999). The hyper-parameters of the Kernel Ridge 293
and Support Vector algorithms were automatically tuned by performing a random 5-fold 294
cross-validation on the training dataset. 295
A Jupyter notebook running under the Python language, together with all the spectra, are 297
provided as supplementary materials to enable the results of this study, and the figures, to be 298 reproduced. 299 300 301 302 3. Results 303 304
3.1 Raman spectra of MORB glass standards
305 306
The Raman spectra of the MORB glass standards exhibit peaks and shoulders at ~ 505, 570, 307
660, 735, 804, 930 and 1005 cm-1 (A to G markers in Fig. 1), with intensities that depend on 308
Fe3+/FeTOT. The intensity of the A, B, C and D Raman signals decreases with decreasing 309
Fe3+/FeTOT (Fig. 1, Table 1), whereas that of E and G increases (Figs. 1, 2B). The intensity of 310
F relative to that of G decreases with decreasing Fe3+/FeTOT (Fig. 2B). 311
312
The changes in the Raman spectra of the glasses following changes in Fe3+/FeTOT reflect 313
changes in (i) the Fe3+ contribution to the Raman signals, and (ii) the overall glass structure 314
as Fe3+ and Fe2+ have different roles. The signals in the 810-1300 cm-1 region of the Raman 315
spectra of MORB glasses can be assigned to symmetric and asymmetric stretching of Qn 316
SiO4-AlO4 units, where n is the number of bridging oxygens (Brawer and White, 1975, 1977;
317
Furukawa and White, 1980; Furukawa et al., 1981; Mysen et al., 1982; McMillan, 1984; 318
Mysen, 1990; Le Losq and Neuville, 2013; Le Losq et al., 2014). The intensity at F is 319
assigned to the combination of signals from Fe3+-O stretching in the glass network (Virgo et 320
al., 1982; Wang et al., 1995; Magnien et al., 2004, 2006, 2008; Di Muro et al., 2009; Cochain 321
et al., 2012) and Si-O stretching in Q2 units (McMillan, 1984; Mysen et al., 1982; Virgo et 322
al., 1980). This assignment agrees with (i) the decrease in the relative intensity of F with Fe 323
reduction (Figs. 1, 2B) and (ii) the presence of F as a shoulder in the most reduced spectra 324
(Figs. 1, 2B). The peak near 1005 cm-1 mainly comprises contributions from Si-O and Al-O 325
stretching in Q3 units. This signal usually occurs near 1100 cm-1 in Al-free silicate glasses 326
(e.g. Mysen et al., 1982; McMillan, 1984) but shifts to lower frequencies in aluminosilicate 327
glasses (Neuville and Mysen, 1996; Mysen et al., 2003; Le Losq and Neuville, 2013). This 328
assignment is consistent with the composition of MORB glasses; with NBO/T values ranging 329
from ~ 0.5 to ~ 1.0 (Mysen and Richet, 2005), they are expected to be enriched in Q3 units 330
and to contain minor fractions of Q2 and Q4 (e.g. Maekawa et al., 1991). 331
332
3.2 Raman spectroscopy as a tool for determining Fe3+/FeTOT of MORB glasses
333 334
3.2.1 The Intensity method
335 336
I930 in the Raman spectra of the synthetic MORB glasses is linearly correlated with
337
Fe3+/FeTOT (Fig. 3), with a correlation coefficient of 0.9973. It is thus possible to determine 338
Fe3+/FeTOT of a glass from the I930 scaled Raman intensity using the equation:
339 340
Fe3+/FeTOT = 4.084(38) I930 - 2.779(29) . (3)
341 342
The root-mean-square deviation between the Fe3+/FeTOT values of the standards and those 343
calculated with eq. 3 is 0.02 (1). 344
345
3.2.2 The Mixing method
346 347
Following a protocol similar to that described by Di Genova et al. (2016), we used the 348
average of the five spectra recorded for the most oxidized and reduced glasses (log fO2 = 4.8
349
and -11.0, Table 1) as endmembers. Then, FOX was adjusted by least absolute regression to
350
obtain mixed spectra that matched the observed ones (Fig. 4A). The correlation between FOX
351
and Fe3+/FeTOT is shown in Figure 4B; the correlation coefficient is 0.9974. FOX is linearly
352
proportional to Fe3+/FeTOT. This result differs from the finding of Di Genova et al. (2016), 353
who reported non-linear variations of FOX with Fe3+/FeTOT for rhyolite and basalt glasses.
354
This may be due to the fact that these authors did not use endmember spectra with Fe3+/FeTOT 355
of 0 and 1, but of intermediate values. In the present case, FOX and Fe3+/FeTOT are related by:
356 357
Fe3+/FeTOT = 1.02(1) FOX – 0.003(4) . (4)
358 359
FOX directly gives Fe3+/FeTOT of MORB glasses to within 0.03 (1).
360 361
3.2.3 The ALS MCR method
363
For a set of glasses with unknown but varying Fe3+/FeTOT values, ALS MCR can determine 364
the endmember spectra (i.e. spectra corresponding to Fe3+/FeTOT = 0 and 1), and hence, 365
Fe3+/FeTOT for any MORB glass by linear combination fitting. 366
367
Figure 5 presents the results obtained from tests performed to evaluate the sensitivity of ALS 368
MCR to the starting conditions (see sec. 2.4.3). The best results were obtained when the
369
dataset covered the widest possible range of Fe3+/FeTOT values, i.e. when Fe3+/FeTOT of 370
1 and mean Fe3+/FeTOT of ~ 0.4 - 0.5 (Fig. 5A). Fe3+/FeTOT root-mean-square
371
deviations < 0.06 were achieved using datasets with Fe3+/FeTOT of D ≥ 0.75 and mean 372
Fe3+/FeTOT of D [0.35,0.55]. The choice of the initial seems less critical, but still 373
affects the accuracy of the ALS MCR method (Fig. 5B). Fe3+/FeTOT root-mean-square 374
deviations < 0.03 were obtained for initial with mean Fe3+/FeTOT [0.4,0.6] and 375
Fe3+/FeTOT [0.1,0.6]. 376
377
The ALS MCR method was tested further by optimising using the full dataset .
378
From Figure 5B, initial S components with Fe3+/FeTOT and mean Fe3+/FeTOT of ~ 0.5 and 379
0.4, respectively, should provide best results. Thus, the mean spectra at Fe3+/FeTOT = 0.66 and 380
0.25 were selected as initial components. Selecting mean spectra with Fe3+/FeTOT = 0 381
and 1 does not significantly change the results, but the present choice allows the effects of 382
differences in the initial and optimised components to be illustrated, as shown in Figure 383
6A. The optimised spectra are clearly different from their initial values, demonstrating 384
the ability of ALS MCR to identify the true endmembers. The optimised produce 385
good fits to the observed spectra (Fig. 6B). The fraction of the oxidised endmember, COX,is
386
linearly related to the Fe3+/FeTOT of the glass by (Fig. 6C): 387
388
Fe3+/FeTOT = 1.07(1) COX – 0.035(5) . (5)
389 390
Contrary to FOX, COX is not directly equal to Fe3+/FeTOT. This is because of small differences
391
between the optimised endmembers and the mean Raman spectra at Fe3+/FeTOT = 0 and
392
1 (residuals shown in Fig. 6A). These differences introduce a bias, such that using COX as a
393
direct estimate of Fe3+/FeTOT leads to slightly (~ 0.02) under- and over-estimations of 394
Fe3+/FeTOT, depending on the glass Fe3+/FeTOT. Because of that, the root-mean-square 395
deviation between the Raman-determined and standard Fe3+/FeTOT values is ± 0.04 when 396
assuming FOX = COX. Slightly better results were obtained using eq. 5, which allows
397
Fe3+/FeTOT of the glasses to be determined within ± 0.03 (Table 1). 398
399
3.2.4 Neural Networks, Kernel Ridge and Support Vector regression methods
400 401
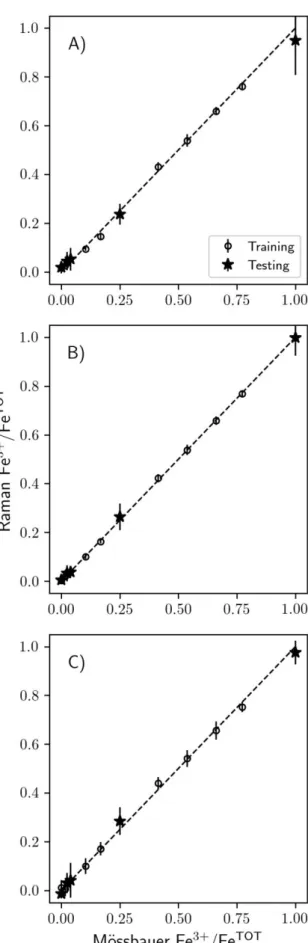
The Neural Network, Kernel Ridge, and Support Vector methods performed very well on 402
both the training and testing datasets (Fig. 7), with root-mean-square deviations between the 403
measured and predicted Fe3+/FeTOT values of ~ 0.01-0.03 (Table 1). For all methods, the root-404
mean-square deviations for the training dataset were slightly lower than that for the testing 405
dataset, indicating that machine-learning algorithms tend to slightly over-fit the training 406
dataset. Over-fitting is not desirable because it indicates that the generalisation ability of the 407
algorithms (i.e. their ability to predict values for new samples) may not be optimal. However, 408
in the present case, the difference between the training and testing standard deviations is 409
small (≤ 0.02), and the over-fitting is considered to be negligible. Therefore, these algorithms 410
can be used to predict Fe3+/FeTOT of MORB glasses with an error ≤ ± 0.03 (1). 411
412
3.2.5 Is there a better method? 413
414
The root-mean-square deviations between the Fe3+/FeTOT values determined by 415
Mössbauer and Raman spectroscopy are < 0.04 for all six methods. The Intensity and Mixing 416
methods are as accurate and precise as those using machine learning (ALS MCR, Neural 417
Network, Kernel Ridge and Support Vector; Table 1).
418 419
The choice of method depends on the aims of the study and the dataset. If a single data 420
reduction method was to be chosen, the simplicity of the Intensity and Mixing methods makes 421
these appealing. In the case the Fe3+/FeTOT of the standards are unknown, the ALS MCR 422
method may allow components to be extracted and the Fe3+/FeTOT to be determined, if 423
the dataset covers a large range of Fe3+/FeTOT values (Fig. 5). The Intensity, Mixing and ALS 424
MCR methods all rely on linear variations between Raman signals and Fe3+/FeTOT of the 425
glasses. In contrast, the Neural Network, Kernel Ridge, and Support Vector methods do not 426
assume linear variations and do not require the mathematical form of the variations to be 427
known. 428
429
Ultimately, we recommend the use of multiple data reduction methods, as undertaken 430
here, to test the consistency of results. This is desirable because each data reduction protocol 431
may be differently sensitive to how differences in composition affect the Raman spectra (Fig. 432
2B). Therefore, following a Bayesian approach, the average of the results from all the 433
methods should be more robust than any single estimate (e.g. Perrone, 1993). In the present 434
case, such an approach is easy to implement because all the methods presented in this study 435
are simple to setup and cheap in terms of computing resources. For the present dataset, 436
averaging the results of the six models to obtain an estimate of the Fe3+/FeTOT from the 437
Raman spectra of the glasses resulted in a root-mean-square deviation of 0.02 (1). 438
439
3.2.6 Application to natural MORB glasses 440
441
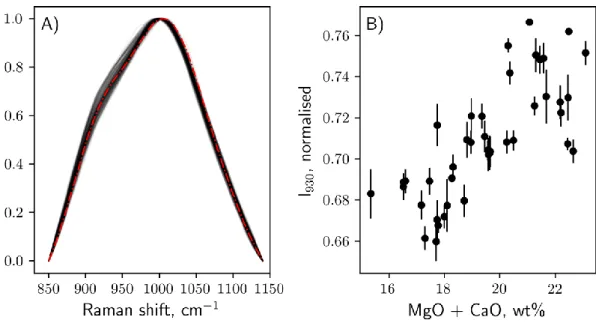
The baseline subtracted and normalised Raman spectra of natural MORB glasses are shown 442
in Figure 8A (see supplementary Jupyter Notebook for full spectra). While their spectra are 443
similar to that of the glass standard with Fe3+/FeTOT = 0.106, non-negligible differences are 444
apparent (8A). I930 varies between 0.64 and 0.76, and is correlated with the concentration of
445
MgO and CaO in the glass (Pearson correlation coefficient = 0.76, Fig. 8B). For the glass 446
standards, a difference of ~ 0.2 in I930corresponds to a difference in Fe3+/FeTOT of ~ 0.2 (Fig.
447
3). For these spectra, the methods described give an average Fe3+/FeTOT of 0.16 with a large 448
standard deviation of 0.12. 449
450
It is possible to refine this estimate by including a compositional term in the expressions 451
relating Raman features to Fe3+/FeTOT . We focused on the Intensity method and expressed 452 I930 as: 453 454 I930 = (K0 + K1 Fe3+/FeTOT) + K2 X , (6) 455 456
where X is a parameter reflecting the chemistry of the samples, and K0, K1 and K2 constants. 457
X could be chosen as either [MgO+CaO] or the number of non-bridging oxygen per 458
tetrahedral units (NBO/T) in the glass. Increasing [MgO + CaO] favours the formation of 459
non-bridging oxygens and thus depolymerised Q2 units in basaltic glasses, which give signals 460
near 950 cm-1 (e.g. Mysen et al., 1982). This is consistent with the positive trend observed 461
between I930 and [MgO + CaO] (Fig. 8B). However, while NBO/T parameterises the general
462
effect of variations in the fractions of network formers (e.g. Si, Al) and network modifiers 463
(e.g. Na, K, Ca, Mg) on the glass structure, it does not consider the effect of the ionic 464
properties of network modifiers on the distribution of Qn units, which contribute to the 465
Raman intensity between 850 and 1140 cm-1. For example, at a constant NBO/T of 0.5, the 466
fractions of Q4 and Q2 increase at the expense of that of Q3 in alkali silicate glasses as the 467
ionic field strength (Z/r2, where Z is the electric charge and r the ionic radius) of the alkali 468
metal cation increases (Maekawa et al., 1991). The ionic field strength of metal cations also 469
influences many other structural properties of silicate glasses and melts, including the 470
fraction of highly-coordinated Al, excess NBO, and Si-Al disorder (see Le Losq et al., 2019 471
for a review). As a result, to capture changes in the Raman spectra due to variations in the 472
sample chemistry, we used the mean ionic field strength (IFS) of network modifiers (M), 473
IFS(M), as the X parameter in eq. (6): 474 475 476 , (7) 477 478 where
are the mol fractions of the oxide components
, and IFS is the ionic field
479
strength of the cation , calculated as Z/r2. The r values were taken from Shannon (1976), 480
with coordination numbers (CN) of 6 for all M cations. For simplicity, we do not consider 481
variations in CN although they will vary with glass composition (Le Losq et al., 2019 and 482
references therein), but probably this effect is negligible due to limited range of 483
compositional variability of MORB. We also consider FeO as equal to total Fe because the 484
Fe3+/FeTOT ratio of natural MORB is always low (~0.1) and constant (e.g. Berry et al., 2018; 485
Zhang et al., 2018), such that any influence of Fe on the glass structure will come from 486
variations in .
487 488
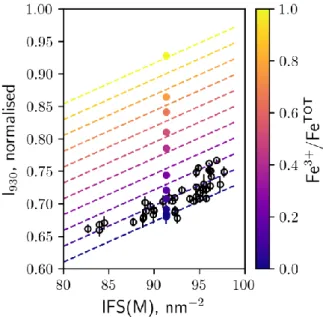
The correlation between I930 and IFS(M) is linear for natural MORB glasses (Fig. 9). The
489
ordinate at the origin of this trend corresponds to K0 + K1 Fe3+/FeTOT, and its slope to K2. 490
K1 is directly given by the linear trend between Fe3+/FeTOT and I930 (Fig. 3), and is equal to
491
0.2435(23), while K2 equals 0.00624(29). It then is trivial to determine K0 as 0.111(27). 492
Using these parameters, it is possible to plot iso-redox curves of IFS(M) versus I930, as shown
493
in Fig. 9. A visual inspection indicates that the natural samples have a mean Fe3+/FeTOT value 494
~ 0.1, although there is significant scatter. Manipulating eq. (7) to extract Fe3+/FeTOT values 495
for natural MORB from K0, K1, K2 and I930 yields a mean Fe3+/FeTOT of 0.090(67).
496 497
4. Discussion 498
499
Both conventional methods (Intensity, Mixing) and machine learning algorithms (ALS MCR, 500
Kernel Ridge, Support Vector and Neural Network) allow Fe3+/FeTOT to be determined from 501
the Raman spectra of glasses, with fixed major element composition, with uncertainties < 502
0.04 (Table 1). The combination of all six methods gives a precision of 0.02. The Intensity 503
and Mixing methods are simple and provide accurate results. The machine learning methods 504
performed well despite being trained with a limited set of samples. The ALS MCR method 505
may be useful if the Fe3+/FeTOT values of the glass standards are unknown, or if endmember 506
spectra are not available. Kernel Ridge, Support Vector and Neural Network regression 507
algorithms relate Fe3+/FeTOT of the glasses to variations in their Raman spectra without any 508
assumptions about the form of the variations. Pooling the results from multiple data reduction 509
protocols is recommended for maximizing the robustness of Fe3+/FeTOT determinations for 510
glasses with fixed composition. 511
512
The determination of Fe3+/FeTOT in natural MORB glasses requires a correction for the effect 513
of composition on the Raman spectra (Figs. 8B, 9, eq. 7). The corrected mean value of 514
Fe3+/FeTOT = 0.090(67) is in agreement with the latest XANES and wet chemistry 515
measurements (Bézos and Humler, 2005; Berry et al., 2018; Zhang et al., 2018). In particular, 516
this estimate is in close agreement with the XANES estimate of 0.10(1) reported by Berry et 517
al. (2018) for the same set of samples, which suggests an average fO2 for MORB of 0.1 above
518
the quart-fayalite-magnetite redox buffer. 519
520
Raman spectroscopy can thus provide reasonable estimates of Fe3+/FeTOT in glasses, as long 521
as the effect of glass chemistry is considered. However, the present results do not achieve the 522
precision of Fe K-edge XANES, Mössbauer spectroscopy or wet chemistry for natural 523
samples with variable chemical composition. While eq. (6) is valid for MORB glasses, it is 524
probably not suitable for determining Fe3+/FeTOT in other compositions. However, with a set 525
of appropriate standards, Raman spectroscopy could be used to quantify Fe3+/FeTOT in any 526
composition through the use of a chemical correction similar to that of eq. (6). 527
5. Implications 529
530
Machine learning techniques do not seem to be advantageous relative to conventional 531
approaches for quantifying Fe3+/FeTOT in glasses with fixed standard composition by Raman 532
spectroscopy. However, their ease of implementation and flexibility (the problem can be 533
linear or not) make them preferable to other user-defined techniques when the functional 534
form of the problem is unknown. In particular, the sensitivity of Raman spectra to glass 535
structure can be used to determine glass composition. Di Genova et al. (2015; 2016) proposed 536
use of the mixing method to determine the composition of natural glasses from their Raman 537
spectra. This required a post-analysis step in the data treatment as the mixing ratio of end-538
member spectra varied non-linearly with glass composition. In the present case, we trained a 539
neural network to directly link the corrected 850-1140 cm-1 Raman signals (Fig. 8A) to the 540
measured concentrations of major elements in the natural MORB glasses (supplementary 541
materials), without any additional data manipulation. The results from one of the trained 542
neural networks are shown in Figure 10. The network was able to predict the chemistry of 543
MORB glasses with maximum errors of ~ 1 mol%. This result suggests that Raman 544
spectroscopy may be developed as a chemical probe. It also demonstrates the usefulness of 545
neural networks for such calculations, as the algorithm directly provides the glass 546
composition without intermediate data analysis steps, as required by the method of Di 547
Genova et al. (2015; 2016). The approach could allow Raman spectroscopy to be used in situ 548
to analyse erupting basalts forming pillow lavas with glassy rims at ocean ridges, using 549
submersibles equipped with Raman spectrometers already developed for deep sea water 550
analysis (e.g. Brewer et al., 2004; White et al., 2005; Du et al., 2015), or for using Raman 551
spectrometers as chemical probes during missions on planets or moons with dense 552
atmospheres. The fact that all data processing performed in this study uses Python, a 553
programming language that can be easily used in embedded systems would facilitate uptake. 554
The present approach should be easy to implement in any system operating a portable Raman 555 spectrometer. 556 557 Acknowledgement 558 559
The Department of Mineral Sciences, Smithsonian Institution, of thanked for providing the 560
samples of MORB glass. H.O.N thanks the Australian Research Council for the award of a 561
Laureate Fellowship (FL130100066). C.L.L. thanks Guil Malmann for helpful discussions. 562
563
References 564
565
Asimow, P.D., Dixon, J.E., Langmuir, C.H., 2004. A hydrous melting and fractionation 566
model for mid-ocean ridge basalts: Application to the Mid-Atlantic Ridge near the 567
Azores. Geochem. Geophys. Geosystems 5. https://doi.org/10.1029/2003GC000568 568
Behrens, H., Roux, J., Neuville, D., Siemann, M., 2006. Quantification of dissolved H₂ O in 569
silicate glasses using confocal microRaman spectroscopy. Chem. Geol. 229, 96–112. 570
Bengio, Y., 2009. Learning Deep Architectures for AI. Found. Trends® Mach. Learn. 2, 1– 571
127. https://doi.org/10.1561/2200000006 572
Berry, A.J., Danyushevsky, L.V., O’Neill, H.S.C., Newville, M., Sutton, S.R., 2008. 573
Oxidation state of iron in komatiitic melt inclusions indicates hot Archaean mantle. 574
Nature 455, 960–963. https://doi.org/10.1038/nature07377 575
Berry, A.J., Stewart, G.A., O’Neill, H.S.C., Mallmann, G., Mosselmans, J.F.W., 2018. A re-576
assessment of the oxidation state of iron in MORB glasses. Earth Planet. Sci. Lett. 577
483, 114–123. https://doi.org/10.1016/j.epsl.2017.11.032 578
Bézos, A., Humler, E., 2005. The Fe3+/ΣFe ratios of MORB glasses and their implications for 579
mantle melting. Geochim. Cosmochim. Acta 69, 711–725. 580
https://doi.org/10.1016/j.gca.2004.07.026 581
Brawer, S.A., White, W.B., 1977. Raman spectroscopic investigation of the structure of 582
silicate glasses (II). Soda-alkaline earth-alumina ternary and quaternary glasses. J. 583
Non-Cryst. Solids 23, 261–278. https://doi.org/10.1016/0022-3093(77)90009-6 584
Brawer, S.A., White, W.B., 1975. Raman spectroscopic investigation of the structure of 585
silicate glasses. I. The binary alkali silicates. J. Chem. Phys. 63, 2421–2432. 586
https://doi.org/10.1063/1.431671 587
Breiman, L., Breiman, L., 1996. Bagging Predictors, in: Machine Learning. pp. 123–140. 588
Brewer, P.G., Malby, G., Pasteris, J.D., White, S.N., Peltzer, E.T., Wopenka, B., Freeman, J., 589
Brown, M.O., 2004. Development of a laser Raman spectrometer for deep-ocean 590
science. Deep Sea Res. Part Oceanogr. Res. Pap. 51, 739–753. 591
https://doi.org/10.1016/j.dsr.2003.11.005 592
Christie, D.M., Carmichael, I.S.E., Langmuir, C.H., 1986. Oxidation states of mid-ocean 593
ridge basalt glasses. Earth Planet. Sci. Lett. 79, 397–411. 594
https://doi.org/10.1016/0012-821X(86)90195-0 595
Cochain, B., Neuville, D.R., Henderson, G.S., McCammon, C.A., Pinet, O., Richet, P., 2012. 596
Effects of the iron content and redox state on the structure of sodium borosilicate 597
glasses: A Raman, Mössbauer and boron K-Edge XANES spectroscopy study. J. Am. 598
Ceram. Soc. 95, 962–971. 599
Cottrell, E., Kelley, K.A., 2013. Redox heterogeneity in mid-ocean ridge basalts as a function 600
of mantle source. Science 340, 1314–1317. https://doi.org/10.1126/science.1233299 601
Cottrell, E., Kelley, K.A., 2011. The oxidation state of Fe in MORB glasses and the oxygen 602
fugacity of the upper mantle. Earth Planet. Sci. Lett. 305, 270–282. 603
https://doi.org/10.1016/j.epsl.2011.03.014 604
Cottrell, E., Lanzirotti, A., Mysen, B.O., Birner, S., Kelley, K.A., Botcharnikov, R.E., Davis, 605
F.A., Newville, M., in press. A Mössbauer-based XANES calibration for hydrous 606
basalt glasses reveals radiation-induced oxidation of Fe. Am. Mineral. 607
https://doi.org/10.2138/am-2018-6268 608
de Juan, A., Tauler, R., 2006. Multivariate Curve Resolution (MCR) from 2000: Progress in 609
Concepts and Applications. Crit. Rev. Anal. Chem. 36, 163–176. 610
https://doi.org/10.1080/10408340600970005 611
Di Genova, D., Hess, K.-U., Chevrel, M.O., Dingwell, D.B., 2016. Models for the estimation 612
of Fe3+/Fetot ratio in terrestrial and extraterrestrial alkali- and iron-rich silicate glasses 613
using Raman spectroscopy. Am. Mineral. 101, 943–952. 614
Di Genova, Danilo, Kolzenburg, S., Vona, A., Chevrel, M.O., Hess, K.-U., Neuville, D.R., 615
Ertel-Ingrisch, W., Romano, C., Dingwell, D.B., 2016. Raman spectra of Martian 616
glass analogues: A tool to approximate their chemical composition. J. Geophys. Res. 617
Planets 121, 2016JE005010. https://doi.org/10.1002/2016JE005010 618
Di Genova, D., Morgavi, D., Hess, K.-U., Neuville, D.R., Borovkov, N., Perugini, D., 619
Dingwell, D.B., 2015. Approximate chemical analysis of volcanic glasses using 620
Raman spectroscopy. J. Raman Spectrosc. 46, 1235–1244. 621
https://doi.org/10.1002/jrs.4751 622
Di Genova, D., Sicola, S., Romano, C., Vona, A., Fanara, S., Spina, L., 2017. Effect of iron 623
and nanolites on Raman spectra of volcanic glasses: A reassessment of existing 624
strategies to estimate the water content. Chem. Geol. 475, 76–86. 625
https://doi.org/10.1016/j.chemgeo.2017.10.035 626
Di Muro, A., Métrich, N., Mercier, M., Giordano, D., Massare, D., Montagnac, G., 2009. 627
Micro-Raman determination of iron redox state in dry natural glasses: Application to 628
peralkaline rhyolites and basalts. Chem. Geol. 259, 78–88. 629
https://doi.org/10.1016/j.chemgeo.2008.08.013 630
Du, Z., Li, Y., Chen, J., Guo, J., Zheng, R., 2015. Feasibility investigation on deep ocean 631
compact autonomous Raman spectrometer developed for in-situ detection of acid 632
radical ions. Chin. J. Oceanol. Limnol. 33, 545–550. https://doi.org/10.1007/s00343-633
015-4096-8 634
Eilers, P.H.C., 2003. A perfect smoother. Anal. Chem. 75, 3631–3636. 635
https://doi.org/10.1021/ac034173t 636
Furukawa, T., Fox, K.E., White, W.B., 1981. Raman spectroscopic investigation of the 637
structure of silicate glasses. III. Raman intensities and structural units in sodium 638
silicate glasses. J. Chem. Phys. 75, 3226–3237. https://doi.org/10.1063/1.442472 639
Furukawa, T., White, W.B., 1980. Vibrational spectra and glass structure. J. Non-Cryst. 640
Solids 38, 87–92. 641
Gale, A., Dalton, C.A., Langmuir, C.H., Su, Y., Schilling, J.-G., 2013. The mean composition 642
of ocean ridge basalts. Geochem. Geophys. Geosystems 14, 489–518. 643
https://doi.org/10.1029/2012GC004334 644
Galeener, F.L., Sen, P.N., 1978. Theory of the first-order vibrational spectra of disordered 645
solids. Phys. Rev. B 17, 1928–1933. 646
Glorot, X., Bordes, A., Bengio, Y., 2011. Deep sparse rectifier neural networks, in: 647
International Conference on Artificial Intelligence and Statistics. pp. 315–323. 648
Hyvärinen, A., Karhunen, J., Oja, E., 2001. Independent component analysis. John Wiley & 649
Sons, Inc. 650
Jenner, F.E., O’Neill, H.S.C., 2012. Analysis of 60 elements in 616 ocean floor basaltic 651
glasses: TECHNICAL BRIEF. Geochem. Geophys. Geosystems 13, n/a-n/a. 652
https://doi.org/10.1029/2011GC004009 653
Jiang, J.-H., Liang, Y., Ozaki, Y., 2004. Principles and methodologies in self-modeling curve 654
resolution. Chemom. Intell. Lab. Syst. 71, 1–12. 655
https://doi.org/10.1016/j.chemolab.2003.07.002 656
Kendrick, M.A., Arculus, R., Burnard, P., Honda, M., 2013. Quantifying brine assimilation 657
by submarine magmas: Examples from the Galápagos Spreading Centre and Lau 658
Basin. Geochim. Cosmochim. Acta 123, 150–165. 659
https://doi.org/10.1016/j.gca.2013.09.012 660
Langmuir, C.H., Klein, E.M., Plank, T., 1992. Petrological Systematics of Mid-Ocean Ridge 661
Basalts: Constraints on Melt Generation Beneath Ocean Ridges, in: Mantle Flow and 662
Melt Generation at Mid-Ocean Ridges, Geophysical Monograph. American 663
Geophysical Union (AGU), pp. 183–280. https://doi.org/10.1029/GM071p0183 664
Le Losq, C., 2018. Rampy: a Python library for processing spectroscopic (IR, Raman, 665
XAS...) data. Zenodo. https://doi.org/10.5281/zenodo.1168730 666
Le Losq, C., Cicconi, M.R., Greaves, G.N., Neuville, D.R., 2019. Silicate Glasses, in: 667
Handbook of Glass. Springer. 668
Le Losq, C., Neuville, D.R., 2013. Effect of the Na/K mixing on the structure and the 669
rheology of tectosilicate silica-rich melts. Chem. Geol. 346, 57–71. 670
http://dx.doi.org/10.1016/j.chemgeo.2012.09.009 671
Le Losq, C., Neuville, D.R., Florian, P., Henderson, G.S., Massiot, D., 2014. The role of Al3+ 672
on rheology and structural changes of sodium silicate and aluminosilicate glasses and 673
melts. Geochim. Cosmochim. Acta 126, 495–517. 674
https://doi.org/10.1016/j.gca.2013.11.010 675
Le Losq, C., Neuville, D.R., Moretti, R., Roux, J., 2012. Determination of water content in 676
silicate glasses using Raman spectrometry: Implications for the study of explosive 677
volcanism. Am. Mineral. 97, 779–790. https://doi.org/10.2138/am.2012.3831 678
Lin, C.-J., 2007. Projected Gradient Methods for Nonnegative Matrix Factorization. Neural 679
Comput. 19, 2756–2779. https://doi.org/10.1162/neco.2007.19.10.2756 680
Maekawa, H., Maekawa, T., Kawamura, K., Yokokawa, T., 1991. The structural groups of 681
alkali silicate glasses determined from 29Si MAS-NMR. J. Non-Cryst. Solids 127, 53– 682
64. https://doi.org/10.1016/0022-3093(91)90400-Z 683
Magnien, V., Neuville, D., Cormier, L., Roux, J., Hazemann, J., Deligny, D., Pascarelli, S., 684
Vickridge, I., Pinet, O., Richet, P., 2008. Kinetics and mechanisms of iron redox 685
reactions in silicate melts: The effects of temperature and alkali cations. Geochim. 686
Cosmochim. Acta 72, 2157–2168. 687
Magnien, V., Neuville, D.R., Cormier, L., Mysen, B.O., Briois, V., Belin, S., Pinet, O., 688
Richet, P., 2004. Kinetics of iron oxidation in silicate melts: a preliminary XANES 689
study. Chem. Geol. 213, 253–263. 690
Magnien, V., Neuville, D.R., Cormier, L., Roux, J., Hazemann, J.L., Pinet, O., Richet, P., 691
2006. Kinetics of iron redox reactions in silicate liquids: A high-temperature X-ray 692
absorption and Raman spectroscopy study. J. Nucl. Mater. 352, 190–195. 693
McMillan, P.F., 1984. Structural studies of silicate glasses and melts - Applications and 694
limitations of Raman spectroscopy. Am. Mineral. 69, 622–644. 695
Melson, W.G., O’Hearn, T., Jarosewich, E., 2002. A data brief on the Smithsonian Abyssal 696
Volcanic Glass Data File. Geochem. Geophys. Geosystems 3, 1–11. 697
https://doi.org/10.1029/2001GC000249 698
Mercier, M., Di Muro, A., Giordano, D., Métrich, N., Lesne, P., Pichavant, M., Scaillet, B., 699
Clocchiatti, R., Montagnac, G., 2009. Influence of glass polymerisation and oxidation 700
on micro-Raman water analysis in alumino-silicate glasses. Geochim. Cosmochim. 701
Acta 73, 197–217. https://doi.org/10.1016/j.gca.2008.09.030 702
Mercier, M., Muro, A.D., Métrich, N., Giordano, D., Belhadj, O., Mandeville, C.W., 2010. 703
Spectroscopic analysis (FTIR, Raman) of water in mafic and intermediate glasses and 704
glass inclusions. Geochim. Cosmochim. Acta 74, 5641–5656. 705
https://doi.org/10.1016/j.gca.2010.06.020 706
Métrich, N., Bertagnini, A., Garaebiti, E., Vergniolle, S., Bani, P., Beaumais, A., Neuville, 707
D.R., 2016. Magma transfer and degassing budget: Application to the 2009–2010 708
eruptive crisis of Mt Garet (Vanuatu arc). J. Volcanol. Geotherm. Res. 322, 48–62. 709
https://doi.org/10.1016/j.jvolgeores.2015.06.003 710
Morizet, Y., Brooker, R.A., Iacono-Marziano, G., Kjarsgaard, B.A., 2013. Quantification of 711
dissolved CO2 in silicate glasses using micro-Raman spectroscopy. Am. Mineral. 98,
712
1788–1802. https://doi.org/10.2138/am.2013.4516 713
Murphy, K.P., 2012. Machine Learning: A Probabilistic Perspective. The MIT Press, 714
Cambridge, Massachusetts. 715
Mysen, B.O., 1990. Role of Al in depolymerized, peralkaline aluminosilicate melts in the 716
systems Li₂ O-Al₂ O₃ -SiO₂ , Na₂ O-Al₂ O₃ -SiO₂ , and K₂ O-Al₂ O₃ -SiO₂ . Am. 717
Mineral. 75, 120–134. 718
Mysen, B.O., Finger, L.W., Virgo, D., Seifert, F.A., 1982. Curve-fitting of Raman spectra of 719
silicate glasses. Am. Mineral. 67, 686–695. 720
Mysen, B.O., Lucier, A., Cody, G.D., 2003. The structural behavior of Al3+ in peralkaline 721
melts and glasses in the system Na₂ O-Al₂ O₃ -SiO₂ . Am. Mineral. 88, 1668–1678. 722
Mysen, B.O., Richet, P., 2005. Silicate glasses and melts - Properties and structure, 723
Developments in geochemistry. Elsevier B.V., Amsterdam. 724
Neuville, D.R., Mysen, B.O., 1996. Role of aluminium in the silicate network: In situ, high-725
temperature study of glasses and melts on the join SiO2-NaAlO2. Geochim.
726
Cosmochim. Acta 60, 1727–1737. 727
O’Neill, H.S.C., Berry, A.J., Mallmann, G., 2018. The oxidation state of iron in Mid-Ocean 728
Ridge basaltic (MORB) glasses: implications for their petrogenesis and oxygen 729
fugacities. Earth Planet. Sci. Lett. 504, 152–162. 730
O’Neill, H.S.C., Jenner, F.E., 2012. The global pattern of trace-element distributions in ocean 731
floor basalts. Nature 491, 698–704. https://doi.org/10.1038/nature11678 732
Pedregosa, F., Varoquaux, G., Gramfort, A., Michel, V., Thirion, B., Grisel, O., Blondel, M., 733
Prettenhofer, P., Weiss, R., Dubourg, V., Vanderplas, J., Passos, A., Cournapeau, D., 734
Brucker, M., Perrot, M., Duchesnay, E., 2011. Scikit-learn: machine learning in 735
python. J. Mach. Learn. Res. 12, 2825–2830. 736
Perrone, M.P., 1993. Improving regression estimation: Averaging methods for variance 737
reduction with extensions to general convex measure optimization. Brown University 738
Providence, RI. 739
Roskosz, M., Toplis, M.J., Neuville, D.R., Mysen, B.O., 2008. Amorphous materials: 740
Properties, structure, and durability: Quantification of the kinetics of iron oxidation in 741
silicate melts using Raman spectroscopy and assessment of the role of oxygen 742
diffusion. Am. Mineral. 93, 1749–1759. https://doi.org/10.2138/am.2008.2861 743
Shannon, R.D., 1976. Revised effective ionic radii and systematic studies of interatomic 744
distances in halides and chalcogenides. Acta Crystallogr. A 32, 751–767. 745
https://doi.org/10.1107/S0567739476001551 746
Shea, T., Hellebrand, E., Gurioli, L., Tuffen, H., 2014. Conduit- to Localized-scale Degassing 747
during Plinian Eruptions: Insights from Major Element and Volatile (Cl and H2O)
748
Analyses within Vesuvius AD 79 Pumice. J. Petrol. 55, 315–344. 749
https://doi.org/10.1093/petrology/egt069 750
Smola, A. J., Schölkopf, B., 2004. A tutorial on support vector regression. Stat. Comput. 14, 751
199–222. 752
Tarantola, A., 2005. Inverse problem theory and methods for model parameter estimation. 753
Society for Industrial and Applied Mathematics, Philadelphia, PA. 754
Thomas, R., 2000. Determination of water contents of granite melt inclusions by confocal 755
laser Raman microprobe spectroscopy. Am. Mineral. 85, 868–872. 756
Thomas, R., Metrich, N., Scaillet, B., Kamenetsky, V.S., Davidson, P., 2008. Determination 757
of water in Fe-rich basalt glasses with confocal micro-Raman spectroscopy. Z. Für 758
Geol. Wiss. 36, 31–37. 759
Valderrama, L., Gonçalves, R.P., Março, P.H., Rutledge, D.N., Valderrama, P., 2016. 760
Independent components analysis as a means to have initial estimates for multivariate 761
curve resolution-alternating least squares. J. Adv. Res. 7, 795–802. 762
https://doi.org/10.1016/j.jare.2015.12.001 763
Vapnik, V. N., 1999. The Nature of Statistical Learning Theory, Second Edition. ed. 764
Springer-Verlag, New York. 765
Virgo, D., Mysen, B. O., Danckwerth, P., Seifert, F., 1982. Speciation of Fe3+ in 1-atm Na2
O-766
SiO2-Fe-O Melts. Carnegie Inst. Wash. Year b. 81, 349–353.
767
Virgo, D., Mysen, B.O., Kushiro, I., 1980. Anionic constitution of 1-Atmosphere silicate 768
melts: implications for the structure of igneous melts. Science 208, 1371–1373. 769
https://doi.org/10.1126/science.208.4450.1371 770
Wang, Z., Cooney, T.F., Sharma, S.K., 1995. In situ structural investigation of iron-771
containing silicate liquids and glasses. Geochim. Cosmochim. Acta 59, 1571–1577. 772
https://doi.org/10.1016/0016-7037(95)00063-6 773
Welsch, A.-M., Knipping, J.L., Behrens, H., 2017. Fe-oxidation state in alkali-trisilicate 774
glasses - A Raman spectroscopic study. J. Non-Cryst. Solids 471, 28–38. 775
https://doi.org/10.1016/j.jnoncrysol.2017.04.033 776
White, S.N., Kirkwood, W., Sherman, A., Brown, M., Henthorn, R., Salamy, K., Walz, P., 777
Peltzer, E.T., Brewer, P.G., 2005. Development and deployment of a precision 778
underwater positioning system for in situ laser Raman spectroscopy in the deep ocean. 779
Deep Sea Res. Part Oceanogr. Res. Pap. 52, 2376–2389. 780
https://doi.org/10.1016/j.dsr.2005.09.002 781
Zajacz, Z., Halter, W., Malfait, W.J., Bachmann, O., Bodnar, R.J., Hirschmann, M.M., 782
Mandeville, C.W., Morizet, Y., Müntener, O., Ulmer, P., Webster, J.D., 2005. A 783
composition-independent quantitative determination of the water content in silicate 784
glasses and silicate melt inclusions by confocal Raman spectroscopy. Contrib. 785
Mineral. Petrol. 150, 631–642. https://doi.org/10.1007/s00410-005-0040-9 786
Zakaznova-Herzog, V.P., Malfait, W.J., Herzog, F., Halter, W.E., 2007. Quantitative Raman 787
spectroscopy: Principles and application to potassium silicate glasses. J. Non-Cryst. 788
Solids 353, 4015–4028. https://doi.org/10.1016/j.jnoncrysol.2007.06.033 789
Zhang, H.L., Cottrell, E., Solheid, P.A., Kelley, K.A., Hirschmann, M.M., 2018. 790
Determination of Fe3+/ΣFe of XANES basaltic glass standards by Mössbauer 791
spectroscopy and its application to the oxidation state of iron in MORB. Chem. Geol. 792
479, 166–175. https://doi.org/10.1016/j.chemgeo.2018.01.006 793
794 795
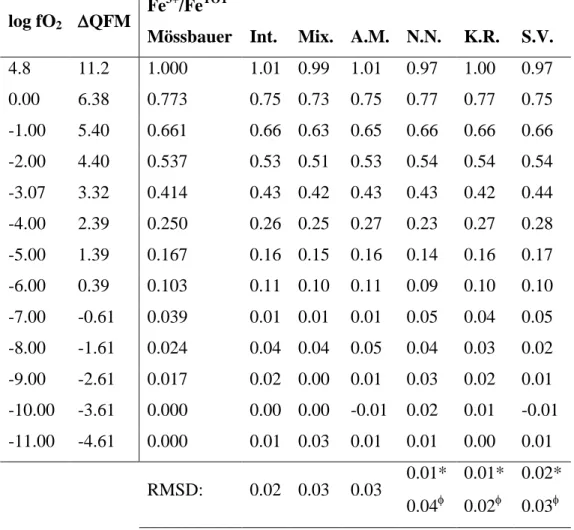
Table 1: Synthesis oxygen fugacity at 1400 ˚C, and relative to the quartz-fayalite-magnetite 796
(QFM) buffer, of MORB glass standards (Berry et al., 2018), together with the Fe3+/FeTOT 797
values determined by Mössbauer spectroscopy (± 0.01), and by Raman spectroscopy using 798
the Intensity (Int.), Mixing (Mix.), ALS MCR (A.M.), Neural Networks (N.N.), Kernel Ridge 799
(K.R.) and Support Vector (S.V.) techniques. Root-mean-squared deviations (RMSD, 1) of 800
the different Raman methods are indicated at the bottom; *calculated for the training data 801
subset; calculated for the testing data subset. 802
803
log fO2 QFM
Fe3+/FeTOT
Mössbauer Int. Mix. A.M. N.N. K.R. S.V. 4.8 11.2 1.000 1.01 0.99 1.01 0.97 1.00 0.97 0.00 6.38 0.773 0.75 0.73 0.75 0.77 0.77 0.75 -1.00 5.40 0.661 0.66 0.63 0.65 0.66 0.66 0.66 -2.00 4.40 0.537 0.53 0.51 0.53 0.54 0.54 0.54 -3.07 3.32 0.414 0.43 0.42 0.43 0.43 0.42 0.44 -4.00 2.39 0.250 0.26 0.25 0.27 0.23 0.27 0.28 -5.00 1.39 0.167 0.16 0.15 0.16 0.14 0.16 0.17 -6.00 0.39 0.103 0.11 0.10 0.11 0.09 0.10 0.10 -7.00 -0.61 0.039 0.01 0.01 0.01 0.05 0.04 0.05 -8.00 -1.61 0.024 0.04 0.04 0.05 0.04 0.03 0.02 -9.00 -2.61 0.017 0.02 0.00 0.01 0.03 0.02 0.01 -10.00 -3.61 0.000 0.00 0.00 -0.01 0.02 0.01 -0.01 -11.00 -4.61 0.000 0.01 0.03 0.01 0.01 0.00 0.01 RMSD: 0.02 0.03 0.03 0.01* 0.01* 0.02* 0.04 0.02 0.03 804 805
Figure 1: Raman spectra of synthetic MORB basaltic glasses; the colors indicate Fe3+/FeTOT. 806
Each spectrum corresponds to the mean of five spectra acquired for each sample. The dashed 807
lines labelled A-G mark the position of peaks and shoulders (see text). 808
809
810 811 812
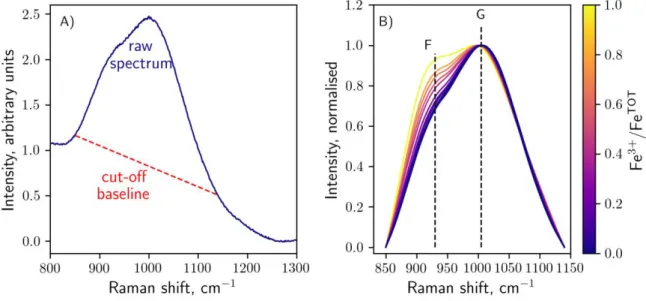
Figure 2: A) Example of the treatment of the 800-1300 cm-1 sections of the Raman spectra 813
that was performed prior to any calculation. The linear cut-off baseline (red dotted line) joins 814
the sample signals at 850 and 1140 cm-1. Any intensity below this baseline is removed from 815
the data. B) Intensity from 850-1140 cm-1 after baseline subtraction. This background 816
subtracted region of the spectra was normalised between 0 and 1. 817
818
819 820 821
Figure 3: Normalised intensity at 930 cm-1 in the Raman spectra of the glasses as a function 822
of the oxidation state of Fe. The line is a linear fit to the data. If not visible, errors are smaller 823
than the symbols. 824
825 826 827 828
Figure 4: A) Comparison of the mean spectrum at Fe3+/FeTOT = 0.41 (black line) and of fit 829
(dotted red line) as a linear combination of the oxidised (SOX) and reduced (SRED) spectra
830
(Mixing method); residuals between the data and fit are shown in the bottom panel. B) 831
Fraction of the oxidised endmember spectrum, FOX, as a function of the oxidation state of Fe
832
in the glasses. The line is a linear fit to the data. If not visible, errors are smaller than the 833 symbols. 834 835 836 837 838 839
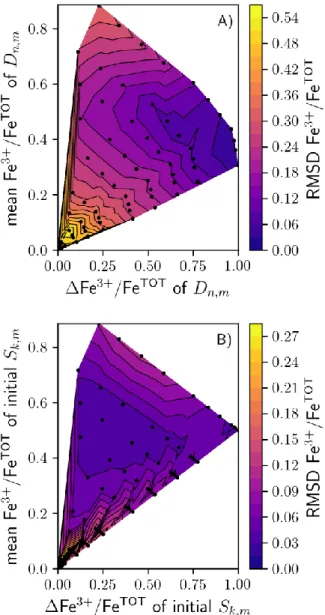
Figure 5: Results of the tests performed with the ALS MCR algorithm, using variable subsets 840
of (A) Dn,m and (B) initial Sk,m spectra. In (A), the root-mean-square deviations between the
841
predicted and measured Fe3+/FeTOT for the entire dataset, RMSD Fe3+/FeTOT, is represented as 842
a function of the mean and range of the Fe3+/FeTOT values of the subset of data. In (B), it is 843
represented as a function the mean and difference of Fe3+/FeTOT of the two initial S spectra. . 844
Black points show where calculations were made; lines and colors were obtained by 845 triangular interpolation. 846 847 848 849 850 851 852