HAL Id: hal-03183099
https://hal.archives-ouvertes.fr/hal-03183099
Submitted on 26 Mar 2021HAL is a multi-disciplinary open access archive for the deposit and dissemination of sci-entific research documents, whether they are pub-lished or not. The documents may come from teaching and research institutions in France or abroad, or from public or private research centers.
L’archive ouverte pluridisciplinaire HAL, est destinée au dépôt et à la diffusion de documents scientifiques de niveau recherche, publiés ou non, émanant des établissements d’enseignement et de recherche français ou étrangers, des laboratoires publics ou privés.
Molecular structure and ring tunneling of phenyl
formate as observed by microwave spectroscopy and
quantum chemistry
Lynn Ferres, Halima Mouhib, Wolfgang Stahl, Martin Schwell, Ha Vinh Lam
Nguyen
To cite this version:
Lynn Ferres, Halima Mouhib, Wolfgang Stahl, Martin Schwell, Ha Vinh Lam Nguyen. Molecular struc-ture and ring tunneling of phenyl formate as observed by microwave spectroscopy and quantum chem-istry. Journal of Molecular Spectroscopy, Elsevier, 2017, 337, pp.59-64. �10.1016/j.jms.2017.04.017�. �hal-03183099�
1
Molecular structure and ring tunneling of phenyl formate as
observed by microwave spectroscopy and quantum chemistry
Lynn Ferres,a Halima Mouhib,a,b Wolfgang Stahl,a Martin Schwell,c and Ha Vinh Lam Nguyen*c
a
Institute of Physical Chemistry, RWTH Aachen University, Landoltweg 2, D-52074 Aachen, Germany
b
Laboratoire Modélisation et Simulation Multi Echelle, MSME UMR 8208 CNRS, Université Paris-Est, 5 bd. Descartes, F-77454 Marne-la-Vallée, France
c
Laboratoire Interuniversitaire des Systèmes Atmosphériques (LISA), CNRS UMR 7583, Université Paris-Est Créteil, Université Paris Diderot, 61 avenue du Général de Gaulle, F-94010 Créteil cedex, France
* Corresponding author: Dr. Ha Vinh Lam Nguyen Email: [email protected]
2
Molecular structure and ring tunneling of phenyl formate as
observed by microwave spectroscopy and quantum chemistry
Phenyl formate has been investigated by molecular jet Fourier-transform microwave spectroscopy in the frequency range from 2 to 26.5 GHz. Quantum chemical calculations at the MP2/6-311++G(d,p) level of theory indicate that this molecule does not have a plane of symmetry at equilibrium, and that the phenyl ring performs a large amplitude tunneling motion from one side of the Cs configuration to the other. The tilt angle of the
ring out of the H(C=O)O plane is ±70° and the calculated tunneling barrier is only 28 cm–1. The two lowest torsional states vt = 0 and 1 are assigned in the experimental
spectrum and fitted using the program SPFIT/SPCAT. The Coriolis splitting E between these states is 46.2231(25) GHz, very close to the value of 48.24 GHz calculated using a simple two-top torsional Hamiltonian of the formate group and the phenyl ring.
3
1. Introduction
Phenyl formate (formic acid phenyl ester), H(C=O)OC6H5, with the structure illustrated in
Figure 1, is a molecule of chemical, biological, quantum chemical, and spectroscopic interest.
Chemically, phenyl formate belongs to the class of small esters, which are widely used in organic chemistry as a reagent for the formylation of amines [1]. In addition, small esters contain a number of common odorant molecules. Many of these have been the object of our microwave studies, e.g. in Refs. [2-4], with a view toward determining dynamical and/or conformational properties that might correlate with processes involved in the sense of smell. Phenyl formate itself has a typical aromatic smell. It has been suggested in the process of olfaction that odorants may be carried by transport proteins, so-called odorant binding proteins, which can contain aromatic amino acids in their binding pocket such as tryptophan, phenylanaline, and tyrosine [5]. These amino acids could bind molecules such as phenyl formate and other aromatic odorants via π-π interactions [6]. Although under physiological conditions, conformations of aromatic compounds could be totally unrelated to the gas phase, it is important to understand the structure and dynamic of the isolated ligand without any influences from the environment. This is helpful to improve and develop force fields which can then be used to study the molecular dynamics of biological processes at a molecular scale.
Quantum chemically, the relatively small empirical formula of C7H6O2 and the
well-known planarity of the phenyl ring [7] and the formate group [8-10] suggest that structure optimizations carried out for phenyl formate are within the capabilities of our computational resources. Because it is not always possible to determine microwave spectroscopic structures using the traditional method by isotopic substitutions, the support of quantum chemistry is indispensable, as ab initio structures can be taken as references for a comparison of the experimental and calculated molecular parameters. As mentioned above, the orientation of the phenyl group is important in many biological processes, but it is difficult to predict.
4
Whenever possible, we tend to assume a plane of symmetry, i.e. the phenyl group is located in the plane formed by the heavy atoms of the formate group. This is the situation found for many phenyl ring containing molecules investigated by microwave spectroscopy so far, such as anisole [11], phenetole [12], acetophenone [13], benzoyl fluoride [14], and benzaldehyde [15]. On the other hand, in some cases phenyl rings are reported to tilt out of the plane spanned by its neighboring heavy atoms, e.g. in cis formanilide [16,17] and acetanilide [18]. Such tilt angle of a molecule fragment is not always easy to believe when it is based on the rather modest quantum chemistry calculations carried out in experimental spectroscopic laboratories, as e.g. in our investigations on allyl acetate [19]. As the present study shows, the phenyl group is also tilted out of the H(C=O)O plane in phenyl formate.
Spectroscopically, phenyl formate is a derivative of formic acid, where the proton in the acid group has been replaced by the much heavier phenyl group. When starting this work, we expected the spectrum of phenyl formate to be essentially that of a rigid-rotor with centrifugal distortion correction. However, as we shall see below, this simple rigid-rotor expectation turned out to be completely incorrect.
2. Quantum Chemical Calculations
All calculations were carried out at the MP2/6-311++G(d,p) level of theory with the
GAUSSIAN program package [20]. For a conformational analysis, we varied the dihedral
angles α = (C13,O12,C3,C2) and β = (H14,C13,O12,C3) in a grid of 10° (for atom numbering
see Figure 1), corresponding to the rotation of the phenyl ring about the O12C3 bond and the
rotation of the formyl group HC=O about the C13O12 bond, respectively. The
two-dimensional potential energy surface (2D-PES) depending on and revealed two stable conformers; each of which appears as four equivalent minima. Because of the planarity of both the phenyl ring and the formyl group, the geometries represented by (,), (+180°,),
5
(,), and (180°,) have the same potential energy, and only a quarter of the full 2D-PES calculations are necessary. The calculated energies were parameterized using a 2D Fourier expansion based on terms with the correct symmetry of the angles and . The coefficients from this parameterization are given in Table S-1 in the supplementary material. Using these Fourier coefficients, the 2D-PES was drawn as a contour plot illustrated in Figure 2.
If is increased from 0° to 360° along the vertical lines at = 0° or 180°, a series of four minima is found lying alternating slightly above and below the = 90° and = 270° lines. The trans conformer (conformer I), lying close to the = 180° line, can be found in four different versions, Ia (α = 70.3, = 180.5°), Ia* (α = 109.7, = 179.5°), Ib (α = 250.3,
= 180.5°), and Ib* (α = 289.7, = 179.5°) on the PES. The closer lying adjacent minima
(Ia/Ia* and Ib/Ib* with α = 39.4°) are enantiomers, which are separated by a lower barrier of
about 28 cm1, while the minima Ia/Ib and Ia*/Ib* with α = 180 arising from the 180°
rotation of the phenyl ring are separated by a higher barrier of 726 cm1. This situation is depicted in Figure 3, where a one-dimensional “cut” along = 180° of the PES is plotted. This cut is calculated by varying from 0° to 360° at a starting value of = 180°, while all molecular geometry parameters including are optimized. The coefficients from this potential curve are given in Table S-2. All four versions of conformer I are shown in Figure 1. From a microwave spectroscopic point of view, they are identical and possess the same rotational constants. The geometry of conformer Ia is subsequently re-optimized under full
geometry optimization, resulting in the rotational constants A = 3805.6 MHz, B = 1186.5 MHz, and C = 1039.9 MHz, and dipole moment components μa = 0.6 D, μb = −0.7 D, and μc =
−1.3 D (in the principal axis system). The Cartesian coordinates are given in Table S-3 in the supplementary material.
6
Figure 1: Four energetically equivalent minima of the most stable trans conformer I of phenyl formate. The structures were optimized at the MP2/6-311++G(d,p) level of theory. The dihedral angles α = (C13,O12,C3,C2) are given. Note that the pairs Ia/Ia* and Ib/Ib* are enantiomers, while Ia and Ib as well as Ia* and Ib* can be transformed into each other by a rotation of 180° of the phenyl ring.
Figure 2: The potential energy surface of phenyl formate calculated at the MP2/6-311++G(d,p) level of theory depending on the dihedral angles α = (C13,O12,C3,C2) and β = (H14,C13,O12,C3). The color code indicates the energy (in per cent) relative to the energetically lowest conformations with Emin = 419.7514621 Hartree (0%).
The energy maximum (100%) is Emax = 419.7327553 Hartree.
7
Figure 3: A one-dimensional “cut” of the potential surface in Figure 2 along the vertical line at = 180° calculated by varying the dihedral angle from 0° to 360° at a starting value of = 180°. All molecular geometry parameters including are optimized at the MP2/6-311++G(d,p) level of theory. The closer lying adjacent minima (with α 40) are separated by a lower barrier of about 28 cm1, while the minima Ia/Ib and Ia*/Ib* (with α = 180) arising from the 180° rotation of the phenyl ring are separated by a higher barrier of 726 cm1.
The dihedral angle α of the minima in Figure 1 is not 0° as expected for Cs symmetry, i.e.
the phenyl ring does not share a plane of symmetry with the H(C=O)O frame. The tilt angle is ±70°, resulting in double minimum potentials within the regions = (60°120°) and (240°300°) (see also Figure 3). A similar tilt angle out of the (C=O)O plane was found for the isopropenyl group in isopropenyl acetate [21]. Another molecule with a double minimum potential is cis-formanilide. The phenyl group is rotated by 35° out of the plane containing the pseudo-peptidic group. The barrier to planarity is 152 cm1 [16]. A further example is acetanilide, which exists simultaneously as a planar and planar conformation. The non-planar compound has a phenyl ring tilted by 59° out of the C(C=O)N plane, with almost exactly the same tunneling barrier of 151 cm1 [18] as in the case of cis-formanilide.
The barriers of 28 cm1 separating Ia and Ia* as well as Ib and Ib* are very small compared
to those found in cis-formanilide and acetanilide. Tunneling of the phenyl ring is therefore very probable. In spite of these quantum chemistry indications of tunneling trouble, we still
8
began our spectroscopic analysis, as described in Section 3, under the assumption that this effect could be completely ignored because of the weight of the phenyl ring. When all attempts at obtaining a good rigid-rotor fit for the spectral measurements failed, we looked again at our quantum chemistry calculations. This will be discussed in detail in Section 3 and 4.
The cis conformer (conformer II), lying along the = 0° line, can also be found in four different versions IIa (α = 57.9, = 5.7°), IIa*(α = 122.2, = 354.3°), IIb (α = 237.9, =
5.7°), and IIb* (α = 302.2, = 354.3°) on the PES with similar value as that of conformer I
for each version. The geometry of conformer IIa is re-optimized under full geometry
relaxation, resulting in the rotational constants A = 4.8859 GHz, B = 0.9782 GHz, and
C = 0.8438 GHz, dipole moment components a = −4.53 D, b = 0.82 D, and c = 1.37 D, and
(,) = (60.5°, 5.6°). It is noteworthy that these angles are slightly different from those obtained from the 2D-PES. The Cartesian coordinates are also given in Table S-3 in the supplementary material. The cis conformer is much higher in energy than the trans conformer (7.96 kJ/mol). This is in agreement with the results from our previous investigations on esters [22-24]. Therefore, we do not expect to observe this conformer under our molecular jet conditions, where the rotational temperature is very low (approximately 2 K), and only focus on the trans conformer in what following. Notably, we define trans conformations as in Figure 1, where the phenyl group is in trans position to the proton of the formate group.
3. Microwave spectroscopy 3.1. Measurement
For all measurements we used a molecular jet Fourier transform microwave spectrometer operating in the frequency range from 2 to 26.5 GHz [25]. Phenyl formate with a purity of 95% was purchased from Alfa Aesar, Kandel, Germany, and used without further purification. The substance was soaked on a pipe cleaner as carrier material, which was
9
inserted close to the nozzle. A helium stream with a pressure of 3 bar was flown over the sample and the resulting phenyl formate-helium mixture was expanded through a pulsed nozzle into the vacuum chamber.
The measurements were carried out first in a rapid scan mode between 8 and 16 GHz, where overlapping spectral segments were recorded with a step size of 0.25 MHz and 50 coadded decays for each spectrum. All lines from the scans were remeasured at higher resolution, where they appear as doublets due to the Doppler effect. The average value of all line widths is 20 kHz; the measurement accuracy is therefore 2 kHz.
3.2. Spectral assignment of the ground state vt = 0
The calculated dipole moment components of the trans conformer given in Section 2 suggest that all a-, b-, and c-type transitions are present in the microwave spectrum. We first searched for a-type transitions in the broadband scan using a theoretical rigid-rotor spectrum predicted with the rotational constants also given in Section 2, because these transitions follow typical patterns which can be often recognized readily. Some lines following a-type selection rules could be easily identified. The first fit attempts were made with the program XIAM in its rigid-rotor mode [26]. Surprisingly, the assigned transitions could not be fitted well and the root-mean-square (rms) deviation was up to 3 MHz. Including the quartic centrifugal distortion constants in the fit did not decrease the rms deviation, and these parameters could not be determined well. This is strange, because rms deviations close to measurement accuracy can often be achieved in the fits of other rigid-rotor molecules [27-30]. Because of the typical a-type pattern in the microwave spectrum, we were quite confident that these assignments were correct. Using the rotational constants of the preliminary fit, we were able to assign also b- and c-type transitions by comparing the predicted and experimental spectrum. However, all attemps to reduce the rms deviation failed.
10
As mentioned in Section 2, it is very probable that some state other than the ground state is populated in our 2 K molecular jet, which comes from the effect of ring tunneling. The primary support for the existence of a low-lying state just above the vt = 0 ground state is the
fact that after a thorough assignment of recorded lines, a considerable number of transitions remained unassigned in the spectrum. They are much weaker than the assigned transitions, but on the other hand already quite strong that they are unlikely from the 13C isotopologues. This low-lying state would then be a plausible candidate for a perturbation partner of the ground state. Assuming good thermal equilibrium in the jet, the intensity of the lines from this extra state suggests that it lies only about 10 cm−1 above the ground state, which in turn suggests that it is some tunneling component arising from the phenyl ring. We thus decided to calculate the eigenvalues of the four lowest energy levels that would occur from our potential energy curve given in Figure 3 in an attempt to determine whether this assumption is correct.
3.3. Calculations of low-lying tunneling states
The torsion of the phenyl ring against the formate group might cause low-lying excited torsional states which could be observed in the experiment. In order to estimate the energy separation between the vt = 0 and 1 states and the ratio of the population numbers of both
states under our experimental conditions, we made a simple model of two rigid tops rotating against each other.
We used the Hamiltonian (in cm1 units)
𝐻̂ = −𝐹 𝑑
2
𝑑𝛼2+ 𝑉0+ ∑ 𝑉2𝑛cos 2𝑛𝛼 7
𝑛=1
with the effective torsional constant 𝐹 =8𝜋ℎ2𝐼𝑐 = 0.35101 cm1. Here, c is the speed of light
and 𝐼 =𝐼𝐼𝑝𝐼𝑓
𝑝+𝐼𝑓= 48.027 uÅ
2 the effective moment of inertia calculated from the moments of
11
of them refer to a rotation about the common torsional axis O12C3 by the dihedral angle α.
For the potential terms V2, V4, …, V14 we use the values 341.00, 115.29, 4.15, 10.03, 2.68,
3.27, and 0.53 cm1, respectively, derived from the parameterized potential curve given in Figure 3. The potential offset was chosen to be V0 = 247.79 cm1, so that all potential minima
are located at 0 cm1. The energy eigenvalues were obtained by a direct diagonalization of the Hamilton matrix set up in the plane wave basis 𝜓𝑚 = √2𝜋1 𝑒𝑖𝑚𝛼 with m {0, 1, 2, …}. The
matrix was truncated at |𝑚| = 50, corresponding to a size of 101101, where convergence for the lowest energy levels in the kHz range was achieved.
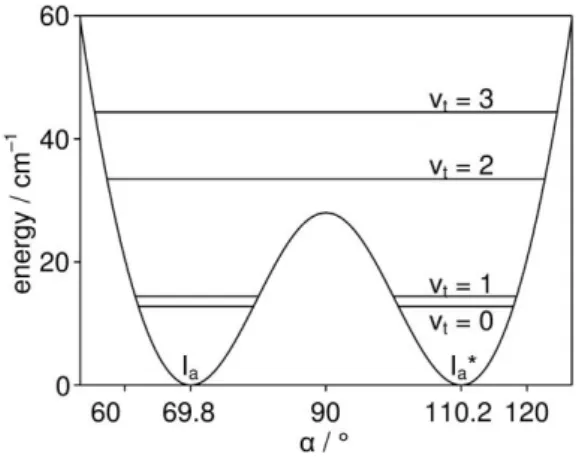
The lowest energy levels are at 12.819 (0), 14.429 (1), 33.484 (2), and 44.344 cm1 (3); all of them doubly degenerate. The torsional vt quantum numbers are given in
parentheses. The degeneracy arises from the fact that the potential function consists of a pair of double minimum potentials (see Figure 3) separated from each other by high potential walls of 726 cm1. No tunneling across these walls is observed and the energy levels remain degenerated. The potential functions in the range from 55 to 125° along with the lowest torsional levels are shown in Figure 4.
Figure 4: An enlargement in the range of 55 to 125° of the potential energy curve given in Figure 3, describing the torsion of the phenyl ring against the formate group by varying the angle . Horizontal lines indicate the lowest torsional energy levels vt = 0, 1, 2, 3, which are doubly degenerated.
12
The vt : 1-0 difference is only 1.610 cm1 or 48.24 GHz. This enables us to estimate the
N1/N0 population ratio using the Boltzmann distribution 𝑁1
𝑁0 = exp (−
Δ𝐸
𝑘𝑇) with the Boltzmann
constant k and the temperature T. If we assume that the torsional temperature is in the same temperature range of 1 2 K as the rotational temperature in our jet, the estimated population of the excited state vt = 1 is from 9.9 to 31.4 % with respect to the ground state vt = 0.
3.4. Fits of the ground state vt = 0
At this point, it is convincing that the low-lying vt = 1 tunneling state is still populated in the
jet-cooled spectrum that perturbs the ground state spectrum. We thus switched to the program
SPFIT/SPCAT [31], available at the PROSPE website [32], which allows the user to choose
Coriolis interaction terms for use in the fitting Hamiltonian. This feature allowed us to experiment with a number of tunneling parameters and centrifugal distortion corrections. At the beginning, the SPFIT/SPCAT program did not provide a better rms deviation than the
XIAM program (close to 3 MHz). However, with gradually increasing number of parameters,
especially by including the tunneling parameters E, EJ, Fbc, Fac, and five sextic centrifugal
distortion constants, among them the momentum cross terms Fbc and Fac were essential to
improve the fit, the situation improved. Molecular parameters were determined more accurately and rms deviation decreased to 3.7 kHz in a fit including 111 vt = 0 rotational
transitions with J ≤ 13 and Ka ≤ 2. The fitted parameters of this fit are given as Fit 0, Ka ≤ 2 in
Table 1.
Including eleven a-type R-branch lines with Ka = 3 and six further transitions with J 10
in the fit increased the rms deviation to 14.8 kHz. The fitted parameters of this fit consisting of 128 lines are also collected as Fit 0, Ka ≤ 3 in Table 1. A list of all fitted transitions is given
in Table S-4; the Ka = 3 lines are marked by asterisks. Attemps to improve the situation for
13
3.5. Global fits of the vt = 0 and vt = 1 states
After the vt = 0 transitions were reasonably fitted using the program SPFIT/SPCAT, we found
that many weaker lines with intensity of about 1/5 to 1/10 are located close to the most intense vt = 0 lines (see Figure 5). From our previous investigation on pinacolone [33], we know that
the low-lying vt = 1 excited state, if still populated in the jet-cooled spectrum, is not far
separated from the ground state. From the intensity calculations described in Section 3.3., the intensity of those weaker lines is in the correct order of magnitude as that predicted from the calculations. Therefore, we tried to assign these lines to the vt = 1 excited state transitions of
the same quantum numbers as those of the closest neiboring intense lines and could identify 33 lines. The global fit including 128 ground state vt = 0 lines and 33 vt = 1 lines has a rms
deviation of 54.5 kHz. We used the effective Hamiltonian
𝐻 = ∑ |𝑣⟩(𝐻𝑟𝑣+ 𝐻∆𝑣)⟨𝑣| + (|0⟩⟨1| + |1⟩⟨0|)𝐻𝑐 1
𝑣=0
where |0⟩ and |1⟩ represent the symmetric and the antisymmetric torsional state, respectively. The operator 𝐻𝑟𝑣 = 𝐴𝑣𝐽𝑎2+ 𝐵𝑣𝐽𝑏2+ 𝐶𝑣𝐽𝑐2 − ∆𝐽,𝑣𝐽4− ∆ 𝐽𝐾,𝑣𝐽2𝐽𝑎2− ∆𝐾,𝑣𝐽𝑎4− 𝛿𝐽,𝑣𝐽2(𝐽+2 + 𝐽−2) −12𝛿𝐾,𝑣[𝐽𝑎2, (𝐽+2 + 𝐽−2)]+ + 𝐻𝐽,𝑣𝐽6+ 𝐻 𝐽𝐾,𝑣𝐽4𝐽𝑎2 + 𝐻𝐾𝐽,𝑣𝐽2𝐽𝑎4+ 𝐻𝐾,𝑣𝐽𝑎6+ ℎ𝐽,𝑣𝐽4(𝐽+2+ 𝐽−2) +12ℎ𝐽𝐾,𝑣𝐽2[𝐽𝑎2, (𝐽+2+ 𝐽−2)]+
with 𝐽±= 𝐽𝑏± 𝑖𝐽𝑐 and the anti-commutator [… , … ]+ includes the overall rotation and the
quartic and sextic centrifugal distortion terms of Watson’s A reduction in the Ir representation.
The rotational constants as well as the quartic and sextic centrifugal distortion constants depend on the torsional state v.
The torsional splitting between the |0⟩ and the |1⟩ energy levels and its J dependence is expressed by the operator
𝐻∆𝑣 = 𝑣(𝐸 + 𝐸 𝐽𝐽2).
Finally, the Coriolis operator connecting the |0⟩ and the |1⟩ torsional state is given by 𝐻𝑐 = 𝐺𝑎𝐽𝑎+ 𝐺𝑏𝐽𝑏
+𝐹𝑎𝑐(𝐽𝑎𝐽𝑐 + 𝐽𝑐𝐽𝑎) + 𝐹𝑏𝑐(𝐽𝑏𝐽𝑐 + 𝐽𝑐𝐽𝑏) +𝐹𝑎𝑐𝐾𝐽𝑎2(𝐽
14
The fitted molecular parameters are summerized as Fit 01 in Table 1 and in Table S-5 in the supplementary material. The frequencies along with their residues are collected in Table S-4 and S-6. It is remarkable that a nearly complete set of quartic and sextic centrifugal distortion constants are needed separately for the excited state in spite of the very limited number of lines in the fit. Including more parameters did not help to reduce the rms deviation.
4. Discussion
The ground state fit including 128 lines given as Fit 0 in Table 1 has a rms deviation of 14.8 kHz. This deviation, which is seven times the measurement accuracy, is already quite succesful comparing to the fit using only a rigid-rotor model. The key parameters are Fbc and
Fac, which are associated with the vt-off-diagonal matrix elements of the operators {Jb,Jc} and
{Ja,Jc}, respectively, with their large values of –33.6 and 163.3 MHz. The Coriolis splitting
ΔE of 43.4233(80) GHz is quite close to the estimated value of 48.27 GHz (see Section 3.4). Though the fitted value of ΔE in the global Fit 01 is even closer to the calculated one, the rms deviation of 54.5 kHz of this fit is unreasonably large comparing to the measurement accuracy of 2 kHz or to that of the ground state Fit 0. A large number of centrifugal distortion constants are needed for the fit, which is quite unusual for a fit of only low-J and K transitions (i.e. J ≤ 13, Ka ≤ 3). The difference between the rotational constants A, B, and C of the ground
and the excited state is remarkable. Also almost all centrifugal distortion constants are in different orders of magnitude. In other molecules, where similar tunneling problems were reported, e.g. benzyl alcohol [34], cis-formanilide [16], and acetanilide [18], these differences found for the rotational constants were less significant, and the same set of centrifugal distortion constants could be used for both states.
We believe that all these problems arise because the tunneling motion of phenyl format is not correcty captured by the present set of fitted parameters and because of the
15
limited number of excited state lines, the relatively low tunneling barrier, as well as the large tilt angle of the phenyl ring (see Section 2). Assigning and including more lines of the vt = 1
excited state might improve the fit quality. However, the measurements of these transitions under our jet-cooled conditions are rather limited because of the low line intensity and yet unreliable prediction. After excluding all assigned vt = 0 and vt = 1 lines, no intense lines
remained in the broadband scan, as shown in Figure 5.
Figure 5: Left hand side: A section from 8 16 GHz of the broadband scan (upper trace) of phenyl formate
compared to the theoretical spectrum reproduced with the SPFIT/SPCATprogram (lower trace). Transitions of
the vt = 0 ground state are marked in blue, those of the vt = 1 excited state in red. Right hand side: A section from 12.1 – 12.4 GHz of the broadband scan showing the vt = 0 and vt = 1 components of the 413 303 transition with a torsional splitting of 62 MHz.
References
[1] H. Yale, J. Org. Chem. 36 (1971) 3238.
[2] H. Mouhib, D. Jelisavac, L.W. Sutikdja, E. Isaak, W. Stahl, J. Phys. Chem. A 115 (2011) 118.
[3] L. Sutikdja, W. Stahl, V. Sironneau, H.V.L. Nguyen, I. Kleiner, Chem. Phys. Lett. 663 (2016) 145.
[4] L.W. Sutikdja, D. Jelisavac, W. Stahl, I. Kleiner, Mol. Phys. 110 (2012) 2883. [5] S. Firestein, Nature 413 (2001) 211.
16
[6] K. Herrmann, Alkaloidhaltige Genussmittel, Gewürze, Kochsalz, Springer (1979) 632. [7] D. Moran, A.C. Simmonett, F.E. Leach, W.D. Allen, P.v.R. Schleyer, H.F. Schaefer, J. Am. Chem. Soc. 128 (2006) 9342.
[8] R. F. Curl, J. Chem. Phys. 30 (1959) 1529.
[9] W. Pyckhout, C.V. Alsenoy, H.J. Geise, J. Mol. Struct. 147 (1986) 85.
[10] G.I.L. Jones, D.G. Lister, N.L. Owen, J. Chem. Soc. Faraday Trans. 2, 71 (1975) 1330. [11] M. Onda, A. Toda, S. Mori, I. Yamaguchi, J. Mol. Struct. 144 (1986) 47.
[12] L. Ferres, W. Stahl, H.V.L. Nguyen, Mol. Phys. 114 (2016) 2788.
[13] M. Onda, Y. Kohama, K. Suga, I. Yamaguchi, J. Mol. Struct. 442 (1998) 19. [14] R.K. Kakar, J. Chem. Phys. 56 (1972) 1189.
[15] R.K. Kakar, E.A. Rinehart, C.R. Quade, T. Kojima, J. Chem. Phys. 52 (1970) 3803. [16] S. Blanco, J.C. Lopez, A. Lesarri, W. Caminati, J.L. Alonso, Mol. Phys. 103 (2005) 1473.
[17] J.-R.A. Moreno, D. Petitprez, T.R. Huet, Chem. Phys. Lett. 419 (2006) 411.
[18] C. Cabezas, M. Varela, W. Caminati, S. Mata, J.C. López, J.L. Alonso, J. Mol. Spectrosc. 268 (2011) 42.
[19] H.V.L. Nguyen, H. Mouhib, W. Stahl, I. Kleiner, Mol. Phys. 108 (2010) 763.
[20] M.J. Frisch, G.W. Trucks, H.B. Schlegel, G.E. Scuseria, M.A. Robb, J.R. Cheeseman, G. Scalmani, V. Barone, B. Mennucci, G.A. Petersson, H. Nakatsuji, M. Caricato, X. Li, H.P. Hratchian, A.F. Izmaylov, J. Bloino, G. Zheng, J.L. Sonnenberg, M. Hada, M. Ehara, K. Toyota, R. Fukuda, J. Hasegawa, M. Ishida, T. Nakajima, Y. Honda, O. Kitao, H. Nakai, T. Vreven, J.A. Montgomery, Jr., J.E. Peralta, F. Ogliaro, M. Bearpark, J.J. Heyd, E. Brothers, K.N. Kudin, V.N. Staroverov, R. Kobayashi, J. Normand, K. Raghavachari, A. Rendell, J.C. Burant, S.S. Iyengar, J. Tomasi, M. Cossi, N. Rega, J.M. Millam, M. Klene, J.E. Knox, J.B. Cross, V. Bakken, C. Adamo, J. Jaramillo, R. Gomperts, R.E. Stratmann, O. Yazyev, A.J. Austin, R. Cammi, C. Pomelli, J.W. Ochterski, R.L. Martin, K. Morokuma, V.G. Zakrzewski,
17
G.A. Voth, P. Salvador, J.J. Dannenberg, S. Dapprich, A.D. Daniels, O. Farkas, J.B. Foresman, J.V. Ortiz, J. Cioslowski and D.J. Fox, Gaussian 09, Revision A.02, Gaussian, Inc., Wallingford CT, 2009.
[21] H.V.L. Nguyen, W. Stahl, J. Mol. Spectrosc. 264 (2010) 120.
[22] D. Jelisavac, D.C. Cortés Gómez, H.V.L. Nguyen, L.W. Sutikdja, W. Stahl, I. Kleiner, J. Mol. Spectrosc. 257 (2009) 111.
[23] H.V.L. Nguyen, A. Jabri, V. Van, W. Stahl, J. Phys. Chem. A 118 (2014) 12130.
[24] A. Jabri, V. Van, H.V.L. Nguyen, W. Stahl, I. Kleiner, ChemPhysChem 17 (2016), 2660. [25] J.-U. Grabow, W. Stahl, H. Dreizler, Rev. Sci. Instrum. 67 (1996) 4072.
[26] H. Hartwig, H. Dreizler, Z. Naturforsch. 51a (1996) 923.
[27] V. Van, C. Dindic, W. Stahl, H.V.L. Nguyen, ChemPhysChem 16 (2015) 291.
[28] R. Kannengießer, W. Stahl, H.V.L. Nguyen, W.C. Bailey, J. Mol. Spectrosc. 317 (2015) 50.
[29] V. Van, W. Stahl, H.V.L. Nguyen, J. Mol. Struct. 1123 (2016) 24.
[30] R. Kannengießer, W. Stahl, H.V.L. Nguyen, J. Phys. Chem. A 120 (2016) 5979. [31] H.M. Pickett, J.Mol. Spectrosc. 148 (1991) 371.
[32] http://www.ifpan.edu.pl/~kisiel/prospe.htm.
[33] Y. Zhao, H.V.L. Nguyen, W. Stahl, J.T. Hougen, J. Mol. Spectrosc. 318 (2015) 91. [34] K.A. Utzaz, R.K. Bohn, J.A. Montgomery Jr, H.H. Michels, W. Caminati, J. Phys. Chem. A 114 (2010) 6913.
Acknowledgements
We thank the Land Nordrhein-Westfalen and the Université Paris-Est Créteil for funds as well as the IT Center of the RWTH Aachen University for free computing time. H.M. thanks the Excellence Initiative grants of the German federal and state governments (StUpPD_209_15).
18
Tables
Table1. Molecular parameters of phenyl formate from the fits using the SPFIT/SPCAT program and from quantum chemical calculations.
Par.a Unit Fit 0 Fit 0 Fit 01 Calc.
b Ka ≤ 2 Ka ≤ 3 vt = 0 vt = 1 A MHz 3848.257(68) (12) 3838.160(12) 3899.83(22) 3836.97(22) 3733.074 B MHz 1167.241(86) 1157.037(12) 1181.770(24) 1161.371(17) 1188.168 C MHz 1045.998(94) 1034.813(15) 1047.539(11) 1045.8128(99) 1058.306 ΔJ kHz 0.299(19) 0.8837(38) 1.9010(34) 14.5174(69) 0.2530 ΔJK MHz 0.2352(33) 0.10513(31) 0.70918(59) 0.48479(62) 0.002649 ΔK MHz 1.326(23) 0.9830(37) 3.3248(30) 2.086(16) 0.0004919 δJ kHz 1.521(68) 1.5880(14) 1.3566(32) 3.4393(22) 0.04523 δK kHz 572.8(38) 288.5(11) 65.83(39) 1.08(51) 0.1168 HJ Hz 5.693(29) 9.1462(96) 0.149910–3 HJK kHz 0.6045(68) 0.36501(35) 0.90338(81) -0.7635(44) 0.802810–4 HK MHz 0.3113(52) 0.21843(77) 0.57522(69) 0.4811(30) 0.310610–6 HKJ kHz 0.01457(25) 1.6060(55) 41.872(42) 34.950(69) 0.390810–3 hJ Hz 3.9443(24) 0.132510–3 hJK kHz 0.6214(49) 1.2453(12) 3.5970(14) 0.330110–4 E GHz 33.651(97) 43.4233(80) 46.2231(25) 48.27c EJ MHz 6.031(89) 16.670(12) Fbc MHz 21.70(19) 34.562(16) 34.3872(95) Fac MHz 158.034(91) 163.335(30) 168.201(19) FbcK MHz 1.8247(22) FacK MHz 3.8755(32) Ga GHz 1.3164(38) Gb GHz 0.64351(67) Nd 111 128 128 33 rmse kHz 3.7 14.8 54.5 54.5
a All parameters refer to the principal axis system.Watson’s A reduction and Ir representation
were used. b Anharmonic frequency calculations at the MP2/6-311++G(d,p) level of theory. The rotational constants are the B0 ground state constants and are different from the Be
equilibrium constants given in Section 2. c See Section 3.4. d Number of lines. e Root-mean-square deviation of the fit.