l\feasured IQ Related to Teacher-Estimated
Intelligence:
An Exploration in Bias*
Eigil Pedersen
ABSTRACT
By comparing the teacher-estimated intelligence to the meas-ured IQs of high school students, this study finds that teachers tend to overestimate the IQ of working class boys, and to under-estimate the IQ of girls, regardless of their socio-economic status.
INTRODUCTION
It has often been observed that intelligence tests discriminate against children of lower socio-economic status (SES). Charters relates that intensive efforts have been made in attempts to pro duce culture-fair intelligence tests, but with only little success so far. However, "the work ... helped to remove the bias, if not from tests, at least from the test-users in the education profession. Hl One as-sumption that may possibly be inherent in this statement is that although tests are culture-biased, teachers, being culture-fair, can make better, less biased estimates of intelligence. Such an assump-tion is open to quesassump-tion. Perhaps teachers are also culturally biased
*
This paper reports findings of a preliminary analysis made with a sub-sample of data from a larger study which is nearing completion. For financial assistance in the research, the writer is indebted to the Prov-ince of Quebec, the Canada Council, the Milton Fund of Harvard Uni-versity, and the Harvard University Center for Research and Develop-ment on Educational Differences. Technical assistance in the selection of the sam pIe, which was provided by the Department of Planning of the Quebec Department of Education, is also gratefully acknowledged.Eigil Pedersen 13
but their biases may be different from those of intelligence tests. To the writer's knowledge, this problem has not yet been investig-ated.
It has been argued that school work is better suited to the in-terests and abilities of girls than of boys. For example, Hall and McFarlane have concluded from sorne of their Canadian research that most school practices and programmes are arranged in favour of girls, and to the detriment of the educational and occupational careers of( boYS.1 In this sense, sex is a cultural dimension, and ap-pears to be subject to bias just as SES is.
Why is cultural bias in the measurement or estimation of in-telligence important? Several reasons come to mind. For one thing, streaming and grouping practices often take into consideration the intelligence of the children involved, and if there is any positive value in streaming or grouping, then there must be negative value in being placed in the inappropriate stream or group through biased, and therefore inaccurate, measures or estimates of intelligence. But in the writer's opinion, a far more important issue is that the self-concept of the child is at stake. Brookover et al. have demonstrated that, even holding IQ constant in the analysis, where students have a high academic self-concept, their actual school performance as measured by grades is higher than that of students who have low self-concept.3 Pedersen has shown that, holding IQ constant,
stu-dents with high academic self-concept have more ambitious plans for future education than students with low self-concept.4 Both
investigators have presented evidence that the teacher has a signif-icant impact on the level of academic self-concept of the student, and can depress or elevate the self-concept, probably through com-binations of certain actions, gestures, verbal comments, or other cues through which the student perceives the teacher's opinion of his (the student's) ability to do school work. The impact of the teacher on the self-concept of the student is important because of the subsequent effect of the self-concept on levels of academic per-formance and of educational aspiration.
THE PROBLEM INVESTIGATED
The problem investigated in this paper is as follows: In making estimates of IQ, to what extent are teachers biased in favour of, or against, pupils of different SES, of different sex, and of different combinations of SES and sex?
PROCEDURE
In the spring of 1965, 6465 pupils and their teachers in the eighth and tenth grades of thirty-seven high schools in rural, suburban, and urban areas of the Province of Quebec answered questionnaires related in part to a study concerning social factors associated with the level of educational aspiration. Use was made of this opportunity to collect data relevant to other research prob-lems as weIl, one of which is the subject of this paper.
The variables used in this paper - IQ (both measured and estimated), the sex of the student, the SES of the student - were an obtained from teacher-responses to the questionnaire.
The questions and response categories were as follows:
Sea: The sex of this student is A. male
B. female
IQ The IQ of the student. In answering this question, it is understood that where the actually measured IQ scores are missing, estimating scores will be hazar-dous at best. But since these scores or estimates will be used for group analysis only - no judgments about individuals will be made - they will still be very useful for the purposes of this research. ,so please, even if your estimate runs the risk of being very wild, please make your best guess. If a meas-ured score is at hand, Use it; if more than one is available, use the Most recent. And if no score is convenient, use the adjective checklist below to help you to estimate. A. 72 or lower B. 73 - 80 C. 81-SS D. 89 - 96 E. 97 -104 F. 105-112 G. 113 -120 H. 121-128 1. 129 -136 J. 137 or higher very dull dull below average
slightly below average average
slightly above average above average
weIl above average much above average gifted
Give the source of your IQ score for this student. A. measured individual test
Eigil Pedersen
B. measured group test
C. measured nature of test not known D. estimated
SES Where would you rank this student's family in terms of social cIass leveI?
A. upper cIass, or upper Middle cIass B. Middle class
C. working class.
15
Of the entire sample, estimated IQs were obtained for 3159 students, and measured IQs for 3304 students. However, since pre-liminary analyses indicated that there were systematic differences in other pupiI characteristics associated with whether measured IQs were avaiIable (they generally were for urban schools, but not for rural ones), this paper makes use of data only from the ten schools in which approximately half the IQs reported were estimated, and the other half measured, thus limiting variation in the two main subsamples with respect to other social variables that might be re-lated to levels of intelligence. In addition, those few students for whom any data used in this analysis were missing were simply dropped from consideration in this paper. As a result, the sample in this paper includes 657 students for whom we have estimated IQs, and 681 students from the same schools for whom the teachers supplied measured IQs.
FINDINGS
Measured IQ compared to estimated IQ. Table 1 shows that, while by measurement, some 15 per cent of the students have IQs of 121 or higher, only about 4 per cent are estimated by the teachers to be in this IQ range. On the whole, it appears that teachers tend to underestimate the intelligence of their students. This difference be-tween estimated and measured IQ is significant at the .001 level of confidence, using the standard contingency chi square test of signif-icance.
The data in Table 1 also suggest that teachers tend to avoid extreme categories when estimating student intelligence, especially at the high end of the IQ range, and other tables in this paper bear this tendency out. On the whole, teachers seem to take a pessimistic view of student intelligence, at least by comparison of their estim-ates to measured IQ.
TABLE 1
MEASURED IQ COMPARED TO ESTIMATED IQ
IQ
Source 96 and 121 and
ofIQ lower 97-104 105-112 113-120 higher Total
-Measured IQ 19.2% 26.7% 24.1% 14.8% 15.1% 681
Estimated IQ 17.7% 33.2% 28.9% 16.1% 4.1% 657 X2 = 50.7; df = 4; p
<
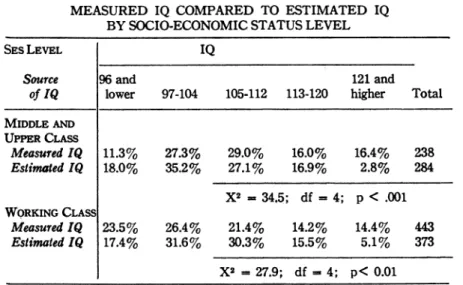
.001SES. Since we are concerned with bias in the estimation of in-telligence, we now turn to the SES of the students. The measure of SES is the teacher-estimate, and although it may be inaccurate, if SES introduces bias in teacher-estimates of intelligence, then it is the SES that the teacher perceives that influences him, whether it is accurate or not. But because the measured IQ (as shown in Table II) is related to SES in the way usually reported in the literature, that is, discriminating against low SES students, the teacher-estim-ates of SES are probably reasonably accu rate.
Table II presents the comparison of estimated to measured IQ for children at two SES levels - middle and upper class, and work-ing class. At both high and low SES levels, the distributions of measured and estimated IQs are significantly different from each other; but their patterns are quite dissimilar. For middle and upper class students, the teacher seems to have a tendency to underestim-ate IQs whereas this is not the case with the students at the work-ing class level, where the tendency appears to be to concentrate students near the mean IQ rather than at either the high or low end of the IQ spectrum.
There is another way to look at the data presented in Table II, and that is to compare measured IQ of middle and upper class students to measured IQ of working class students. When this is done, one finds that 61.4 per cent of middle and upper class students have IQs of 105 or over, as compared to only 50.0 per cent of work-ing class children. Although this difference is statistically
signif-Eigil Peder8e1t 17
icant (XI = 16.4; df
=
4; p<
.01), its interpretation is somewhat problematical. Either the working class children are significantly lower in intelligence than the Middle and upper class children, or the tests discriminate against them; on the other hand, a combination of both these factors is at work. However, if one comparese.tim-ated IQ of Middle and upper clau students to e.timated IQ of
work-ing class children, one finds that 46.8 per cent of Middle and upper class students have IQs of 105 and higher, as compared to 50.9 per cent of working class children. While this difference is not signif-icant statistically (XI
=
3.6; df=
4; P<
.50), it is certain that the teachers in our sample do not estimate the intelligence of work-ing class children to be lower than that of Middle and upper clus chiIdren. In view of the known higher dropout rate among working class children as compared to Middle and upper class children, it is just possible that the teacher-estimates are more accurate than the measured IQs; however, this is merely conjecture, and the answer awaits further research of considerable sophistication. In the mean-time, it is clear that if tests discriminate against working class children, then teachers do not do so, or at least not as much so; and if tests do not discriminate against working class children, but give accurate measures of their intelligence, then teachers discriminate in their favour.TABLE II
MEASURED IQ COMPARED TO ESTIMATED IQ BY SOCIO-ECONOMIC STATUS LEVEL
SEsLEVEL IQ
Source 96 and 121 and
of IQ lower 97-104 105-112 113-120 higher Total MJDDLEAND UPPERCLASS M,asured IQ 11.3% 27.3% 29.0% 16.0% 16.4% 238 Estimat,d IQ 18.0% 35.2% 27.1% 16.9% 2.8% 284 X2 _ 34.5; df .. 4;
p <
.001 WQRKJNG CLASS Meosured IQ 23.5% 26.4% 21.4% 14.2% 14.4% 443 Estimated IQ 17.4% 31.6% 30.3% 15.5% 5.1% 373 XI .. 27.9; df .. 4;p<
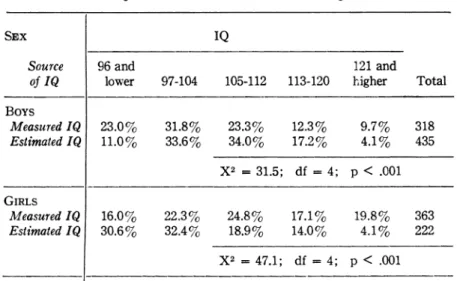
0.01Sex. A basis of discrimination other than that of SES is sex. It seems that girls do better at school, at least in the early years, and we have already referred to the argument of Hall and McFarlane that the world of the school is really a girl's world. Be that as it may, if IQ tests require compliant, willing attention to paper-and-pencil tasks, then it is likely that in our society, girls will be more ready to offer it than boys, and hence achieve higher results on IQ tests.
TABLE III
MEASURED IQ COMPARED TO ESTIMATED IQ BY SEX
SEX IQ
Source 96 and 121 and
of IQ lower 97-104 105-112 113-120 higher Total Boys Measured IQ 23.0% 31.8% 23.3% 12.3% 9.7% 318 Estimated IQ 11.0% 33.6% 34.0% 17.2% 4.1% 435 X2 = 31.5; df = 4; p < .001 GIRLS Measured IQ 16.0% 22.3% 24.8% 17.1% 19.8% 363 Estimated IQ 30.6% 32.4% 18.9% 14.0% 4.1% 222 X2 = 47.1; df = 4; p < .001
The data presented in Table III show that although the meas-ured IQ is significantly different from the estimated IQ for both
boys and and girls, the direction of the discrepancy is different for each case. Apparently, teachers have a tendency to over-estimate the IQ of high school boys, but to under-estimate the IQ of high school girls. Or conversely, it could be argued that the teachers are real-istic, and that it is the IQ tests which discriminate in favour of girls and against boys.
Again, if one makes the alternate comparison, it is clear that by measurement, girls have significantly higher IQs than boys (X2
=
24.1; df=
4; p <.001); but by teacher-estimate, boys haveEigil Pedersen 19 significantly higher IQs than girls (X'
=
43.9; df=
4; p<
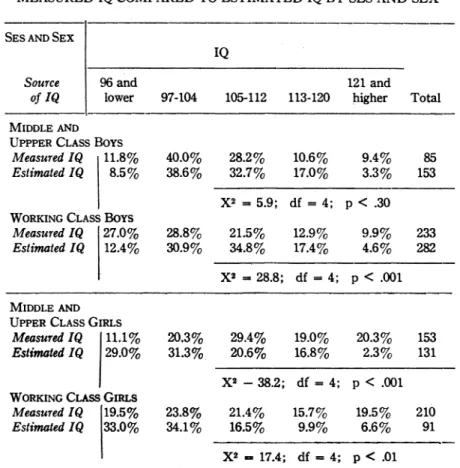
.001). Since teachers have been shown to have an impact on the academic self-concept of students, and because academic self-concept is re-lated to the level of educational aspiration, this might account to some extent for the fact that more boys continue with higher educa-tion than do girls of equal measured intelligence.SES and Sex. To this point, it has been shown that although the teacher does not discriminate against the lower-class student, his estimate of the intelligence of middle and upper class students is significantly lower than the measured intelligence of these students. AIso, we have presented evidence to support the view that high school teachers tend to discriminate against girls, but in favour of boys in the estimation of their intelligence. We now move to the examination of the combination of these two factors, SES and sex. The relevant data are presented in Table IV.
Although it appears from the comparative per cents in the first section of Table IV that teachers have a slight tendency to overestimate the IQ of middle and upper class boys, the differences between measured and estimated IQs are not statistically signif-icant. However, where working class boys are concerned, the ap-parent tendency to overestimate is quite marked; for example, where IQs are measured, a total of 44.3 per cent of working class boys have IQs of 105 or higher, but where teachers estimate the intelligence, 56.8 per cent of working class boys have IQs or 105 or higher.
If the comparison for boys is made between the estimated per cents in the various IQ brackets at different SES IeveIs, it will be noted that in estimating intelligence the teachers do not make very much distinction between middle and upper class boys on one hand, and working class boys on the other. The main difference seems to occur in the 97-104 IQ category, where teachers place 38.6 per cent of middle and upper class boys as opposed to only 30.9 per cent of working cIass boys. This difference, however, is partly made up for by the! fact that the per cent of working cIass boys estimated to be in the 96 and Iower IQ category exceeds that of middle and upper class boys. But these differences are not- statistically significant (X'
=
2.2; df=
4; p<
.70). In fact, in no part of our analysis can it be shown that teachers discriminate betweenstudents at different SES Ievels, unless one accepts as a fact that working class boys (the working class boys in our sample, to be precise) are truly not asin-telligent as Middle class boys, as is suggested by the comparison of measured IQs for boys at the different SES levels (XI
=
9.5; df=
4; p<
.05); if one accepts this position, then it can be said that teachers discriminate in favour of lower class boys, but that they discriminate neither in favour of, nor against, Middle class boys.TABLE IV
MEASURED IQ COMPARED TO ESTIMATED IQ BY SES AND SEX
SES AND SEX
IQ
Source 96 and 121 and
of IQ lower 97-104 105-112 113-120 higher Total MIDDLE AND
UPPPER CLASS Boys
Measured IQ 11.8% 40.0% 28.2% 10.6% 9.4% 85 Estimated IQ 8.5% 38.6% 32.7% 17.0% 3.3% 153
X2 = 5.9; df
=
4; p<
.30 WORKING CLASS BoysMeasured IQ 27.0% 28.8% 21.5% 12.9% 9.9% 233 Estimated 1 Q 12.4% 30.9% 34.8% 17.4% 4.6% 282
X2 = 28.8: df
= 4;
p<
.001 MIDDLE ANDUPPER CLASS GIRLS
Measured IQ 11.1% 20.3% 29.4% 19.0% 20.3% 153 Estimated 1 Q 29.0% 31.3% 20.6% 16.8% 2.3% 131
XI - 38.2; df
=
4; p<
.001 WORKING CLASS GIRLSMeasured IQ 19.5% 23.8% 21.4% 15.7% 19.5% 210 Estima/ed IQ 33.0% 34.1% 16.5% 9.9% 6.6% 91
Xt - 17.4; df -= 4; p
<
.01The lower half of Table IV presents comparisons between estim-ated and measured IQs for girls at the two SES levels. Here, the pattern is the same in both groups; regardless of SES, the teacher-estimates of IQ are significantly lower than the measured IQs.
Eigil PetWrBe1I. Il
Using the alternate comparison with these data, it appears that teachers tend to acknowledge that middle and upper class girls are more intelligent than working class girls, especially by reference to the per cents in the 105-112 and 118-120 IQ categories; however, the difference between the estimated IQs for girls at the two SES levels is not statistically significant (XI
=
4.8; df=
4: p < .50). In fact, it can not even be demonstrated that measured IQs differ for the two groups (XI=
6.7; df=
4; p< .20). The only conclusion that can be drawn here is that, if one accepts measured IQ as the correct standard, teachers consistently underestimate the IQ of girls, regardless of their SES levaI.CONCLUSIONS
If to this point our reasoning has occasionally seemed to be circular, it is because of a basic epistemological problem underlying the drawing of any conclusions from these data. The problem is this: To what extent is there any possibility of knowing whether or not teachers or tests underestimate or overestimate the intelligence of any of the groups of students? There is no satisfactory answer to this question, and it is doubtful whether there can ever be one. The only conclusion that we can state with any certainty is that teachers and testjs differ in the IQ they attach to 8tudent8. To draw any other conclusions than this, we must arbitrarily select IQ from one source and use it as the standard to which we will then compare IQ from the other source.
Summary. If we use measured IQ as a standard against which to compare the IQ of high school students as estimated by their teachers, our data lead us to the following conclusions:
1. High school teachers tend to underestimate the IQ of students as a group.
2. ,High school teachers tend to underestimate the IQ of Middle and upper cIass students as a group.
3. High school teachers tend to estimate the IQ of working cIass students cIoser to average levels than they really are.
4. High school teachers tend to overestimate the IQ of working class boys.
5. High school teachers neither overestimate nor underestimate the IQ of Middle and upper cIass boys.
6. High school teachers tend to underestimate the IQ of high school girls, regardless of their .sES leveI.
Implications. IQ tests have been demonstrated to he culturally biased. It is possible that teachers, too, are biased in estimating the
intelligence of high school students, and if this is so, their biases are almost exactly opposite to those of the tests. Whereas IQ tests probably overestimate the intelligence of girls, teachers probably underestimate their IQs; and whereas IQ tests tend to underestim-ate the intelligence of boys - especially of working class boys -the teachers tend to overestimate it. Perhaps this is evidence of the removal "of bias ... from the test-users in the education profes-sion" as Charters has put it. It may be that teachers are compen-sating from their knowledge that tests tend to give inaccurate re-sults. They may even be overcompensating, but we have no way of knowing this from these data.
Compensation is probably good, especially if it can be de-monstrated that teachers do not merely select some different group to victimize by undermining their academic self-concept. Despite the assertion of Hall and McFarlane that school is a girl's world, this becomes less and less evident in the later stages of formaI education. Boys catch up in performance, and attend college and university in larger numbers than girls. There are undoubtedly many social factors that contribute to this phenomenon of sexual differentiation in college-attendance rates, but the tendency of teachers to underestimate the intelligence of girls may find ex-pression in their behavior, and thence into the girls' evaluation of their own abilities. This possibility should be explored by further research.
It is somewhat more difficult to suggest the implications of the teachers' tendency to overestimate the IQ of working class boys, especially in view of the known greater incidence of low self-concept among working class boys as compared to boys at higher SES levels. Perhaps without the teachers' overestimate, the academic self-con-cept of working class boys would be even lower, resulting in poorer school performance as well as a lower level of educational aspiration. But this, too, awaits investigation.
Suggestions for furlher study. The major methodological weak-ness of this study is that we have measured IQs for one group of students, and estimated IQs for another group. While we have taken every precaution to exclu de data where there might be contamin-ating factors, it is possible that the two groups of students have certain differences in social characteristics other than intelligence that make their comparison to each other spurious. An improve-ment in method would be to obtain measured IQs for a group of
Eigil Pedersen 23 students, to withhold them from teachers and, after several months of teacher-student interaction, obtain teacher estimates of student intelligence. Then comparisons would be made on the same students, rather than on hopefully comparable groups of students from the same schoois.
The fact that the subjects of this paper are Quebec students, and largely from rural areas, may limit the applicability of the findings. It is a distinct possibility that, at the time these data were collected (1965), the dropout rate of working class students, especially boys, was very much higher than that of middle and upper class students. If this is the case, then our findings may resuit lar-gely from this fact, rather than from any widespread tendency of teachers in generai to overestimate the intelligence of working class boys. This remains to be explored. In the meantime, this study should be replicated in different areas of the country to see if these are indeed univers al trends, or merely local phenomena.
We would like to know how (or if) the sex of the teacher influ-ences his tendency to overestimate or to underestimate the intelli-gence of girls and boys at different SES levels. It would also be useful to collect data from several grade levels to observe if there are any trends in tendencies to overestimate or to underestimate in-telligence associated with increasing ages and grade levels of students. Religious differences, ethnie differences, rural differ-ences, and regional differences should also be taken into account in future analyses of estimated intelligence.
REFERENCES
1. W. W. Charters, "Social Class and Intelligence Tests," in W. W. Charters and N. L. Gage, (eds.), Reading in the Social Psychology of Education, Boston: Allyn and Bacon, 1963, p. 21.
2. O. Hall and B. McFarlane, "The Girls' and the Boys' World," in Blishen et al. (eds.), Canadian Society: Sociological Perspectives
(rev. ed.), Toronto: Macmillan, 1965, p. 200.
3. W. B. Brookover, ,Thomas Shailer and Ann Paterson, "Self-Concept of Ability and ,school Achievement," Sociology of Education,
XXXVII, (1964), pp. 271-278.
4. E. Pedersen, Student CharacterÏ8tics and the Impact of Perceived Teacher-Evaluation on the Level of Educational Aspiration of Adolescents, Unpublished Ed. D. Dissertation, Cambridge, Mass.: