HAL Id: hal-00330347
https://hal.archives-ouvertes.fr/hal-00330347
Submitted on 14 Oct 2008
HAL is a multi-disciplinary open access
archive for the deposit and dissemination of
sci-entific research documents, whether they are
pub-lished or not. The documents may come from
teaching and research institutions in France or
abroad, or from public or private research centers.
L’archive ouverte pluridisciplinaire HAL, est
destinée au dépôt et à la diffusion de documents
scientifiques de niveau recherche, publiés ou non,
émanant des établissements d’enseignement et de
recherche français ou étrangers, des laboratoires
publics ou privés.
tropical South Eastern Pacific
S. Blain, Sébastien Bonnet, C. Guieu
To cite this version:
S. Blain, Sébastien Bonnet, C. Guieu. Dissolved iron distribution in the tropical and sub tropical South
Eastern Pacific. Biogeosciences, European Geosciences Union, 2008, 5 (1), pp.269-280. �hal-00330347�
© Author(s) 2008. This work is distributed under the Creative Commons Attribution 3.0 License.
Dissolved iron distribution in the tropical and sub tropical
South Eastern Pacific
S. Blain1,*, S. Bonnet2, and C. Guieu2
1Laboratoire d’Oc´eanographie et de Biog´eochimie, Campus de Luminy, case 901, 13288 Marseille cedex, France
2Laboratoire d’oc´eanographie de Villefranche sur mer, Quai de la darse, Villefranche sur mer, France
*present address: UPMC Univ. Paris 06, UMR 7621, Laboratoire d’Oc´eanographie Biologique, 66650 Banyuls/mer, France
Received: 13 July 2007 – Published in Biogeosciences Discuss.: 24 August 2007
Revised: 20 December 2007 – Accepted: 18 January 2008 – Published: 27 February 2008
Abstract. Dissolved iron (DFe) distributions (<0.2 µm) were determined in the upper water column (0–400 m) of the south eastern tropical and subtropical Pacific, in October– November 2004. Data were collected along a transect ex-tending from the Marquesas Islands to the Chilean coast with most of the stations located in the south Pacific gyre. The concentrations of DFe presented large variability with highest values observed at both extremities of the transect. In the Chilean upwelling, DFe concentrations ranged be-tween 1.2–3.9 nM. These high values result from inputs from the continental margin and are likely maintained by anoxic conditions in the water corresponding to the Oxygen Min-imum Zone (OMZ). In subsurface waters near the Marque-sas, that were also associated with the extension of the OMZ, DFe concentrations varied between 0.15–0.41 nM. Vertical transport of this water by mesoscale activity eastward of the archipelago may explain the dissymmetric east-west distri-bution of chlorophyll-a evidenced by satellite images.
Us-ing the new tracer Fe*=DFe−rFe:P(PO3−4 ) we show that DFe
was in deficit compared to PO3−4 resulting from the
reminer-alisation of organic matter. This suggests that the Marque-sas islands and the surrounding plateau are not a significant source of DFe. In the gyre, DFe concentrations in the upper 350 m water column were around 0.1 nM and the ferricline was located well below the nitracline. These low concentra-tions reflect the low input of DFe from the atmosphere, from the ventilation of the upper thermocline with water contain-ing low DFe, and from the low biological activity within this ultra oligotrophic gyre.
Correspondence to: S. Blain
1 Introduction
Iron is now recognised as an important element involved in numerous biochemical processes in the ocean. In High Nu-trient Low Chorophyll (HNLC) regions, iron is the proximate control of organic matter production as was clearly demon-strated by artificial iron fertilisation experiments (Boyd et al., 2007). A natural iron fertilisation experiment carried out in the largest HNLC region, the Southern Ocean (Blain et al., 2007), has revealed that the carbon export is extremely sensitive to iron inputs, much more than previously thought from artificial iron fertilisation experiments. Evidence for iron limitation of biological productivity was also found in other environments including coastal upwelling (Hutchins and Bruland, 1998), mesotrophic (Blain et al., 2004) and oligotrophic (Sedwick et al., 2005) systems. Oligotrophic systems generally provide an ideal ecological niche for the development of nitrogen-fixing organisms (e.g. (Capone et al., 2005; Karl, 2002). Due to the high cellular iron quota in diazotrophs compared to non diazotrophic phytoplankton (Kustka et al., 2003), iron availability also exerts a control on nitrogen fixation and new primary productivity (Mills et al., 2004; Moore and Doney, 2007).
The distribution of dissolved iron (DFe) in seawater de-pends on the nature and the magnitude of the sources and sinks and on the transport mechanisms. The two major ex-ternal sources of iron to the ocean are dust deposition from the atmosphere (Jickells et al., 2005) and inputs from the sediments (Elrod et al., 2004; Johnson et al., 1999). The fingerprint of dust deposition was clearly detectable in the DFe surface concentrations in different regions (Bonnet and Guieu, 2006; Boyle et al., 2005; Guieu et al., 2002; Sedwick et al., 2005). However, the magnitude of the atmospheric source of DFe is still very difficult to quantify because it re-quires determining both the flux of deposition and the sol-ubility of dust. Qualitative evidence of the input from the sediment has mainly been reported for continental shelf or
along the continental margin (La¨es et al., 2007; Martin et al., 1989). But again the magnitude of the source is not well con-strained due to the few quantitative studies on 2007. Elrod et al. (2004) pointed out large discrepancies between fluxes measured in benthic chambers and those inferred from DFe profiles in pore waters. Besides these two major sources, hy-drothermalism (Boyle et al., 2005), pack ice or iceberg melt-ing (Sedwick and Di Tullio, 1997) can locally also impact the vertical DFe distribution. The major sinks in the ocean are the net biological uptake and scavenging by sinking particles. The combination of mixing and sinking tends to rapidly de-crease DFe concentrations at locations away from the source. This horizontal trend was fitted by an exponential law with e-fold (Bucciarelli et al., 2001; Johnson et al., 1997). How-ever, in deep waters where scavenging is reduced due to the low abundance of particles, DFe can be transported over long distances (La¨es et al., 2003).
In regions where dust deposition is low, the deep ocean is the main reservoir of DFe for surface waters. In this context, the determination of DFe fluxes resulting from diapycnal and deep winter mixing is crucial to quantify the input of new iron to the surface layer and to compare it with the iron de-mand of phytoplankton (Blain et al., 2007). In some areas, vertical upwelling may also be a major pathway for trans-porting iron from the deep sea to the surface layer (Johnson et al., 1999). Although no direct observation is available, vertical movement induced by mesoscale or sub-mesoscale activities may also promote upward iron transport.
During the past decade, models that include different de-grees of complexity for the iron cycle and for the coupling with other biogeochemical cycles were developed (Aumont et al., 2003; Johnson et al., 1997; Moore et al., 2004; Parekh et al., 2005; Weber et al., 2007). They are used to test the sensitivity of the iron cycle to processes like scavenging, dis-solution, complexation with organic ligands, and allow draw-ing some conclusions on the factors that control the iron dis-tribution in seawater and the subsequent effect on biological processes (i.e. primary production, nitrogen fixation). The validation of these models is largely dependent on the spa-tial and temporal coverage of DFe distributions in the global ocean. The most recent compilation of iron data in the world ocean (Parekh et al., 2005) shows that although the number of data available is rapidly growing, some large regions are still poorly or not at all sampled. This is the case for the south eastern subtropical Pacific which is also largely under-sampled for most of the other biogeochemical and biological parameters. The BIOSOPE cruise has filled this gap with a long transect extending from the Marquesas archipelago to the Chilean coast. We report here the DFe concentrations in the upper 400m of the water column. The vertical and hori-zontal distributions are discussed in relation with the possible sources and sinks of iron.
2 Material and methods
2.1 Fe determination
The BIOSOPE cruise took place in October-November 2004. The upper water column (0–400 m) was sampled at 19 sta-tions (Table 1) along the 8000 km transect (Fig. 1a). From the surface to 50 m, seawater was collected using a clean Teflon pump connected to a PVC tube attached to a Kevlar cable. In-line filtration was performed through a 0.2 µm car-tridge (Sartorius Sartrobran-P-capsule 0.45 mm prefilter and 0.2 mm final filter) in a clean laboratory container.
Below 50 m, samples were collected with acid-cleaned 12 l Teflon-coated GO-Flo bottles mounted on a Kevlar ca-ble (length 450 m) and tripped by Teflon messengers. The bottles were then brought to a clean van for sub sampling. The GO-Flo bottles were gently pressurised with high purity nitrogen allowing on-line filtration through Sartroban car-tridges (0.2 µm with a 0.4 µm prefilter, Sartorius). All the filtered samples for DFe analysis were collected in duplicate, in acid-cleaned 60 ml low density polyethylene bottles and immediately acidified with ultrapure HCl (60 µl, 9.5 mM fi-nal concentration, Merck, ultrapur©) under a class 100 lam-inar flow hood. The samples were left for at least 24 h before analysis.
The concentrations of DFe were measured on board by Flow Injection Analysis with chemiluminescence detection (adapted from Obata et al., 1993). The pH of the acidified samples was adjusted to 5 using Ultrapur ammonia and a 3-times purified ammonium acetate buffer before loading for 120 s on the 8 hydroxyquinoline (8 HQ) preconcentration column (1 cm long). The mean blank, calculated from daily determinations, equalled 69±18 pM (n=19) and the detection limit was 54 pM. The accuracy was assessed by re-analysing one vertical profile (6 samples) of the BIOSOPE cruise dur-ing the KEOPS cruise (Blain et al., 2008) in parallel with the new reference material from the SAFE cruise (North Pa-cific gyre, same period as BIOSOPE). Both profiles analyzed during BIOSOPE and KEOPS were not statistically different (t-test, p<0.01), indicating a good accuracy of the method.
2.2 Ancillary measurements
Temperature, salinity, and dioxygen (O2)were determined
from CTD casts performed at each station. Samples for nu-trient analyses were collected both from GO-Flo and Niskin casts. The comparison between both data sets was used to detect possible malfunctioning of the GO-Flo bottles (e.g. leaks). Dioxygen was measured by the Winkler method with potentiometric endpoint detection. Nitrate and phosphate concentrations were measured using a Technicon Autoanal-yser II (Tr´eguer and Le Corre, 1975). For low nitrate concen-trations, the method described in (Raimbault et al., 2007) was used. All the nutrient data presented in this paper are from GO-Flo bottles allowing the direct comparison with DFe.
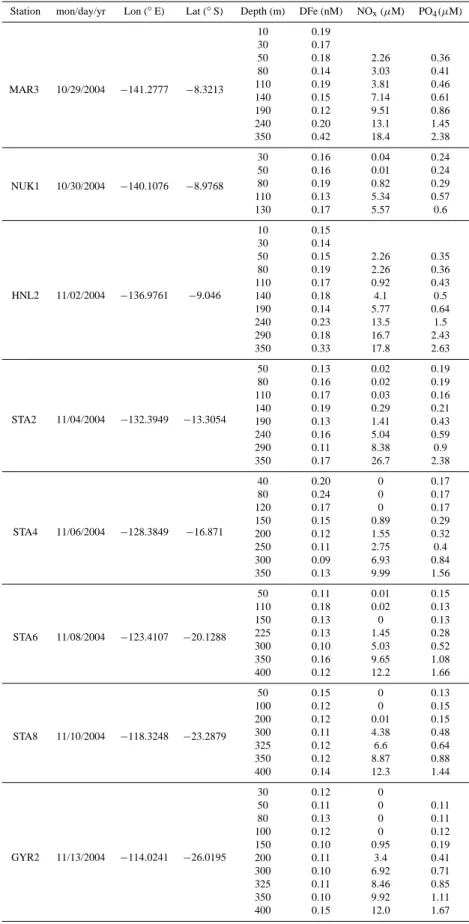
Table 1. Data.
Station mon/day/yr Lon (◦
E) Lat (◦ S) Depth (m) DFe (nM) NOx(µM) PO4(µM) MAR3 10/29/2004 −141.2777 −8.3213 10 0.19 30 0.17 50 0.18 2.26 0.36 80 0.14 3.03 0.41 110 0.19 3.81 0.46 140 0.15 7.14 0.61 190 0.12 9.51 0.86 240 0.20 13.1 1.45 350 0.42 18.4 2.38 NUK1 10/30/2004 −140.1076 −8.9768 30 0.16 0.04 0.24 50 0.16 0.01 0.24 80 0.19 0.82 0.29 110 0.13 5.34 0.57 130 0.17 5.57 0.6 HNL2 11/02/2004 −136.9761 −9.046 10 0.15 30 0.14 50 0.15 2.26 0.35 80 0.19 2.26 0.36 110 0.17 0.92 0.43 140 0.18 4.1 0.5 190 0.14 5.77 0.64 240 0.23 13.5 1.5 290 0.18 16.7 2.43 350 0.33 17.8 2.63 STA2 11/04/2004 −132.3949 −13.3054 50 0.13 0.02 0.19 80 0.16 0.02 0.19 110 0.17 0.03 0.16 140 0.19 0.29 0.21 190 0.13 1.41 0.43 240 0.16 5.04 0.59 290 0.11 8.38 0.9 350 0.17 26.7 2.38 STA4 11/06/2004 −128.3849 −16.871 40 0.20 0 0.17 80 0.24 0 0.17 120 0.17 0 0.17 150 0.15 0.89 0.29 200 0.12 1.55 0.32 250 0.11 2.75 0.4 300 0.09 6.93 0.84 350 0.13 9.99 1.56 STA6 11/08/2004 −123.4107 −20.1288 50 0.11 0.01 0.15 110 0.18 0.02 0.13 150 0.13 0 0.13 225 0.13 1.45 0.28 300 0.10 5.03 0.52 350 0.16 9.65 1.08 400 0.12 12.2 1.66 STA8 11/10/2004 −118.3248 −23.2879 50 0.15 0 0.13 100 0.12 0 0.15 200 0.12 0.01 0.15 300 0.11 4.38 0.48 325 0.12 6.6 0.64 350 0.12 8.87 0.88 400 0.14 12.3 1.44 GYR2 11/13/2004 −114.0241 −26.0195 30 0.12 0 50 0.11 0 0.11 80 0.13 0 0.11 100 0.12 0 0.12 150 0.10 0.95 0.19 200 0.11 3.4 0.41 300 0.10 6.92 0.71 325 0.11 8.46 0.85 350 0.10 9.92 1.11 400 0.15 12.0 1.67
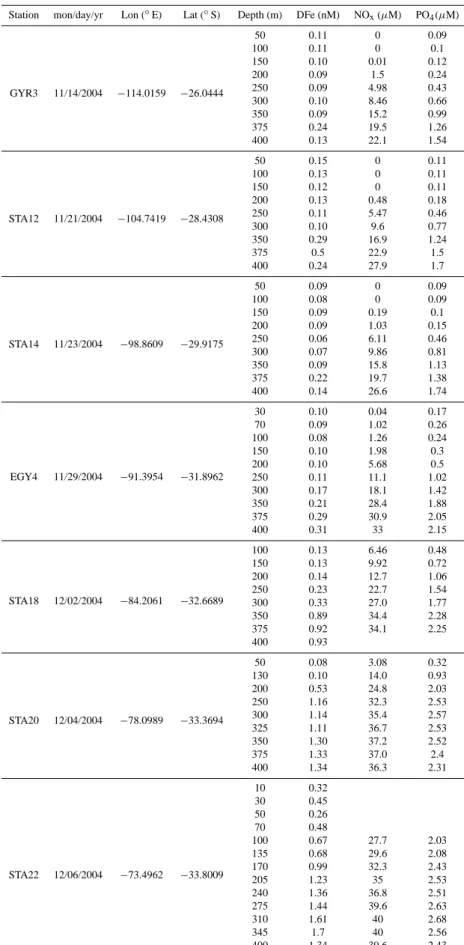
Table 1. Continued
Station mon/day/yr Lon (◦
E) Lat (◦ S) Depth (m) DFe (nM) NOx(µM) PO4(µM) GYR3 11/14/2004 −114.0159 −26.0444 50 0.11 0 0.09 100 0.11 0 0.1 150 0.10 0.01 0.12 200 0.09 1.5 0.24 250 0.09 4.98 0.43 300 0.10 8.46 0.66 350 0.09 15.2 0.99 375 0.24 19.5 1.26 400 0.13 22.1 1.54 STA12 11/21/2004 −104.7419 −28.4308 50 0.15 0 0.11 100 0.13 0 0.11 150 0.12 0 0.11 200 0.13 0.48 0.18 250 0.11 5.47 0.46 300 0.10 9.6 0.77 350 0.29 16.9 1.24 375 0.5 22.9 1.5 400 0.24 27.9 1.7 STA14 11/23/2004 −98.8609 −29.9175 50 0.09 0 0.09 100 0.08 0 0.09 150 0.09 0.19 0.1 200 0.09 1.03 0.15 250 0.06 6.11 0.46 300 0.07 9.86 0.81 350 0.09 15.8 1.13 375 0.22 19.7 1.38 400 0.14 26.6 1.74 EGY4 11/29/2004 −91.3954 −31.8962 30 0.10 0.04 0.17 70 0.09 1.02 0.26 100 0.08 1.26 0.24 150 0.10 1.98 0.3 200 0.10 5.68 0.5 250 0.11 11.1 1.02 300 0.17 18.1 1.42 350 0.21 28.4 1.88 375 0.29 30.9 2.05 400 0.31 33 2.15 STA18 12/02/2004 −84.2061 −32.6689 100 0.13 6.46 0.48 150 0.13 9.92 0.72 200 0.14 12.7 1.06 250 0.23 22.7 1.54 300 0.33 27.0 1.77 350 0.89 34.4 2.28 375 0.92 34.1 2.25 400 0.93 STA20 12/04/2004 −78.0989 −33.3694 50 0.08 3.08 0.32 130 0.10 14.0 0.93 200 0.53 24.8 2.03 250 1.16 32.3 2.53 300 1.14 35.4 2.57 325 1.11 36.7 2.53 350 1.30 37.2 2.52 375 1.33 37.0 2.4 400 1.34 36.3 2.31 STA22 12/06/2004 −73.4962 −33.8009 10 0.32 30 0.45 50 0.26 70 0.48 100 0.67 27.7 2.03 135 0.68 29.6 2.08 170 0.99 32.3 2.43 205 1.23 35 2.53 240 1.36 36.8 2.51 275 1.44 39.6 2.63 310 1.61 40 2.68 345 1.7 40 2.56 400 1.34 39.6 2.43
Table 1. Continued
Station mon/day/yr Lon (◦
E) Lat (◦ S) Depth (m) DFe (nM) NOx(µM) PO4(µM) UPX 12/09/2004 −72.4047 −34.5471 30 1.20 19.1 1.62 75 1.35 26.9 2.43 100 1.98 27.3 2.61 150 27.9 2.65 200 3.39 28.8 2.61 250 3.25 30 2.63 300 3.18 31.2 2.61 350 2.66 32.3 2.63 400 2.78 34.9 2.63 0 0.5 1 1.5 2
Ocean Data View
2000 4000 6000 8000 25 25 25 25.2 25.2 25.2 25.2 25.4 25.4 25.4 25.6 25.6 25. 6 25.8 25. 8 25.8 26 26 26 26.2 26.2 26.2 26 26. 26.4 26.6 26.6 26.6 26.8
Ocean Data View
400 300 200 100 D epth (m) 20 40 60 80 100
Ocean Data View
1 1 1. 5 2 2.5 0.1 0.1 0.1 0.1 0.2 0.2 0. 2 0.2 0.2 0.2 0.3 0.3 0.3 0.3 0.3 0.4 0.4 .4 0.6 0.6 0.7 0.7 0.8 0.8 0.9 0.9 0.15 0.15 0.15 0.15 0.15 0.15 0.15
Ocean Data View
Distance (km) Distance (km) D epth (m) O 2 (% ) D F e (n M) b c 2000 4000 6000 8000 400 300 200 100 140˚W 120˚W 100˚W 80˚W 60˚W 40˚S 30˚S 20˚S 10˚S EQ
Ocean Data View
MAR3 HNL2 NUK1 STA2 STA4 STA6 STA8 GYR2-3 STA12 STA14 EGY4
STA18 STA20 STA22
UPX a
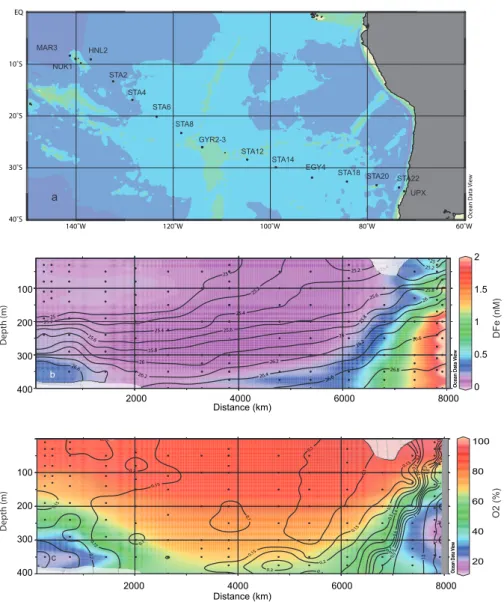
Fig. 1. Position of sampled stations during the BIOSOPE cruise (a), two dimensional distribution of DFe (b) and two dimensional distribution
of the percentage of O2saturation (c). The black lines denote the depths of the iso-density (γ ) (b) and the DFe concentrations (c).
3 Results and discussion
The two-dimensional distribution of DFe along the BIOSOPE transect is presented in conjunction with the
iso-density lines (Fig. 1b) and overlayed on the percentage of O2
saturation (Fig. 1c). The concentrations of DFe ranged over almost two orders of magnitude from 0.061 nM to 3.39 nM
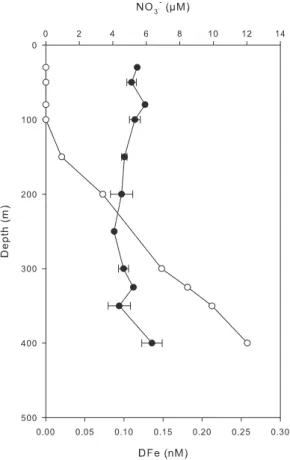
Fig. 2. Vertical distribution of DFe (black dots) and nitrate (white
dots) at the station GYR. For DFe, mean values (n=2) ± one stan-dard deviation are given.
discuss the vertical distribution of DFe in three different en-vironments: the upwelling zone including the stations where the Oxygen Minimum Zone (OMZ) was present (stations UPX, STA18, STA20 and STA22), the HNLC region close to the Marquesas islands (stations MAR3, NUK and HNL2), and the gyre (stations STA2-14 and GYR1-2 and EGY4). When possible, the DFe distributions were compared with other sites with similar oceanographic regimes. In the sec-ond part of the paper, we consider the relationship between DFe and the major nutrients to discuss the status of iron as limiting factor in the different regions and the possible role of the OMZ in maintaining high DFe concentrations in the sub surface water of the low latitudes of the South Pacific.
3.1 The vertical distribution of DFe in typical
oceano-graphic environments
3.1.1 The coastal upwelling region
The Chilean coastal upwelling region had the highest DFe concentrations measured during the cruise (Fig. 1, Table 1). The station UPX, located in the core of the upwelling, was characterised by high values of nitrate (19.1 µM) and
phos-phate (1.2 µM) at 30 m. The concentration of DFe at this depth was also high (1.2 nM) and increased up to 3.39 nM at 200 m. In surface waters, DFe decreased rapidly with dis-tance from shore and DFe concentrations at STA20 were
<0.1 nM, typical for oceanic surface waters with low iron
supply. Below the mixed layer, the decrease in DFe from in-shore to offin-shore stations was also marked. At 250 m, DFe at STA18 was 10 fold lower than at station UPX. However, if compared to surface water, the decrease was not as abrupt and, below 200 m, concentrations >1 nM were still measured at STA20 and STA22. High DFe concentrations are also
re-ported for the Peru upwelling (from 2◦S to 18◦S), (Bruland
et al., 2005), but large variability was observed near the bot-tom depending on the size of the shelf. Concentrations of DFe as high as 50 nM were associated with the widest shelf in the north, but in the southern part, where the shelf was nar-row, the concentrations in near bottom suboxic waters were an order of magnitude lower (1.4–4.3 nM). We did not mea-sure the concentrations of DFe above the Chilean shelf, but at station UPX at 100 m, which is roughly the depth of the continental shelf in this region, DFe was 2 nM. This is in the same range as in the southern part of the Peru upwelling and could also be explained by the quite narrow shelf off Chile.
In the upwelling zone, the highest concentrations of DFe were measured between 200 and 400 m, close to the shelf break. This part of the water column is suboxic (Fig. 1c) and associated with the relatively salty water mass of the Equato-rial Sub-Surface Water (ESSW) (Blanco et al., 2001). In fact, this under-counter current is flowing poleward along the
en-tire South American continent starting at around 5◦S (Brink
et al., 1983). When the current flows over a wide shelf it is in contact with the organic-rich shelf sediments and DFe concentrations are high. By contrast, when the current flows over a narrow shelf or along the steep continental slope, the concentrations are an order of magnitude lower but still high compared to open ocean concentrations. The suboxic condi-tions that prevailed are favourable condicondi-tions to maintain iron in solution in the reduced form Fe(II) which is more soluble than Fe(III). High concentration of Fe(II) have been reported (Hong and Kester 1986) off the Peru coast in samples close to the bottom, but also at stations located offshore at depth coinciding with the upper portion of the oxygen minimum.
3.1.2 The oligotrophic gyre
The DFe concentrations at the station GYR (26◦S, 114◦W)
are low and homogenous (0.104±0.012 nM, n=15, 2 pro-files) between the surface and 350 m (Fig. 2). DFe vertical profiles are reported at stations located in the other subtrop-ical gyres in the Atlantic and the Pacific (Fig. 3). In the
North Pacific gyre, at station ALOHA (22◦45 N, 158◦00 W),
the near surface DFe concentrations are in the range 0.2– 0.7 nM (Boyle et al., 2005). In the western part of the sub-tropical North Atlantic gyre, at a station (31◦25 N, 63◦25 W) near BATS (Bermuda Atlantic Time-Series Station), large
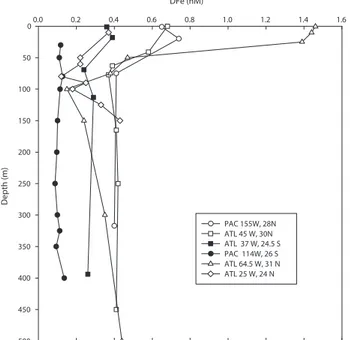
DFe (nM) 0.0 0.2 0.4 0.6 0.8 1.0 1.2 1.4 1.6 Depth (m ) 0 50 100 150 200 250 300 350 400 450 500 PAC 155W, 28N ATL 45 W, 30N ATL 37 W, 24.5 S PAC 114W, 26 S ATL 64.5 W, 31 N ATL 25 W, 24 N
Fig. 3. Vertical profiles of DFe at different tropical and subtropical
stations. Black symbols are for stations located in the Southern Hemisphere and open symbols for stations located in the Northern Hemisphere.
seasonal variations were observed ranging from 1–2 nM to
0.1–0.2 nM (Sedwick et al., 2005). In the centre of this
gyre (30◦00 N, 45◦00 W), DFe varied between 0.37–0.68 nM
(Bergquist and Boyle, 2006), and in eastern part of the gyre, in an area extending from the Canary Islands to the Cap Verde Islands, DFe surface concentrations were in the range 0.2–1.2 nM (Sarthou et al., 2003). In all these studies, the DFe variations in surface waters were attributed to the vari-ability in dust deposition. Only few data are available for the
South Atlantic gyre. At 25◦S, 37◦W, a mean DFe
concen-tration of 0.37±0.03 nM was reported in the depth stratum 0–52 m (Bergquist and Boyle, 2006). In the Guinea gyre, DFe in surface water was significantly lower (0.12±0.08 nM) (Sarthou et al., 2003).
The current study reveals that the concentrations in the south east Pacific subtropical gyre are among the lowest re-ported so far. This is consistent with the very low
atmo-spheric iron deposition of 0.11±0.05 nmol m−2 d−1
mea-sured during the cruise (Wagener et al., 2008). The
at-mospheric data revealed a very low seasonality over the BIOSOPE area, with a small maximum during spring (Wa-gener et al., 2008). The values of dust deposition were 12-to 3000-times lower than the dust deposition reported at BATS and ALOHA (Measures et al., 2005; Sedwick et al., 2005) and 7- to 7000-times lower than the estimates in the subtrop-ical north east Atlantic (Sarthou et al., 2003).
0 0.5 1 1.5 2 2.5 3
Ocean Data View
34 34.5 35 35.5 36 36.5 10 15 20 25 Salinity T e mp e rt a u re (° C ) D F e (n M) ESPC W
Fig. 4. Temperature versus salinity diagram with the colour of the
dots scaled to DFe concentrations (see color bar). The black line denotes the occurrence of the Eastern South Pacific Central Water (ESPCW).
At the station GYR, a small increase of DFe was observed between 350 and 400 m (Fig. 2). This might denote the be-ginning of the ferricline but this cannot be confirmed due to the lack of DFe measurements at deeper depths. Even though uncertainties exist concerning the exact position of the ferricline, it is clear that it was located well below the nitracline (Fig. 2). The nutricline results from the mixing between the surface water, that is nutrient-depleted due to bi-ological activity, and the subsurface water, that is refuelled by mineralization of sinking organic material. Lateral trans-port of nutrients (spreading along isopycnal surface or lat-eral advection) can alter the one-dimensional model. The lack of DFe vertical gradients between 0 and 350 m sug-gests that both the consumption of DFe in surface waters and the remineralisation in subsurface waters were low. This is consistent with the extremely low biomass and productivity in the hyper-oligotrophic surface waters of the gyre (Raim-bault et al., 2007). The thermocline of the south east Pacific gyre is mainly ventilated by the Eastern South Pacific Central Water ESPCW characterised by a temperature-salinity rela-tionship that spans over a large range (Fig. 4). This water mass contains low DFe concentrations (<0.2 nM). The water
mass was formed in the region between 180–150◦W
(Sprint-all and Tomczak, 1992) where no measurements of DFe are available. However, low DFe concentrations are expected in this area due to the low dust deposition. The surface wa-ters located above the ESPCW have a low productivity re-sulting in low particle export below the mixed layer. DFe produced by mineralization of sinking particles is therefore modest in the ESPCW. Consequently, the ventilation of the
(a) (b)
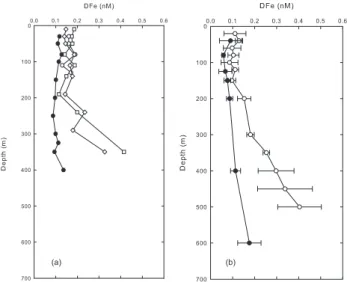
Fig. 5. Comparison of the vertical DFe distribution at stations in the
vicinity of archipelagi and typical oceanic stations. (a) Vertical pro-files of DFe near the Marquesas islands (open symbols) and in the centre of the South East Pacific gyre (station GYR, black symbols).
(b) Vertical profiles of DFe at a station above the Kerguelen plateau
(white dots) (58◦38′S, 72◦05′E), and at an HNLC station (51◦39′,
78◦00 E) south east of the plateau (black dots) (Blain et al., 2007).
upper thermocline cannot be a large source of DFe for sub-surface water in the gyre. The same conclusion was drawn by Bergquist and Boyle (2006) to explain the relatively low DFe concentrations measured in the pycnocline in the southern subtropical Atlantic gyre that is ventilated by water formed at higher latitudes were dust deposition is expected to be low.
3.1.3 The Marquesas islands
Vertical profiles of DFe were collected west, within and
east of the Marquesas archipelago (Fig. 5a). The
ver-tical distributions of DFe were very similar at the three
stations studied. The mean concentration in the upper
80 m was 0.16 nM±0.02 nM (n=11). This was not signifi-cantly different (p=0.01) of the mean DFe (0.13±0.03 nM (n=9)) in the upper 80 m of the gyre (STA4-14 and
GYR1-2). Chlorophyll-a concentrations inferred from
satel-lite images, (http://www.obs-vlfr.fr/proof/php/bio satelsatel-lite imagery.php), clearly show a strong contrast between surface waters east and west of the island. This was also confirmed by in situ measurements (Raimbault et al., 2007). It was sug-gested that this dissymmetry might be caused by natural iron enrichment of the HNLC water down stream the islands, sim-ilarly to the blooms in the vicinity of other islands in HNLC systems, like Galapagos (Gordon et al., 1998) or Kerguelen (Blain et al., 2007).
At a first glance it is tempting to attribute the iron source to the vicinity of the island (Signorini et al., 1999). However, the vertical profile at the shallow station (NUK) located
be-tween two islands did not significantly differ from the DFe profiles at deep ocean stations located east or west of the is-land (Fig. 5a). There is no significant increase of DFe in surface water and this rules out the land drainage as an im-portant source of DFe, at least at the time of the cruise. On a interannual time scale, the detailed analysis of the varia-tion of the rainfall at the Marquesas islands do not indicate a high correlation with the Chl-a inferred from satellite (Mar-tinez and Maamaatuaiahutapu 2004). In addition to the pos-sible input of DFe originating from the island, Signorini et al. (1999) suggested that the hydrothermal flux through old volcanic formations might also be a source of DFe. The fin-gerprint of hydrothermal activity in DFe vertical profiles was detectable off Hawaii (Boyle et al., 2005) at station ALOHA. At this site, the increase in dissolved and particulate Fe at around 1000 m correlated well with the highest
concentra-tion of δ3He (Boyle et al., 2005). Such data do not exist for
the Marquesas island, but the absence of high DFe concen-trations close to the island do not support the hypothesis of hydrothermal fluid injection into the water column.
A clear increase in DFe below 200 m was detectable at the western and eastern stations (Fig. 5a). This vertical DFe gradient was considerably steeper than at the station GYR. The origin of the enrichment in DFe near the Marquesas will be discussed in the next section, but it is interesting to com-pare the data in Fig. 5a with data collected in the Southern Ocean (Fig. 5b) near the Kerguelen plateau, where natural iron fertilisation of surface waters has clearly been demon-strated (Blain et al., 2007). The surface waters above and outside the plateau had similar concentrations but the gra-dient of DFe below 150 m was steeper above the Kergue-len plateau where the bloom occurred compared to outside the plateau where concentrations of Chl-a were low. The deep reservoir of DFe was made available for phytoplankton by different mechanisms including diapycnal vertical mixing and deep winter mixing.
If DFe was responsible for the east-west difference in biomass near the Marquesas islands, mechanisms for up-ward transport of DFe should only exit eastup-ward of the is-land. An analysis for the period 1997–2002 of sea surface height anomaly (Martinez and Maamaatuaiahutapu, 2004), Chl-a, wind speed and SST indicates that the bloom was strongly correlated with the total surface current (Eckman plus geostrophic), the high values of the current being as-sociated with high values of Chl-a. These authors concluded that the origin of the bloom was the result of the interac-tion between the chain of islands and the mean flow of wa-ter masses, but the underlying mechanisms such as wind driven upwelling or mixing due to friction could not be es-tablished. Recent investigations in the vicinity of Hawaii (Benitez-Nelson et al., 2007) demonstrated that wind driven mesoscale cyclonic eddies that form in the lee of islands in-creased nutrient supply and primary production following the doming of isopycnal surfaces. Within oceanic eddies inter-action of the wind with the underlying eddy-driven flow can
also create episodic eddy driven upwelling supplying nutri-ents for surface water (Mcgillicuddy et al., 2007). All these processes have the potential to generate the complex dis-symmetric and mesoscale patterns of Chl-a observed around the Marquesas islands but more detailed field studies are re-quired to elucidate the correct mechanisms.
3.2 Application of the tracer Fe*
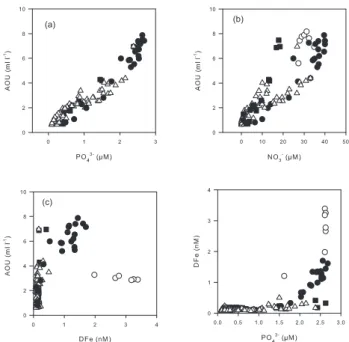
The remineralisation of organic matter (OM) is a major source of macro or micro-nutriments in subsurface waters. This process is associated with the consumption of oxygen and the apparent oxygen utilisation (AOU) can provide a quantitative estimate of the amount of material that has been remineralised. We have used our data with z>80 m to
con-struct the plots of PO3−4 , NO−3 and DFe versus AOU that are
shown in Fig. 6a, b and c, respectively. The concentrations
of PO3−4 are well correlated with AOU (r2=0.9317) showing
that the remineralisation of POP directly translates into DIP
and that PO3−4 can be used as a good tracer for the
reminer-alisation in the studied areas. The correlation is so not
obvi-ous for NO−3 when the entire data set is considered. This is
mainly due to loss of nitrate by denitrification or anammox
in the zone where the O2concentrations are low. No clear
relation can be established between DFe and AOU (Fig. 6c). This is not surprising because the whole data set included re-gions were the DFe distribution was obviously impacted by processes other than remineralisation (e.g. iron input from the shelf in the upwelling region). However, a more de-tailed examination has revealed that there was a good
lin-ear correlation between DFe and AOU, or PO3−4 , for the
sta-tions 18 to 22 that were typical of the OMZ. The slope of the curve, representing the typical remineralisation ratio, was
r(Fe/P)OMZ=0.99±0.11 mmol mol−1. The intercept of the
re-gression line was −1.23±0.11 nmol l−1, reflecting possible
excess of preformed PO3−4 compared to DFe in this water
mass. To reveal the balance between physical transport and
scavenging, Parekh et al. (2005) defined Fe*=(DFe)−rFe/P
(PO3−4 )which subtracts the contribution of remineralisation
of OM to DFe. A positive Fe* implies that there is enough
iron to support the complete consumption of PO3−4 when this
water is brought to the surface, and a negative Fe* implies a deficit. We have applied this definition (using the same value
of rFe/P=0.47 mol mol−1used in their work) to calculate Fe*
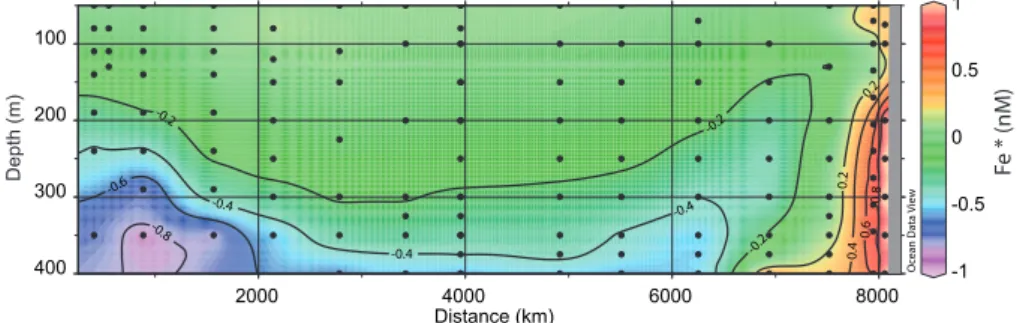
along the transect (Fig. 7). Positive values were observed in the upwelling region. Most other stations of the transect pre-sented Fe* lightly negative, except in the subsurface water near the Marquesas and near 400 m in the gyre where Fe*
was clearly negative. Fe* relies on the choice of rFe/Pwhich
is not well constrained. The ratio rFe/P very likely depends
on the degree of iron limitation of phytoplankton that has synthesized the OM (Sunda 1997). In iron-limited regimes
the ratio (0.2–0.5 mmol mol−1)could be lower than in non
iron-limited regions (0.7–1.4 mmol mol−1). The direct
mea-surement of the elemental composition of diatoms collected
(a)
(c)
(b)
Fig. 6. Property-property diagrams for stations STA18-22 (black
circles), stations UPX (white circles), stations MAR3, NUK and HNL2 (black squares), station STA2-14, GYR 2-3 and EGY (white triangles).
inside and outside the fertilised patch of SOFEX (Twining et al., 2004) confirmed this trend. For diatoms the mean Fe/P
ratios were 0.71 mmol mol−1and 1.9 mmol mol−1in low and
high Fe environments, respectively. In our study, rFe/Pwas
certainly not constant along the transect as shown by the large scatter in the data (Fig. 6d). However, the variability
in the rFe/Pbetween 1 to 0.2 mol mol−1does not change our
conclusion that Fe*<0 and Fe*>0 occurred in subsurface waters near Marquesas and close to the Chilean coast, re-spectively. The qualitative examination of the distribution of DFe (Fig. 1b, c), of the vertical profiles at stations MAR3 and HNL2 (Fig. 5a), and the comparison with the distribution of DFe near Kerguelen island (Fig. 5b) suggest that there may be a source of DFe near the islands. The negative Fe* does not confirm this idea because there was less DFe than pre-dicted from the remineralisation of the organic matter
inde-pendent of the rFe/Pvalues applied. The samples with
neg-ative Fe* are located in waters with low O2(Fig. 1c). The
occurrence of the OMZ is a major feature of the water col-umn in the South East Pacific. The biological or physical ori-gin of the OMZ has been debated in the past (Wirtki 1962), but there is now a consensus that three major processes con-tribute to its formation. 1) high phytoplankton production at the surface, 2) a sharp permanent pycnocline and 3) a slug-gish circulation leading to old age for subpycnocline waters. During our cruise, the OMZ was clearly identified along the Chilean coast but a global distribution of O2in the eastern Pa-cific (Fig. 20 in Fiedler and Talley, 2006) shows that the sub-surface waters of the stations near Marquesas are part of the
-1 -0.5 0 0.5 1 -0 .8 -0.6 -0.4 -0.4 -0.4 -0.2 -0.2 -0.2 0.2 0.2 0. 4 0.6 0. 8
Ocean Data View
2000 4000 6000 8000 400 300 200 100 Distance (km) D e p th (m) F e * (nM)
Fig. 7. Two dimensional distribution of Fe* calculated as DFe−rFe/P(PO3−4 )with rFe/P=0.47 mmol mol−1.
wide OMZ extending westward from the continent. There-fore, in this region, the most appropriate ratio to be used in the calculation of Fe* would be 1, as determined above for the remineralisation of OM in the OMZ. This leads to largely negative values of Fe*< −1 nM in the OMZ near Marque-sas, showing that the scavenging and slow circulation in sub pycnocline waters had dramatically reduced the
concentra-tion of DFe compared to PO3−4 . Johnson et al. (1997) have
shown that the length scale for the reduction of DFe versus the distance of the source can be estimated from 1/slope of the linear plot of Ln(DFe)=f(distance from the source). This corresponds to the distance at which DFe was reduced by 37% compared to the source. At 1000 m, offshore the Cali-fornian coast, the length scale was 5000 km. If we apply the same approach at 350 m using the value at stations STA20 (1.3 nM) and MAR3 (0.4 nM) we obtain a similar distance (4400 km). In both cases, the length scales were estimated at
depth where the O2concentrations were low. The reducing
conditions probably contributed to maintain iron in solution.
3.3 Potential impact of DFe distribution on biology
The objective of the present paper was to describe and dis-cuss the DFe distributions, but we briefly mention two poten-tially important implications in terms of biological activity.
i) If we assume that the relatively high biomass observed downstream the Marquesas island is due to vertical in-puts of DFe from subsurface waters (see Sect. 3.1.3), the negative Fe* values in these waters imply that the amount of DFe supplied was still in deficit compared to phosphate leading to the significant amount of unused
nutrient (0.3 µM of PO3−4 and 2.2 µM of NO−3)in
sur-face waters.
ii) Our data show that DFe was low in the entire South
Pa-cific gyre, but NO−3 was also extremely low (Raimbault
et al., 2007). The limitation of primary production by Fe on the edges of the gyre was demonstrated by deck incubation experiments (Bonnet et al., 2007). By con-trast, evidence for severe nitrogen limitation of primary production was observed in the centre of the gyre
(Bon-net et al., 2007). It has been hypothesised that DFe may also regulate the rate of nitrogen fixation in such low nitrate environments. During incubation experiments carried out in the centre of the South Pacific gyre, iron addition did not stimulate nitrogen fixation (Bonnet et al., 2007; Raimbault et al., 2007). This result seems to be at odds with the possible limitation of the nitrogen fixation by iron availability. However the lack of re-sponse in this short term experiment could also be due to the quasi absence of N-fixing populations. Tempo-rally more detailed information is required to fully un-derstand the role of Fe on primary producers in these oligotrophic waters.
Acknowledgements. We thank the captain, the officers and the
crew of the R/V Atalante. We also thank P. Raimbault who
performed the nutrient analysis of the Go-Flo samples, H. Claustre, leader of BIOSOPE and chief scientist of the leg1, and chief scientist A. Sciandra of the leg2. The manuscript profited from the comments of two anonymous reviewers. This is a contribution of the BIOSOPE project, funded by CNRS-INSU (LEFE CYBER-program), CNES, ESA and NASA.
Edited by: J. Middelburg
References
Aumont, O., Maier-Reimer, E., Blain, S., and Monfray, P.: An ecosystem model of the global ocean including Fe, Si, P co limitations, Global Biogeochem. Cy., 17, 1060, doi:10.1029/2001GB001745, 2003.
Benitez-Nelson, C., Bidigare, R. C., Dickey, T. D., Landry, M. R., Leonard, C. L., Brown, S. L., Nencioli, F., Rii, Y. M., Maiti, K., Becker, J. W., Biddy, T. S., Black, W., Cai, W.-J., Carlson, C. A., Chen, F., Kuwahara, V. S., Lmahaffey, C., Mcandrew, P. M., Quay, P. D., Rapp´e, M. S., Selph, K. E., Simmonds, M. P., and Yang, E. J.: Mesoscale eddies drive increased silica export in the subtropical Pacific ocean, Science, 316, 1017–1021, 2007. Bergquist, B. A. and Boyle, E. A.: Dissolved iron in the
tropi-cal and subtropitropi-cal atlantic ocean, Global Biogeochem. Cy., 20, GB1015, doi:10.1029/2005GB002505, 2006.
Blain, S., Guieu, C., Claustre, H., Leblanc, K., Moutin, T., Qu´eguiner, B., and Sarthou, G.: Availability of iron and
ma-jor nutrients for phytoplankton in the north-east Atlantic ocean, Limnol. Oceanogr., 49, 2095–2104, 2004.
Blain, S., Qu´eguiner, B., Armand, L., Belviso, S., Bombled, B., Bopp, L., Bowie, A., Brunet, C., Brussaard, K., Carlotti, F., Christaki, U., Corbi`ere, A., Durand, I., Ebersbach, F., Fuda, J. L., Garcia, N., Gerringa, L. J. A., Griffiths, F. B., Guigue, C., Guillerm, C., Jacquet, S., Jeandel, C., Laan, P., Lef`evre, D., Lomonaco, C., Malits, A., Mosseri, J., Obernosterer, I., Park, Y. H., Picheral, M., Pondaven, P., Remenyi, T., Sandroni, V., Sarthou, G., Savoye, N., Scouarnec, L., Souhault, M., Thuillers, D., Timmermans, K. R., Trull, T., Uitz, J., Van-Beek, P., Veld-huis, M. J. W., Vincent, D., Viollier, E., Vong, L., and Wagener, T.: Effect of natural iron fertilisation on carbon sequestration in the Southern Ocean, Nature, 446, 1070–1075, 2007.
Blain, S., Sarthou, G., and Laan, P.: Distributions of
dis-solved iron during the natural iron fertilisation experiment KEOPS (Kerguelen Island, Southern Ocean), Deep Sea Res. II, doi:10.1016:j.dsr2.2007.12.008, in press, 2008.
Blanco, J. L., Thomas, A. C., Carr, M. E., and Strub, P. T.: Sea-sonnal climatology of hydrographic conditions in the upwelling region off nortehrn Chile, J. Geophys. Res., 106, 11 456–11 467, 2001.
Bonnet, S. and Guieu, C.: Atmospheric forcing on the annual iron cycle in the western Mediterranean sea, J. Geophys. Res., 111, C09010, doi:10.1029/2005JC003213, 2006.
Bonnet, S., Guieu, C., Bruyant, F., Pr´aˇsil, O., Van Wambeke, F., Raimbault, P., Grob, C., Moutin, T., Gorbunov, M. Y., Zehr, J. P., Masquelier, S. M., Garczarek, L., and Claustre, H.: Nu-trients limitation of primary productivity in the Southeast Pa-cific (BIOSOPE cruise) Biogeosciences Discuss., 4, 2733–2759, 2007,
http://www.biogeosciences-discuss.net/4/2733/2007/.
Boyd, P. W., Jickells, T., Law, C., Blain, S., Boyle, E. A., Buesseler, K. O., Coale, K. H., Cullen, J. J., De Baar, H. J. W., Follows, M., Harvey, M., Lancelot, C., Levasseur, M., Owens, N. J. P., Pollard, D. A., Rivkin, R. B., Sarmiento, J. L., Schoemann, V., Smetacek, V., Takeda, S., Tsuda, A., Turner, D. R., and Watson, A.: Mesoscale iron enrichment experiments 1993–2005: Synthe-sis and future directions, Science, 315, 612–617, 2007.
Boyle, E. A., Bergquist, B. A., Kayser, R. A., and N., M.: Iron, man-ganese, and lead at Hawaii Ocean Time-series station ALOHA: Temporal variability and an intermediate water hydrothermal plume, Geochimica et Cosmochimica Acta, 69, 933–952, 2005. Brink, K. H., Halpern, D., Huyer, A., and Smith, R. L.: The physical
environment of the peruvian upwelling system, Prog. Oceanogr., 12, 285–305, 1983.
Bruland, K., W., Rue, E., Smith, G. J., and Di Tullio, G. R.: Iron, macronutrient and diatom blooms in the Peru upweling regime: brown and blue waters if Peru, Mar. Chem., 93, 81–103, 2005. Bucciarelli, E., Blain, S., and Tr´eguer, P.: Iron and manganese in the
wake of the Kerguelen Islands (Southern Ocean), Mar. Chem., 73, 21–36, 2001.
Capone, D. G., Burns, J. A., Montoya, J. P., Michaels, A. F., Subramanian, A., and Carpenter, E. J.: New nitrogen input to the tropical North atlantic Ocean by nitrogen fixation by the cyanobacterium, trichodesnium spp., Global Biogeochem. Cy., 19, GB2024, doi:10.1029/2004GB002331, 2005.
Elrod, V. A., Berelson, W. M., Coale, K. H., and Johnson, K.: The flux of iron from continental shelf sediments: a missing
source for global budgets, Geophys. Res. Lett., 31, L12307, doi:10.1029/2004GL020216, 2004.
Fiedler, P. C., and Talley, L. D.: Hydrography of the eastern tropical Paciifc: a review, Prog. Oceanogr., 69, 143–180, 2006.
Gordon, R. M., Johnson, K. S., and Coale, K. H.: The behaviour of iron and other trace elements during the ironEx-I and PlumEx experiments in the Equatorial Pacific, Deep Sea Res. II, 45, 995– 1041, 1998.
Guieu, C., Bozec, Y., Blain, S., Ridame, C., Sarthou, G., and Leblond, N.: Impact of high saharan dust inputs on dissolved iron distributions in the Mediterranean sea, Geophys. Res. Lett., 29, 1911, doi:10.1029/2001GL014454, 2002.
Hong, H. and Kester, D. R.: Redox state of iron in the offshore waters of Peru, Limnol. Oceanogr., 31, 512–534, 1986. Hutchins, D. A. and Bruland, K., W.: Iron-limited diatom growth
and Si:N uptake ratios in a coastal upwelling regime, Nature, 393, 561–564, 1998.
Jickells, T. D., An, Z. S., Andersen, K. K., Baker, A. R., Bergametti, G., Brooks, N., Cao, J. J., Boyd, P. W., Duce, R. A., Hunter, K. A., Kawahata, H., Kubilay, N., Laroche, J., Liss, P. S., Ma-howald, N., Prospero, J. M., Ridgwell, A. J., Tegen, I., and Tor-res, R.: Global Iron Connections Between Desert Dust, Ocean Biogeochemistry, and Climate, Science, 308, 67–71, 2005. Johnson, K., Chavez, F. P., and Friederich, G. E.: Continental-shelf
sediment as a primary source of iron for coastal phytoplankton, Nature, 398, 697–700, 1999.
Johnson, K. S., Gordon, R. M., and Coale, K. H.: What controls dissolved iron concentrations in the world ocean? Mar. Chem., 57, 137–161, 1997.
Karl, D. M.: Nutrient dynamics in the deep blue sea, Trends Micro-biol., 10, 410–418, 2002.
La¨es, A., Blain, S., Laan, P., Achterberg, E. P., Sarthou, G., and De Baar, H. J. W.: Deep dissolved iron profiles in the eastern North Atlantic in relation to water masses, Geophys. Res. Lett., 30, 1902, doi:10.1029/2003GL017902, 2003.
La¨es, A., Blain, S., Laan, P., Ussher, S., Achterberg, E. P., Tr´eguer, P., and De Baar, H. J. W.: Sources and transport of dissolved iron and manganese along the continental margin of the Bay of Biscay, Biogeoscience, 4, 181–194, 2007.
Martin, J. H., Gordon, R. M., Fitzwater, S. E., and Broenkow, W. W.: VERTEX: phytoplankton/iron studies in the Gulf of Alaska, Deep-Sea Res. I, 36, 649–680, 1989.
Martinez, E. and Maamaatuaiahutapu, K.: Island mass effect in the Marsuesas islands: time variation, Geophys. Res. Lett., 31, L18307, doi:10.1029/2004GL020682, 2004.
Mcgillicuddy, D. J., Anderson, L. A., Bates, N. R., Biddy, T. S., Buesseler, K. O., Carlson, C. A., Davis, C. S., Ewart, C., Falkowski, P. G., Goldthwait, S. A., Hansell, D. A., Jenkins, W. J., Johnson, R., Kosnyrev, V. K., Ledwell, J. R., Li, Q. P., Siegel, D. A., and Steinberg, D. K.: Eddy/wind interactions stimulate extraordinary mid-ocean plankton blooms, Science, 316, 1021– 1026, 2007.
Measures, C. I., Brown, M. T., and Wink, S.: Dust deposition to the surface waters of the western and central north pacific inferred from surfce water dissolved aluminum concentrations, Geochem. Geophys. Geosyst., 6, Q09M03, doi:10.1029/2005GC000922, 2005.
Mills, M. M., Ridame, C., Davey, M., La Roche, J., and Geider, J. G.: Iron and phophorus co-limit nitrogen fixation in the eastern
tropical North ATlantic, Nature, 429, 292–294, 2004.
Moore, J. K. and Doney, S. C.: Iron availability limites the ocean nitrogen inventory stabilizing feedsback between marine deni-trification and nitrogen fixation, Global Biogeochem. Cy., 21, GB2001, doi:10.1029/2006GB002762, 2007.
Moore, J. K., Doney, S. C., and Lindsay, K.: Upper ocean dynam-ics and iron cycling in a global three-dimensional model, Global Biogeochem. Cy., 18, GB4028, doi:10.1029/2004GB002220, 2004.
Parekh, P., Follows, M., and Boyle, E. A.: Decoupling of iron and phosphate in the global ocean, Global Biogeochem. Cy., 19, GB2020, doi:10.1029/2004GB002280, 2005.
Raimbault, P., Slawick, G., Coste, B., and Fry, J.: Feasability of using an automated colorimetric procedure for the determination of seawater nitrate in the 0 to 100 nM range: examples from field and culture, Mar. Biol., 104, 347–351, 1900.
Raimbault, P. and Garcia, N.: Carbon and nitrogen uptake in the South Pacific Ocean: evidence for efficient dinitrogen fixation and regenerated production leading to large accumulation of dissolved organic matter in nitrogen-depleted waters, Biogeo-sciences Discuss., 4, 3531–3579, 2007,
http://www.biogeosciences-discuss.net/4/3531/2007/.
Sarthou, G., Baker, A. R., Blain, S., Achterberg, E. P., Boye, M., Bowie, A. R., Croot, P., Laan, P., De Baar, H. J. W., Jickells, T. D., and Worsfold, P. J.: Atmospheric iron deposition and sea-surface dissolved iron concentrations in the eastern Atlantic Ocean, Deep-Sea Res. I, 50, 1339–1352, 2003.
Sedwick, P. N., Church, T. M., Bowie, A. R., Marsay, C. M., Ussher, S. J., Achilles, K. M., Lebathaby, P. J., Johnson, R. J., Sarin, M. M., and Mcgillicauddy, D. J.: Iron in the Sargasso Sea (BATS re-gion) during summer: Eolian imprint, spatio-temporal variabil-ity, and ecological implications., Global Biogeochem. Cy., 19, GB4006, doi:10.1029/2004GB002445, 2005.
Sedwick, P. N. and Di Tullio, G. R.: Regulation of algual blooms in Antarctic shelf waters by the release of iron from melting sea ice, Geophys. Res. Lett., 24, 2515–2518, 1997.
Signorini, S. R., Mcclain, C., and Dandonneau, Y.: Mixing and phytoplankton bloom in the wake of the Marquesas Islands, Geo-phys. Res. Lett., 26, 3121–3124, 1999.
Sprintall, J. and Tomczak, M.: Evidence of the barrier layer in the surface layer of the tropics, J. Geophys. Res., 97, 7305–7316, 1992.
Sunda, W.: Control of dissolved iron concnetration in the world ocean: A comment, Mar. Chem., 57, 169–172, 1997.
Tr´eguer, P. and Le Corre, P.: Manuel d’analyse des sels nutritifs dans l’eau de mer. Utilisation de l’AutoAnalyser II Technicon, 2nd ed., Universit´e de bretagne Occidentale, 1975.
Twining, B. S., Baines, S. B., Fisher, N. S., and Landry, M. R.: Cel-lular iron contents of plankton during the Southern Ocean Iron Experiment (SOFeX), Deep-Sea Res. I, 51, 1827–1850, 2004. Wagener, T., Guieu, C., Losno, R., Bonnet, S., and Mahowald, N.:
Revisiting atmospheric dust export to the southern hemisphere ocean: biogeochemical implication, Global Biogeochem. Cy., doi:10.1029/2007GB002984, in press, 2008.
Weber, L., V¨olker, C., Oschlies, A., and Burchard, H.: Iron profiles and speciation of the upper water column at the bermuda atlantic time-series study site: a model based sensitivity study, Biogeo-sciences, 4, 689–706, 2007,
http://www.biogeosciences.net/4/689/2007/.
Wirtki, K.: The oxygen minima in relation to ocean circulation, Deep-Sea Res. I, 11–23, 1962.