HAL Id: hal-00298544
https://hal.archives-ouvertes.fr/hal-00298544
Submitted on 29 May 2008HAL is a multi-disciplinary open access
archive for the deposit and dissemination of sci-entific research documents, whether they are pub-lished or not. The documents may come from teaching and research institutions in France or abroad, or from public or private research centers.
L’archive ouverte pluridisciplinaire HAL, est destinée au dépôt et à la diffusion de documents scientifiques de niveau recherche, publiés ou non, émanant des établissements d’enseignement et de recherche français ou étrangers, des laboratoires publics ou privés.
Diagnosing the extreme surface melt event over
southwestern Greenland in 2007
M. Tedesco, M. Serreze, X. Fettweis
To cite this version:
M. Tedesco, M. Serreze, X. Fettweis. Diagnosing the extreme surface melt event over southwestern Greenland in 2007. The Cryosphere Discussions, Copernicus, 2008, 2 (3), pp.383-397. �hal-00298544�
TCD
2, 383–397, 2008Extreme surface melt over southwestern Greenland in 2007 M. Tedesco et al. Title Page Abstract Introduction Conclusions References Tables Figures ◭ ◮ ◭ ◮ Back Close Full Screen / Esc
Printer-friendly Version Interactive Discussion The Cryosphere Discuss., 2, 383–397, 2008
www.the-cryosphere-discuss.net/2/383/2008/ © Author(s) 2008. This work is distributed under the Creative Commons Attribution 3.0 License.
The Cryosphere Discussions
The Cryosphere Discussions is the access reviewed discussion forum of The Cryosphere
Diagnosing the extreme surface melt
event over southwestern Greenland in
2007
M. Tedesco1,2,3, M. Serreze4, and X. Fettweis5
1
City College of New York, City University of New York, New York, NY, 10031, USA
2
NASA Goddard Space Flight Center, Greenbelt, MD, 20771, USA
3
University of Maryland, Baltimore County, Baltimore, MD, 21250, USA
4
Cooperative Institute for Research in Environmental Sciences, University of Colorado, Boulder, CO 80309, USA
5
D ´epartement de G ´eographie, Universit ´e de Li `ege, Belgium
Received: 7 April 2008 – Accepted: 22 April 2008 – Published: 29 May 2008 Correspondence to: M. Tedesco (mtedesco@sci.ccny.cuny.edu)
TCD
2, 383–397, 2008Extreme surface melt over southwestern Greenland in 2007 M. Tedesco et al. Title Page Abstract Introduction Conclusions References Tables Figures ◭ ◮ ◭ ◮ Back Close Full Screen / Esc
Printer-friendly Version Interactive Discussion
Abstract
Analysis of passive microwave brightness temperatures from the space-borne Special Sensor Microwave Imager (SSM/I) documents a record surface snowmelt over high elevations (above 2000 m) of the Greenland ice sheet during summer of 2007. To in-terpret this record, results from the SSM/I are examined in conjunction with fields from
5
the National Centers for Environmental Prediction/National Center for Atmospheric Re-search reanalysis and output from a regional climate model. The record surface melt reflects unusually warm conditions, seen in positive summertime anomalies of surface air temperatures, downwelling longwave radiation, 1000–500 hPa atmospheric thick-ness, and the net surface energy flux, linked in turn to southerly airflow over the ice
10
sheet. Low snow accumulation may have contributed to the record through promoting anomalously low surface albedo.
1 Introduction
The most visible evidence of Arctic environmental change is its rapidly shrinking sea ice cover. Based on analysis of time series that combine records from the
space-15
borne Scanning Multichannel Microwave Radiometer (SMMR, 1979–1987) and the Special Sensor Microwave/Imager (SSM/I, 1988–2007) negative trends in Northern Hemisphere sea ice extent encompass all months (Serreze et al., 2007). The sum-mer and autumn of 2007 serve as exclamation points on these trends, with ice extent falling to new record lows (Comiso et al.,2008;Stroeve et al.,2008). Interestingly, this
20
remarkable event was attended by record summer surface snowmelt over the Green-land ice sheet, also punctuating a general trend. This is seen in the analyses of both
Tedesco(2007a) and Mote(2007). The record identified in the former study is based on an annual surface melting index (MI, the product of melt area and the number of melting days) for the part of the ice sheet above 2000 m, based on SSM/I data. The
25
TCD
2, 383–397, 2008Extreme surface melt over southwestern Greenland in 2007 M. Tedesco et al. Title Page Abstract Introduction Conclusions References Tables Figures ◭ ◮ ◭ ◮ Back Close Full Screen / Esc
Printer-friendly Version Interactive Discussion assessed from a time series combining records from SSM/I, SMMR and the Electrically
Scanning Microwave Radiometer (ESMR, 1973, 1974 and 1976). The present paper addresses the causes of the record 2007 surface melt.
Variations in the extent and duration of summer melt over Greenland reflect a suite of processes intimately tied to air temperature and the surface energy balance. Horizontal
5
atmospheric heat transports are important through impacts on the longwave radiation to the surface and vertical turbulent heat fluxes. Cloud cover reduces shortwave ra-diation to the surface, but tends to increase the downwelling longwave component. Surface albedo is key, through both influencing solar radiation absorbed by the surface and by modulating cloud radiative forcing. Albedo can be highly variable, and tends to
10
decrease through the melt season as snow grain sizes increase as a consequence of constructive metamorphism.
We evaluate mechanisms contributing to the record surface melt identified by
Tedesco(2007a) through analysis of surface air temperature and circulation fields from the National Centers for Environmental Research (NCEP/NCAR) reanalysis (Kalnay et
15
al.,1996) in conjunction with anomalies in components of the surface energy balance depicted by the regional climate model MAR (for Mod `ele Atmosph ´erique R ´egional) (Fettweis, 2007). We focus first on the ice sheet as a whole and then turn attention to its southwest portion, where surface melt anomalies reached their largest positive values.
20
2 Surface melting for summer 2007
The microwave brightness temperature over dry snow is relatively low compared to when snow is wet. When snow melts, liquid meltwater forms in the snow pack and an increase in the emitted microwave radiation occurs (Ulaby and Stiles, 1980), mainly as a consequence of the increased imaginary part of snow permittivity which, in turn,
25
also leads to an increase in the absorption. Changes in melt duration and extent over Greenland have been examined via various techniques using passive microwave data,
TCD
2, 383–397, 2008Extreme surface melt over southwestern Greenland in 2007 M. Tedesco et al. Title Page Abstract Introduction Conclusions References Tables Figures ◭ ◮ ◭ ◮ Back Close Full Screen / Esc
Printer-friendly Version Interactive Discussion including the seasonal change in emissivity (Mote and Anderson,1995;Mote,2007),
the frequency dependence of emissivity (Abdalati and Steffen, 1997; Steffen et al.,
2004) and the diurnal change in brightness temperature using ascending and descend-ing orbital passes (Tedesco,2007a,b).
Tedesco (2007a) made use of SSM/I brightness temperatures at 19.35 GHz,
hori-5
zontal polarization, available at 25 km resolution from the National Snow and Ice Data Center (Armstrong et al.,1994). Building onTedesco(2007a), panels a and b of Fig.1
show, respectively, the spatial distribution of melting day anomalies in 2007 (number of melting days in 2007 at each grid cell minus the average for the period 1988–2006) and time series of the annual MI for the ice sheet as a whole (gray bars) and for
re-10
gions above 2000 m (black bars). To obtain the annual MI, the number of melting days for each pixel is first multiplied by the pixel area (∼625 km2). These values are then summed for all pixels experiencing melt. Panels c and d show the 2007 melt extent (areas where melting occurred for at least one day) and its time series.
For the ice sheet as a whole, the annual MI for 2007 was 30% above average but still
15
well below peak values estimated for 1998 and 2002. However, the MI above 2000 m set a new record of 4 008 750 km2 × days, beating the previous high of 3 486 875 km2 × days set in 1999. From Fig.1a, it is apparent that some areas in the southwest part of the ice sheet experienced melting up to 25–30 days longer than average (redder colors). Updated through 2007, the linear trend in the MI above 2000 m stands at
20
126 487 km2 × days/yr. Note further that 2007 does not stand out in terms of the melt area, either for the ice sheet as a whole or regions above 2000 m (Fig.1c,d). Hence the key feature of 2007 in this analysis is the extreme high melting index at the higher ice sheet elevations.
Mote (2007) presents a map similar to Fig. 1a, but with melting day anomalies for
25
2007 calculated with respect to the longer record (1973–2007) that includes SMMR and ESMR. The major difference compared to Fig.1a is that the area with strong pos-itive departures over southwestern Greenland extends further east. Peak departures are also larger, locally exceeding 50 days with melting. This reflects differences in
TCD
2, 383–397, 2008Extreme surface melt over southwestern Greenland in 2007 M. Tedesco et al. Title Page Abstract Introduction Conclusions References Tables Figures ◭ ◮ ◭ ◮ Back Close Full Screen / Esc
Printer-friendly Version Interactive Discussion both the baseline period for computing anomalies and analysis techniques (notably an
emission model using scattering coefficients that are empirically derived from bright-ness temperatures before the onset of melt each year, seeMote and Anderson(1995) for details).
Instead of a MI (Fig.1b)Mote (2007) provides time series of seasonal melt
depar-5
tures (SMD) assessed for the entire ice sheet, in which daily departures in melt extent, calculated with respect to 1973–2007 means, are summed through each melt season. While functionally similar to the MI ofTedesco(2007a), the SMD approach is designed to mitigate the effects of missing days in the satellite records, most problematic for SMMR and ESMR. From the SMD time series, the record melt of 2007 stands out
10
more prominently than shown in Fig.1b, with 1998 representing the previous record.
3 Addressing the causes of the record melt
Panels a and b of Fig.2show the spatial pattern of 2 m (hereafter surface air) temper-ature anomalies (K) from the NCEP/NCAR reanalysis and as simulated by the MAR, averaged for summer (June through August, JJA) 2007. Anomalies are calculated with
15
respect to 1988–2006 JJA averages. The surface air temperature in the NCEP/NCAR reanalysis represents interpolation between the lowest model analysis level and the modeled surface skin temperature. MAR (Gall ´ee and Schayes,1994) is coupled to the 1-D Soil Ice Snow Vegetation Atmosphere Transfer (SISVAT) scheme (De Ridder and
Gall ´ee,1998). Fettweis(2007) examined a 28-year surface mass balance simulation
20
(1979–2006) over the ice sheet with the MAR at a horizontal resolution of 25 km. For the present paper, we extended this simulation to the end of 2007. Data from the Eu-ropean Centre for Medium Range Weather Forecasts (ECMWF,http://www.ecmwf.int/) ERA-40 reanalysis (1977–2002) and ECMWF operational analyses (2002–2007) were used to initialize meteorological fields at the beginning of the simulation and to force
25
the lateral boundaries every six hours during the simulation.
TCD
2, 383–397, 2008Extreme surface melt over southwestern Greenland in 2007 M. Tedesco et al. Title Page Abstract Introduction Conclusions References Tables Figures ◭ ◮ ◭ ◮ Back Close Full Screen / Esc
Printer-friendly Version Interactive Discussion average over most of the ice sheet. While general agreement is not surprising given
that the NCEP/NCAR and ECMWF systems assimilate the same basic data streams, in contrast to NCEP/NCAR, the largest anomalies from MAR (exceeding 4◦C) coincide closely to the region of peak melting day anomalies seen in Fig.1a. This may reflect the higher resolution of MAR compared to the NCEP/NCAR fields, its more robust
5
treatment of the surface energy balance, as well as differences in the depiction of regional circulation between NCEP/NCAR and the operational ECMWF fields used as boundary forcing for MAR.
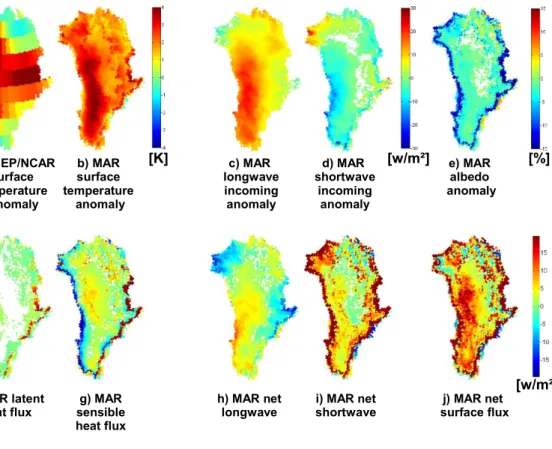
Figure 2c–e shows corresponding anomalies of incoming longwave and shortwave radiation at the surface (W m−2), and surface albedo (%), as simulated from MAR.
In-10
coming longwave radiation anomalies (W m−2) are positive over most of the ice sheet, largest on the western side where they reach +22 W m−2. Air temperature, cloud prop-erties and humidity may all be contributing to these anomalies. Consistent with posi-tive anomalies in simulated cloud optical thickness (not shown), anomalies of incoming shortwave radiation (d) are generally negative, again most prominent over the western
15
side of the ice sheet. Finally, it is clear that surface albedo (e) was below average almost everywhere, but especially along the coast (down to −30%).
The positive anomalies in surface air temperature and downwelling longwave radi-ation simulated with the MAR are consistent with the melt pattern shown in Fig. 1a. Although anomalies in shortwave radiation were slightly negative, the MAR results
20
point to a countering effect by reduced surface albedo. To help further understand the record melt event from the viewpoint of the surface energy budget, the remaining panels in Fig.2show MAR-based anomaly maps of the fluxes of latent heat (f), sensi-ble heat (g), net longwave radiation (h), net shortwave radiation (i) and the net surface energy flux (j), the latter representing the sum of the radiation terms and the two
tur-25
bulent heat fluxes (sensible and latent). Positive anomalies mean more energy to the surface.
Anomalies of the latent heat flux are generally small. Those of sensible heat are neg-ative (lower than −20 W m−2) along the west coast of the ice sheet, positive along the
TCD
2, 383–397, 2008Extreme surface melt over southwestern Greenland in 2007 M. Tedesco et al. Title Page Abstract Introduction Conclusions References Tables Figures ◭ ◮ ◭ ◮ Back Close Full Screen / Esc
Printer-friendly Version Interactive Discussion east coast, and generally small over the interior section except for the west-central
por-tion, where positive values of 5–10 W m−2are found. Pointing to the dominant effects of reductions in surface albedo over cloud cover, anomalies in net shortwave radiation are strongly positive along the coast (more than 20 W m−2). Despite negative anomalies in the downwelling shortwave flux, positive anomalies in net shortwave (5–15 W m−2)
5
also dominate most of the ice sheet except for the highest elevations. Anomalies in net longwave radiation to the surface are strongly positive over the southwest part of the ice sheet.
The overall result is strong positive anomalies in the net surface energy flux over the western part of the ice sheet, consistent with the location of large melting
anoma-10
lies (Fig.1a). These positive net surface energy flux anomalies are in turn driven by the combined effects of positive anomalies in net longwave radiation, sensible heat and net shortwave radiation, the latter linked to negative albedo anomalies. While the albedo anomalies are themselves consistent with the effects of strong melt on increas-ing snow grain size, their presence in the MAR outputs may also be a consequence of
15
low simulated snow accumulation over the winter of 2006–2007 (Fettweis,2007). As melt progressed, it may have exposed bare ice (in the lower elevations) and old snow sooner than in previous years (such processes are treated in the MAR framework).
It is useful to focus further on the region over southwestern Greenland where the most extreme positive melting anomalies occurred. This region (64.5–67◦N, 50–
20
47.5◦W), where the melt duration was 25–30 days above average, is bounded by the square shown in Fig.1a. It coincides closely to the area of peak melting day anomalies shown byMote(2007).
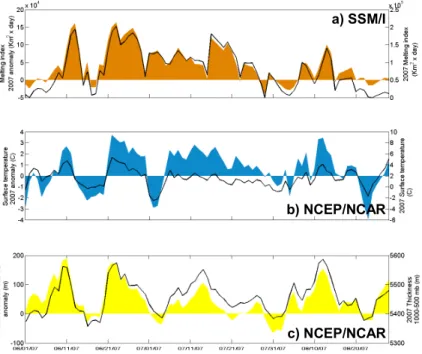
For this analysis, we assess daily values and anomalies of the MI (km2 × days) from SSM/I, NCEP/NCAR estimates of surface air temperature (K) and 1000–500 hPa
25
thickness (m). These are complemented by time series from the MAR of downwelling longwave and shortwave radiation (W m−2), albedo (%), and the net surface energy flux (W m−2). Time series from SSM/I and NCEP/NCAR averaged over the study region are plotted in Fig.3for 1 June through 31 August. As before, anomalies are with respect to
TCD
2, 383–397, 2008Extreme surface melt over southwestern Greenland in 2007 M. Tedesco et al. Title Page Abstract Introduction Conclusions References Tables Figures ◭ ◮ ◭ ◮ Back Close Full Screen / Esc
Printer-friendly Version Interactive Discussion 1988–2006. The 1000–500 hPa thickness is proportional to the mean temperature of
that pressure layer, providing information on tropospheric warmth to complement the surface air temperature estimates.
The MI, surface air temperature and thickness anomalies (Fig. 3a–c) are persis-tently positive through the summer period, with strong imprints of variability at synoptic
5
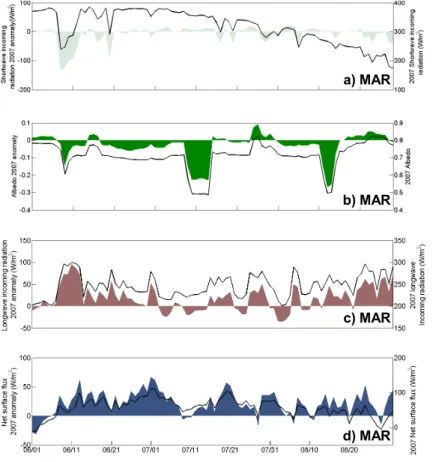
timescales. Anomalies in cloud fraction derived from the Moderate Resolution Spec-troradiometer (MODIS), not shown here, document high variability in both magnitude and sign. MODIS cloud fraction anomalies are referenced to 2000–2006 as the record starts in 2000. Results from MAR show a mix of positive and negative anomalies in the shortwave radiation flux incident to the surface (Fig.4a), but with strong negative
val-10
ues early in the record. Averaged for the summer, and qualitatively consistent with the MODIS results suggesting that cloud fraction over this period was slightly (3%) greater than normal, the shortwave flux was slightly (4 W m−2) below the mean. Anomalies in simulated albedo (Fig.4b) are persistently negative. As expected, modeled anomalies in the incident longwave radiation are persistently positive (Fig.4c). The net surface
15
energy flux anomaly is in turn persistently positive (Fig. 4d). Note the two periods with strongly negative albedo anomalies centered about 11 July and 12 August. While it might be expected that these would correspond to periods when the simulated net surface heat flux was strongly above average, no relationship is apparent.
4 Conclusions
20
We conclude that the record Greenland surface melt in summer 2007 identified by
Tedesco(2007a) and Mote (2007) is a reflection of unusually warm conditions, seen in anomalies of surface air temperature, 1000–500 hPa atmospheric thickness and modeled fields of downwelling longwave radiation and the surface sensible heat flux. These effects, along with reduced surface albedo, are manifested in consistently
posi-25
tive anomalies in the modeled net surface heat flux through the summer season. The 2007 melting index was 2.1 standard deviations (Z-scores) above the mean. However,
TCD
2, 383–397, 2008Extreme surface melt over southwestern Greenland in 2007 M. Tedesco et al. Title Page Abstract Introduction Conclusions References Tables Figures ◭ ◮ ◭ ◮ Back Close Full Screen / Esc
Printer-friendly Version Interactive Discussion given the short record available from SSM/I and SMMR, the question of whether this
melt event is outside of the envelope of natural variability cannot be readily addressed. As introduced earlier, the record surface melt over Greenland in 2007 was attended by a record low in summer Arctic sea ice extent. The latter represents response to a thinning ice pack in recent years coupled with an unusual atmospheric pattern in
5
summer 2007, featuring high pressure over the central Arctic Ocean and low pressure over central and western Siberia. Resultant southerly winds promoted high tempera-tures north of Siberia and transport of ice away from the Siberian coast (Stroeve et al.,
2008). While the NCEP/NCAR data also document southerly airflow over the south-eastern part of the Greenland ice sheet, consistent with the region of strongest melt,
10
this regional pattern shows no obvious link to the pattern associated with the sea ice loss. The common factor was that both the sea ice cover and Greenland were under the influence of warm conditions. Indeed, warm conditions were pervasive over north-ern high latitudes, contributing strongly to the global-averaged temperature in 2007 being the second highest of the instrumental record according to the Goddard Institute
15
for Space Sciences analysis (http://data.giss.nasa.gov/gistemp/2007/).
While melting at high elevations is not contributing to this process, it leads to a re-duction in ice sheet albedo. Interestingly, the 2007 surface mass balance over the ice sheet of −65 km3/yr as simulated by the MAR is the most negative of the period 1979– 2007 (Fettweis, 2007). While strong melt contributed to this negative mass balance
20
anomaly, the larger contribution came from anomalously low snowfall (508 km3/yr wa-ter equivalent).Mote(2007) noted that while the seasonal melt departure index is sig-nificantly correlated with summer temperatures at coastal stations around Greenland, 2007 showed more melt than expected based on these records. The MAR simulation lends credence to his suggestion for a role of reduced albedo.
25
Acknowledgements. This study was supported by NSF grants ARC-0531040, ARC-0531302, UMBC grants 1253 10140 022 00002322, 1253 10140 022 00002264 and 1253 10140 022 00002262, the NASA Crysophere program and the NASA Terrestrial Hydrology program.
TCD
2, 383–397, 2008Extreme surface melt over southwestern Greenland in 2007 M. Tedesco et al. Title Page Abstract Introduction Conclusions References Tables Figures ◭ ◮ ◭ ◮ Back Close Full Screen / Esc
Printer-friendly Version Interactive Discussion
References
Armstrong, R. L., Knowles, K. W., Brodzik, M. J., and Hardman, M. A.: updated current year. DMSP SSM/I Pathfinder Daily EASE-Grid Brightness Temperatures [1988–2007], Boulder, Colorado USA, National Snow and Ice Data Center, digital media, 1994.386
Abdalati, W. and Steffen, K.: Snowmelt on the Greenland Ice Sheet as derived from passive
5
microwave satellite data, J. Climate, 10, 241–251, 1997. 386
Comiso, C., Parkinson, C. L., Gerttsen, R., and Stock, L.: Accelerated decline in the Arctic sea ice cover, Geophys. Res. Lett., 35, L01703, doi:10.1029/2007GL031972, 2008. 384
De Ridder, K. and Gall ´ee, H.: Land surface-induced regional climate change in Southern Israel, J. Appl. Meteorol., 37, 1470–1485, 1998.387
10
Fettweis, X.: Reconstruction of the 1979–2006 Greenland ice sheet surface mass balance using the regional climate model MAR, The Cryosphere, 1, 21–40, 2007.385,387,389,391
Gall ´ee, H. and Schayes, G.: Development of a three-dimensional meso-γ primitive equations model, Mon. Weather Rev., 122, 671–685, 1994. 387
Kalnay, E., Kanamitsu, M., Kistler, R., Collins, W., et al.: The NCEP/NCAR 40-year reanalysis
15
project, B. Am. Meteorol. Soc., 77, 437–470, 1996. 385
Mote, T. L.: Greenland surface melt trends 1973–2007: Evidence of a large increase in 2007, Geophys. Res. Lett., 34, L22507, doi:10.1029/2007GL031976, 2007. 384, 386, 387, 389,
390,391
Mote, T. L. and Anderson, M. R.: Variations in snowpack melt on the Greenland ice sheet based
20
on passive microwave measurements, J. Glaciol., 41, 51–60, 1995. 386,387
Serreze, M. C., Holland, M. M., and Stroeve, J.: Perspectives on the Arctic’s shrinking sea ice cover, Science, 315, 1533–1536, 2007. 384
Steffen, K., Nghiem, S. V., Huff, R., and Neumann, G.: The melt anomaly of 2002 in the Greenland Ice Sheet from active and passive microwave satellite observations, Geophys.
25
Res. Lett., 31, L20402, doi:10.1029/2004GL020444, 2004. 386
Stroeve, J., Serreze, M., Drobot, S., Gearheard, S., Holland, M., Maslanik, J., Meier, W. and Scambos, T.: Arctic sea ice plummets in 2007, EOS, Trans. Am. Geophys. Union, 89, 13–14, 2008. 384,391
Tedesco, M.: A new record in 2007 for melting in Greenland, EOS, Trans. Am. Geophys. Union,
30
88, p. 383, 2007a. 384,385,386,387,390
temper-TCD
2, 383–397, 2008Extreme surface melt over southwestern Greenland in 2007 M. Tedesco et al. Title Page Abstract Introduction Conclusions References Tables Figures ◭ ◮ ◭ ◮ Back Close Full Screen / Esc
Printer-friendly Version Interactive Discussion ature daily variations, Geophys. Res. Lett., 34, L02504, doi:10.1029/2006GL028466, 2007b.
386
Ulaby, F. and Stiles, W.: The active and passive microwave response to snow parameters. 2: water equivalent of dry snow, J. Geophys. Res., 85, 1045–1049, 1980. 385
TCD
2, 383–397, 2008Extreme surface melt over southwestern Greenland in 2007 M. Tedesco et al. Title Page Abstract Introduction Conclusions References Tables Figures ◭ ◮ ◭ ◮ Back Close Full Screen / Esc
Printer-friendly Version Interactive Discussion !"#$%&!&'()*+&,---. /0#1&!&23)"+&4$+&53++6
!"
#"
$"
%"
Fig. 1. (a) Map of 2007 melting days anomalies (number of melting days in 2007 minus the
average number of melting days for the period 1988–2006); (b) annual melting index time series for areas above 2000 m (black) and the entire ice sheet (grey); (c) map of 2007 melt extent (melting occurring for at least one day); (d) melt extent time series for areas above 2000 m (black) and the entire ice sheet (grey).
TCD
2, 383–397, 2008Extreme surface melt over southwestern Greenland in 2007 M. Tedesco et al. Title Page Abstract Introduction Conclusions References Tables Figures ◭ ◮ ◭ ◮ Back Close Full Screen / Esc
Printer-friendly Version Interactive Discussion !"#$%&'($%)*# +,-.!/0# 10230-!1,-0# !452!67 8"#9)*# +,-.!/0# 10230-!1,-0# !452!67 /"#9)*# 654:;!<0# =4/52=4:# !452!67 >"#9)*# +?5-1;!<0# =4/52=4:# !452!67 0"#9)*# !680>5# !452!67 ."#9)*#6!1041# ?0!1#.6,@# :"#9)*# +04+=860# ?0!1#.6,@# ="#9)*#401# +?5-1;!<0 ?"#9)*#401# 654:;!<0 A"#9)*#401# +,-.!/0#.6,@ BCD B;(2ED B;(2ED BFD
Fig. 2. Summer (June–August) anomaly maps, referenced to 1988–2006 means, of: (a) surface
air temperature from NCEP/NCAR; (b) surface air temperature from the MAR; (c–j) incoming longwave radiation, incoming shorwave radiation, albedo, latent heat flux, sensible heat flux, net longwave radiation, net shortwave radiation and the net surface energy flux as simulated by the MAR.
TCD
2, 383–397, 2008Extreme surface melt over southwestern Greenland in 2007 M. Tedesco et al. Title Page Abstract Introduction Conclusions References Tables Figures ◭ ◮ ◭ ◮ Back Close Full Screen / Esc
Printer-friendly Version Interactive Discussion !"#$$%&'
("#)*+,&)*-.
/"#)*+,&)*-.
Fig. 3. Daily time series and anomalies (referenced to 1988–2006 means) of: (a) the daily
melt-ing index; (b) surface air temperature and (c) 1000–500 hPa thickness from the NCEP/NCAR reanalysis for 1 June–31 August 2007, averaged over the area in Greenland showing peak positive melting day anomalies (see box in Fig.1a). Daily values are shown as black lines (right hand scales) while coloring refers to anomalies (left-hand scales).
TCD
2, 383–397, 2008Extreme surface melt over southwestern Greenland in 2007 M. Tedesco et al. Title Page Abstract Introduction Conclusions References Tables Figures ◭ ◮ ◭ ◮ Back Close Full Screen / Esc
Printer-friendly Version Interactive Discussion !"#$%& '"#$%& ("#$%& )"#$%&
Fig. 4. Same as Fig.3 but for (a) incoming shortwave radiation; (b) albedo; (c) incoming longwave radiation and (d) the net surface energy flux simulated by the MAR model. As in Fig.3, anomalies are with respect to 1988–2006.