HAL Id: hal-00140519
https://hal.archives-ouvertes.fr/hal-00140519
Submitted on 6 Apr 2007
HAL is a multi-disciplinary open access
archive for the deposit and dissemination of
sci-entific research documents, whether they are
pub-lished or not. The documents may come from
teaching and research institutions in France or
abroad, or from public or private research centers.
L’archive ouverte pluridisciplinaire HAL, est
destinée au dépôt et à la diffusion de documents
scientifiques de niveau recherche, publiés ou non,
émanant des établissements d’enseignement et de
recherche français ou étrangers, des laboratoires
publics ou privés.
NMR evidence for a strong modulation of the
Bose-Einstein Condensate in BaCuSi_2O_6
S. Kramer, R. Stern, M. Horvatic, C. Berthier, T. Kimura, I.R. Fisher
To cite this version:
S. Kramer, R. Stern, M. Horvatic, C. Berthier, T. Kimura, et al.. NMR evidence for a strong
mod-ulation of the Bose-Einstein Condensate in BaCuSi_2O_6. Physical Review B: Condensed
Mat-ter and MaMat-terials Physics (1998-2015), American Physical Society, 2007, 76 (10), pp.100406(R).
�10.1103/PhysRevB.76.100406�. �hal-00140519�
hal-00140519, version 1 - 6 Apr 2007
NMR evidence for a strong modulation of the Bose-Einstein Condensate in BaCuSi
2O
6S. Kr¨amer,1 R. Stern,2 M. Horvati´c,1 C. Berthier,1 T. Kimura,3 and I. R. Fisher4
1Grenoble High Magnetic Field Laboratory (GHMFL) - CNRS, BP 166, 38042 Grenoble Cedex 09, France 2National Institute of Chemical Physics and Biophysics, 12618,Tallinn, Estonia
3Los Alamos National Laboratory, Los Alamos NM 87545, USA
4Geballe Laboratory for Advanced Materials and Department of Applied Physics, Stanford University, Stanford CA 94305, USA
(Dated: April 6, 2007) We present a 63,65Cu and29
Si NMR study of the quasi-2D coupled spin 1/2 dimer compound BaCuSi2O6in the magnetic field range 13-26 T and at temperatures as low as 50 mK. NMR data in
the gapped phase reveal that below 90 K different intra-dimer exchange couplings and different gaps (∆B/∆A= 1.16) exist in every second plane along the c-axis, in addition to a planar incommensurate
(IC) modulation. 29
Si spectra in the field induced magnetic ordered phase reveal that close to the quantum critical point at Hc1= 23.35 T the average boson density n of the Bose-Einstein condensate
is strongly modulated along the c-axis with a density ratio for every second plane nA/nB≃5. An
IC modulation of the local density is also present in each plane. This adds new constraints for the understanding of the 2D value φ = 1 of the critical exponent describing the phase boundary.
PACS numbers: 75.10.Jm,75.40.Cx,75.30.Gw
The interest in Bose-Einstein condensation (BEC) has been considerably renewed since it was shown to occur in cold atomic gases [1]. In condensed matter, a formal analog of the BEC can also be obtained in antiferromag-netic (AF) quantum spin systems [2, 3, 4, 5] under an applied magnetic field. Many of these systems have a collective singlet ground state, separated by an energy gap ∆ from a band of triplet excitations. Applying a magnetic field (H) lowers the energy of the Mz = −1
sub-band and leads to a quantum phase transition be-tween a gapped non magnetic phase and a field induced magnetic ordered (FIMO) phase at the critical field Hc1
corresponding to ∆min-gµBHc1 = 0, where ∆min is the
minimum gap value corresponding to some q vector qmin
[2, 3, 4, 5]. This phase transition can be described as a BEC of hard core bosons for which the field plays the role of the chemical potential, provided the U(1) symmetry is conserved. Quite often, however, anisotropic interactions can change the universality class of the transition and open a gap [6, 7, 8]. From that point of view, BaCuSi2O6
[9] seems at the moment the most promising candidate for the observation of a true BEC quantum critical point (QCP) [10]. In addition, this system exhibits an un-usual dimensionality reduction at the QCP, which was attributed to frustration between adjacent planes in the nominally body-centered tetragonal structure [11]. The material also exhibits a weak orthorhombic distortion at ≃90 K which is accompanied by an in-plane IC lattice modulation [12]. This structural phase transition affects the triplon dispersion, and the possibility of a modula-tion of the amplitude of the BEC along the c-axis has been speculated based on low field inelastic neutron data [13].
In order to get a microscopic insight of this system, we performed 29Si and 63,65Cu NMR in BaCuSi
2O6 single
crystals. Our data in the gapped phase reveal that the
structural phase transition which occurs around 90 K not only introduces an IC distortion within the planes, but also leads to the existence of two types of planes alter-nating along the c-axis. From one plane to the other, the intra-dimer exchange coupling and the energy gap for the triplet states differs by 16 %. Exploring the vicinity of the QCP in the temperature (T ) range 50-720 mK, we confirm the linear dependence of TBEC with H − Hc1 as
expected for a 2D BEC. Our main finding is that the av-erage boson density n in the BEC is strongly modulated along the c-axis in a ratio of the order of 1:5 for every sec-ond plane, whereas its local value n(R) is IC modulated within each plane.
NMR measurements have been obtained on ∼10 mg single crystals of BaCuSi2O6 using a home-made
spec-trometer and applying an external magnetic field H along the c axis. The gapped phase was studied using a su-perconducting magnet in the field range 13-15 T and the temperature range 3-100 K. The investigation of the FIMO phase was conducted in a 20 MW resistive magnet at the GHMFL in the field range 22-25 T and the tem-perature range 50-720 mK. Except for a few field sweeps in the gapped phase, the spectra were obtained at fixed fields by sweeping the frequency in regular steps and sum-ming the Fourier transforms of the recorded echoes.
Before discussing the microscopic nature of the QCP, let us first consider the NMR data in the gapped phase. The system consists of S = 1/2 Cu spin dimers parallel to the c axis and arranged (at room temperature) on a square lattice in the ab plane. Each Cu dimer is sur-rounded by four Si atoms, lying approximately in the equatorial plane. For Cu nuclei, the interaction with the electronic spins is dominated by the on-site hyperfine in-teraction. For29Si nuclei both the transferred hyperfine
interaction through oxygen atoms with a single dimer and the direct dipolar interaction are important. According
2 125.0 125.2 125.4 125.6 125.8 98.5 86.5 78 68.4 58.4 48.1 37.2 31.5 25.7 17.3 14.3 11.1 8.5 3.1 0 20 40 60 80 100 0.0 0.1 0.2 0.3 0.4 0.5 0.6 [MHz] T [K] 29 Si NMR H = 14.79 T H || c-axis I x 0.5 I x 0.25 B A T [K] M 1 -2 9 H [ M H z ]
FIG. 1: (Color online) Evolution of the normalized29
Si NMR spectra as a function of T in the gapped phase. Below 90 K the line splits into two components, each of them correspond-ing to an IC pattern. Inset: T dependence of the 1st moment (i.e., the average position) for i) the total spectra (squares) and ii) the individual components before they overlap (up and down triangles). The solid and dashed lines are fits for non-interacting dimers.
to the room temperature structure I41/acd [14], there
should be only one single Cu and two nearly equivalent Si sites for NMR when Hkc. As far as29Si is concerned,
one actually observes a single line above 90 K, as can be seen in Fig. 1. However, below 90 K, the line splits into two components, each of them corresponding to an IC pattern, that is an infinite number of inequivalent sites. This corresponds to the IC structural phase transition discovered by X-ray measurements [12]. At 3 K, when T is much smaller than the gap, the spin polarization is zero and one observes again a single unshifted line, at the frequency ν = ν0=29γH defined by the Si gyromagnetic
ratio29γ.
On the 63,65Cu NMR spectra recorded at 3 K and
13.2 T (Fig. 2), however, one can distinguish two dif-ferent Cu sites, denoted A and B. That is, each of the 6 lines of Cu spectrum (for 2 copper isotopes × 3 tran-sitions of a spin 3/2 nucleus) is split into two, which is particularly obvious on the lowest frequency “satel-lite” 63Cu line. The whole spectra can be nicely fitted
with the following parameters: 63νA(B)
Q = 14.85 (14.14)
MHz, η = 0, and KzzA(B)= 1.80 (1.93) %, where νQis the
quadrupolar frequency and η the asymmetry parameter. The Kzz is the hyperfine shift, expected to be purely
orbital since the susceptibility has fully vanished. On in-creasing T the highest frequency65Cu “satellite” lines of
sites A and B become well separated and both exhibit a line shape typical of an IC modulation of the nuclear spin-Hamiltonian. Although the apparent intensities of lines A and B look different, they correspond to the same number of nuclei after corrections due to different spin-spin relaxation rate 1/T2. Since the satellite NMR lines
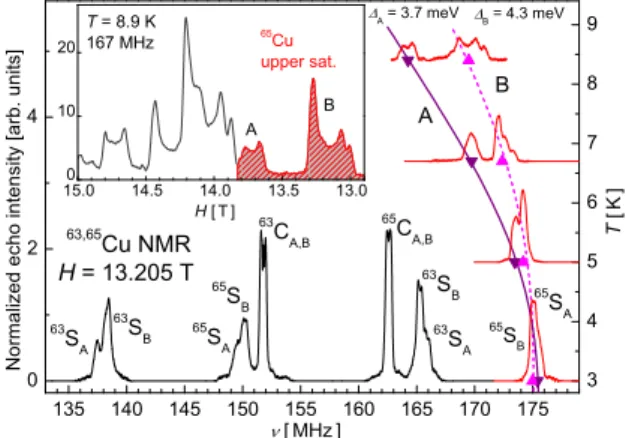
135 140 145 150 155 160 165 170 175 3 4 5 6 7 8 9 0 2 4 65 C A,B 63 C A,B 65 S B 65 S B 65 S A 65 S A 63 S A 63 S B 63 S B A = 3.7 meV B = 4.3 meV 63,65 Cu NMR T [ K ] [MHz] 63 S A A B H = 13.205 T N o r m a l i z e d e c h o i n t e n s i t y [ a r b . u n i t s ] 15.0 14.5 14.0 13.5 13.0 0 10 20 B A 65 Cu upper sat. T = 8.9 K 167 MHz H [T]
FIG. 2: (Color online)63,65Cu NMR spectra of BaCuSi 2O6
in the gapped phase, well below the critical field. The T de-pendence of the high-frequency “satellite” line clearly reveals two different copper sites. From their shifts, the two corre-sponding gap values have been determined. Inset: field sweep spectrum that reveals the IC nature of the line shape for each of the two sites. Shading separates the contribution of the
65
Cu high-frequency satellite from the rest of the spectrum. The analysis of the latter part confirms that the observed line shape has a pure magnetic origin.
at 3 K (the lowest temperature) are narrow, the modu-lation of νQis negligible, meaning that the IC lineshapes
visible at higher temperature are purely magnetic. This is confirmed by the analysis of the spectrum shown in the inset of Fig. 2, which shows that at 8.9 K the broadening of the “central” line is the same as that observed on the “satellites”. Such a broadening results from a distribu-tion of local hyperfine fields: δhz(R) = Azz(R)mz(R) in
which A(R) is the hyperfine coupling tensor and mz(R)
the longitudinal magnetization at site R. Since νQ(R) is
not modulated by the distortion, one expects that the modulation of A(R) is negligible too, A(R) =A. This means that the NMR lineshape directly reflects the IC modulation of mz in the plane.
Keeping constant the νQ parameters obtained at 3 K,
one can analyze the T dependence of the shift Kα zz(T ) of
each component α = A or B according to the formula Kzzα(T ) − Kzzα(0) = Aαzzmdz(∆α, H, T )/H, (1)
where md
z is the magnetization of a non-interacting
dimer, md
z = gcµB/(e(∆α−gcµBH)/kBT + 1) in the given
T range, gc = 2.3 [15], and Kzzα is determined from the
average line position, i.e., the first moment. The best fit was obtained for ∆A(B) = 3.7 (4.3) meV and A
A(B) cc =
-16.4 T/µB. We assumed that AAcc= ABcc, but the values
of ∆ depend only weakly with this quantity. The values are slightly higher than those determined by neutron in-elastic scattering for Qmin = [π, π] [13], which is normal
considering our approximate description. However, the ratio ∆B/∆A = 1.16 is in excellent agreement with the
0 .0 0 .2 0 .4 0 .6 2 3 . 4 1 2 3 .5 1 2 3 .5 9 2 3 . 7 9 2 4 .4 1 2 5 .4 0 .0 0 .2 0 .4 0 .6 2 3 . 0 1 2 3 .2 1 2 3 . 4 1 2 3 .6 1 2 3 .8 1 2 4 .1 1 2 4 .2 1 2 4 .6 1 23.5 24.0 24.5 25.0 25.5 0 50 100 150 200 23.0 23.5 24.0 24.5 0 50 100 150 ( 2 9 H ) [ M H z ] H [ T ] T=50 mK Ix0.5 (a) ( 2 9 H ) [ M H z ] H [ T ] T=720 mK (b) T otal line M 1 M 2 H [T] M 1 [k Hz], M 2 [10 8 s -2 ] T otal line H [T] M 1 M 2 M 1 [k Hz], M 2 [10 8 s -2 ] 23.5 24.0 0 200 400 600 800 H [T] T [m K] H c1 (T=0) = 23.35 T
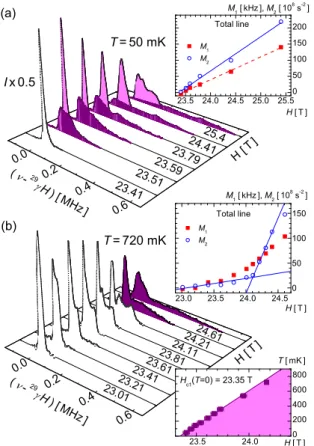
FIG. 3: (Color online) Evolution of the normalized29
Si spec-trum as a function of H at fixed T . The colored spectra correspond to the BEC. a) T = 50 mK: Instead of a simple splitting of the line as expected for a standard BEC, a com-plex pattern appears, typical of an IC distribution of the local hyperfine field. Inset: H dependence of the 1st (M
1, squares)
and 2nd (M
2, circles) moment of the spectra. M1 is
propor-tional to mzand M2to the square of the order parameter. b)
T = 720 mK: The non zero magnetization outside the BEC leads to an IC pattern for fields H ≤ Hc1(T ), where Hc1(T )
is determined from the H dependence of M2, as shown in the
inset. Lower inset: Tcis linear in H − Hc1, as expected for a
2D BEC QCP.
no disorder in the system (as Cu lines at low T are nar-row), and that X-rays did not detect any commensurate peak corresponding to a doubling of the unit cell in the ab plane, our NMR data can only be explained if there are two types of planes with different gap values. Look-ing back at the 29Si spectra in Fig. 1, one also observes
just below 90 K two well separated components, both of them exhibiting an IC pattern. They indeed correspond to the two types of planes, as the T dependence of their positions can be well fit using values close to ∆A and
∆B determined from Cu NMR (inset to Fig. 1). This
means that the 90 K structural phase transition not only corresponds to the onset of an IC distortion in the ab plane, but also leads simultaneously to an alternation of different planes along the c-axis [16], with intra-dimer exchange in the ratio JB/JA∼= ∆B/∆A= 1.16
Let us now recall what is expected from a microscopic point of view in the vicinity of the QCP corresponding to the onset of a homogeneous BEC for coupled dimer sys-tems. As soon as a finite density of bosons n is present (H > Hc1 = ∆min/gµB), a transverse staggered
magne-tization m⊥ (⊥ to H) appears. Its amplitude and
direc-tion correspond respectively to the amplitude and phase of the order parameter. At the same time, the longitu-dinal magnetization mz is proportional to the number of
bosons at a given temperature and field, this latter play-ing the role of the chemical potential. Due to the appear-ance of a static m⊥, the degeneracy between sites which
were equivalent outside the condensate will be lifted and their corresponding NMR lines will be split into two. To be more specific, we consider a pair of Si sites situated in the ab plane on opposite sides of a Cu dimer. Outside the condensate, and in the absence of the IC modula-tion, they should give a single line for H k c. Inside the condensate the NMR lines of this pair of Si sites will split by ±29γ|A
z⊥|m⊥ because their Az⊥ couplings are
of opposite sign. Obviously, observing a splitting of lines requires the existence of off-diagonal terms in the hyper-fine tensor. Such terms are always present due to the direct dipole interaction between an electronic and the nuclear spin, which can be easily calculated.
Instead of this expected simple line splitting, the spec-tra of Fig. 3a reveal a quite complex modification of the line-shape when entering the condensate. The narrow single line, observed at 23.41 T at the frequency ν0,
which corresponds to a negligible boson density, sud-denly changes into a composite line-shape including a narrow and a broad component. The spread-out of the broad component increases very quickly with the field. The width of the narrow component also in-creases, but at a much lower rate. Both peculiar broad-enings are related to the IC modulation of the boson density n(R) due to the structural modulation. To be more precise, a copper dimer at position R has in to-tal 4 Si atoms (denoted by k = 0,1,2,3) situated around in a nearly symmetrical square coordination. The ab-solute values of the corresponding hyperfine couplings will thus be nearly identical, and we will also neglect their dependence on R. These 4 Si sites will give rise to four NMR lines at the frequencies 29ν
k(R) = ν0 +
ν1(R) + ν2,k(R), where ν1(R) = 29γAzzgµBn(R) and
ν2,k(R) =29γAz⊥m⊥(R) cos(φ − kπ/2). Note that ν2,k
only exists when the bosons are condensed, that is when there is a transverse magnetization m⊥pointing in the
di-rection φ. In a uniform condensate m⊥is proportional to
√
n near the QCP, since the mean field behavior is valid in both, 2D and 3D. We assume that only the amplitude of the order parameter is spatially modulated, and that m⊥(R) ∝pn(R). The line shape is the histogram of the
distribution of29ν
k(R), convoluted by some broadening
due to nuclei – nuclei interaction.
4 NMR lines at fixed T values and variable H: the average
boson density n(H, T ), the field Hc1(T ) corresponding to
to the BEC phase boundary, and the field dependence of the BEC order parameter (for T close to zero). The aver-age number of bosons n per dimer is directly proportional to the first moment M1(i.e., the average position) of the
line: M1 = R ∞
−∞(ν − ν0)f (ν)dν = 29γA
zzgµBn(H, T ),
where the line shape f (ν) is supposed to be normalized. The second moment (i.e., the square of the width) of the line M2 = R
∞
−∞(ν − ν0 − M1)
2f (ν)dν has two origins:
the broadening due to the IC distribution of (n(R)-n), and that due to the onset of m⊥ ∝pn(R) in the
con-densate. When increasing H at T ≃ 0, the condensation occurs as soon as bosons populate the dimer plane. This is observed in the inset of Fig. 3a at T = 50 mK. Both M1(n) and M2(m⊥) vary linearly with the field and the
extrapolation of M2 to zero allows the determination of
Hc1 at 50 mK. For higher temperatures a thermal
pop-ulation of bosons n exists and increases with H before entering the BEC phase. As a result both M1 and M2
increase non-linearly with H, as shown in the upper in-set of Fig. 3b. However, the increase of M2(H) shows
two clearly separated regimes and allows the determina-tion of Hc1(T ) as the point where the rate of change of
M2(H) strongly increases due to the appearance of m⊥.
Applying this criterion to all temperatures, we were able to determine the field dependence of TBEC(lower inset of
Fig. 3b) and define precisely the QCP at Hc1 = 23.35 T.
In agreement with the torque measurements [11], we find a linear field dependence. This is the signature of a 2D BEC QCP, where Tc ∝ (H − Hc1)φ with φ = 2/d and
d = 2 [17].
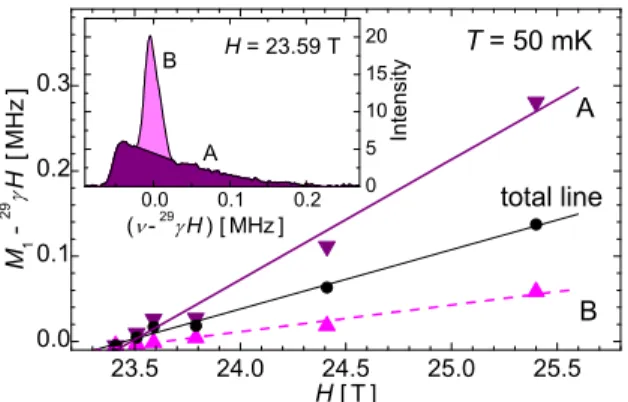
This analysis, however, does not take into account the specificity of the line shapes, which are related to the ex-istence of two types of planes with different energy gaps. A careful examination of the spectra clearly reveals that they correspond to the superposition of two lines exhibit-ing different field dependence at fixed T value. For sake of simplicity, we have made a decomposition only for the spectra at 50 mK, as shown in the inset to Fig. 4. Clearly, one of the components remains relatively narrow with-out any splitting, whereas the other immediately heav-ily broadens in some sort of triangular line shape. The field dependence of M1of the two components, shown in
Fig. 4, reveals that they differ by a factor of 5. This is attributed to the difference by a factor of 5 in the cor-responding average populations of bosons. If there were no hopping of bosons between A and B planes, the B planes should be empty for the range of field such that ∆A < gµBH < ∆B. Although the observed density of
boson is finite in the B planes, it is strongly reduced, giving rise to a strong commensurate modulation of n along the c-axis. According to [11], the hopping along the c-axis of bosons in the condensate is forbidden by the frustration, and can only occur as a correlated jump of a pair. However, this argument does not take into
23.5 24.0 24.5 25.0 25.5 0.0 0.1 0.2 0.3 T = 50 mK A B total line M 1 -2 9 H [ M H z ] H [T] 0.0 0.1 0.2 0 5 10 15 20 H = 23.59 T ( 29 H) [MHz] B A I n t e n si t y
FIG. 4: (Color online) Using a simple decomposition of the spectra into two components as shown in the inset, we deter-mined the 1stmoments of the29Si lines corresponding to the different types of planes A and B. From the slopes of their field dependence, the ratio of the average boson density is found equal to nA/nB≃5.
account the IC modulation of the boson density. In conclusion, this NMR study of the 2D weakly cou-pled dimers BaCuSi2O6reveals that the microscopic
na-ture of the BEC in this system is much more complicated than first expected. Two types of planes are clearly evi-denced, with different intra-dimer J couplings and a gap ratio of 1.16. Close to the QCP we observed that the density of bosons, which is IC modulated within each plane, is reduced in every second plane along the c-axis by a factor of ≃ 5. This provides new constraints for the understanding of the quasi-2D character of the BEC close to the QCP.
We thank S.E. Sebastian, C.D. Batista and T. Gia-marchi for discussions. Part of this work has been sup-ported by the European Commission through the Euro-MagNET network (contract RII3-CT-2004-506239), the Transnational Access - Specific Support Action (contract RITA-CT-2003-505474), the Estonian Science Founda-tion (grant 6852) and the NSF (grant DMR-0134613).
[1] M.H. Anderson et al., Science 269, 198 (1995). [2] I. Afflek, Phys. Rev. B 43, 3215 (1991).
[3] T. Giamarchi and A.M. Tsvelik, Phys. Rev. B 59, 11398 (1999).
[4] T. Nikuni et al., Phys. Rev. Lett. 84, 5868 (2000). [5] H. Tanaka et al., J. Phys. Soc. Jpn. 70, 939 (2001). [6] J. Sirker, A. Weiße, O.P. Sushkov, Europhys. Lett. 68,
275 (2004).
[7] M. Cl´emancey et al., Phys. Rev. Lett. 97, 167204 (2006). [8] S. Miyahara et al., cond-mat/0610861.
[9] M. Jaime et al., Phys. Rev. Lett. 93, 087203 (2004). [10] S.E. Sebastian et al., Phys. Rev. B 74, 180401(R) (2006). [11] S.E. Sebastian et al., Nature. 441, 617 (2006).
[12] E. Samulon et al., Phys. Rev. B 73, 100407(R) (2006). [13] Ch. R¨uegg et al., Phys. Rev. Lett. 98, 017202 (2007). [14] K.M. Sparta and G. Roth, Act. Cryst. B. 60, 491 (2004). [15] S.A. Zvyagin et al., Phys. Rev. B 73, 094446 (2006). [16] This does not introduce any superstructure peak along
contains four planes along the c-axis. Only the form fac-tor, which has not been studied in details below 90 K, should be slightly affected.