A CRITICAL REVIEW OF FINANCING OPTIONS FOR RETIREMENT HOUSING
by
KEVIN MICHAEL HASSEY B.S., Marketing Boston College Newton, Massachusetts (1979) and M.S., Business Administration Carnegie Mellon University
Pittsburgh, Pennsylvania (1981)
Submitted to the Department of Urban Studies and Planning in Partial Fulfillment of
the Requirements of the Degree of
Master of Science in Real Estate Development at the
Massachusetts Institute of Technology October 1987
S)Kevin
M Hassey 1987The authors hereby grant to MIT permission to reproduce and to distribute copies of this thesis document in whole or in part.
Signature of Author
Department of Urban Studies hna Pladning, October 17,1987
Certified by
Marc Louargand, Visiting Associate Professor, Urban Studies and Planning, Thesis Supervisor
Accepted by
Michael Wheeler, Chairman of Interdepartmental
Degree Program in Real Estate Development 'MACHUSETTS INSTITUTE OF TECHNOLOGY
JUL
29
1987
ABSTRACT
This thesis focuses on the financing of retirement
housing. It presents a review of the industry, the major financing options, develops a framework for analysis and susequently presents a critical review of each option. The market for retirement housing is large and growing. The number of individuals over 65 has grown from 3 million at the turn of the century to 28 million today. By the year 2030, there will be 65 million individuals,
or one in five Americans, over 65 years of age.
Many individuals within this group require assistance in daily living. This need for assistance has created a need for specialized facilities which can provide the required services. The facilities are typically 200 -300 units and provide an array of services including social,
transportation and dining and other daily living services. Lenders are reluctant to finance retirement housing. They view the industry as relatively new and the product as highly specialized with significant operational
complexity. Current and potential financiers include conventional banks, FHA programs, tax exempt issues, pension funds and syndications.
Success in raising funds for elderly housing has been achieved primarily in three areas. More specifically, fund raising appears to have been successful through consumer based limited partnerships, conventional bank lending when a lendee has a pre-existing relationship with the bank and government insured FHA proposals. The cost of funds generated has been high and reflective of the risk associated with retirement housing. Positives and negatives of each financing option are outlined in this thesis and a developer should review them to determine which financing option works best for his or her
particular organization.
Thesis Supervisor: Marc Louargand
Title: Visiting Associate Professor of Urban
Studies and Planning
TABLE OF CONTENTS
INTRODUCTION 3
OVERVIEW OF ELDERLY MARKET 4
CHARACTERISTICS OF ELDERLY 9
REAL ESTATE PRODUCTS SERVING THE ELDERLY 12
DISCUSSION OF FINANCING OPTIONS
-- OVERVIEW 18
-- CONVENTIONAL DEBT 20
-- FHA FINANCING 25
-- TAX EXEMPT FINANCING 29
-- PENSION FUND FINANCING 33
-- PUBLIC STOCK OFFERINGS 35
-- SYNDICATION 38
EXAMPLES OF FINANCING OPTIONS
-- OVERVIEW 40
-- CONVENTIONAL DEBT 42
-- FHA FINANCING 43
-- TAX EXEMPT FINANCING 44
-- PENSION FUND FINANCING 45
-- PUBLIC STOCK OFFERINGS 46
-- SYNDICATION 47
SUMMARY OF FINANCING OPTIONS 48
CONCLUSIONS 55
SUMMARY OF TABLES AND FIGURES PAGE TABLES
TABLE 1: "ELDERLY HOUSING GROWTH BY SUB-GROUP" 6
TABLE 2: "NEED BASED ELDERLY POPULATION GROWTH" 7
TABLE 3: "RENT CAPACITY OF THE ELDERLY" 10
FIGURES
FIGURE 1: "NUMBER OF PEOPLE 65+" 4
FIGURE 2: "PERCENT NEEDING FUNCTIONAL ASSISTANCE" 5 FIGURE 3: "PROVIDER OF OPERATIONS SERVICES" 14
INTRODUCTION
This thesis addresses questions about retirement housing. More specifically, it addresses the questions "What options are available for financing retirement housing?",
" Which ones are being well received in the marketplace?"
and "Which options make most sense from the point of view of the developer?".
An overview section presents a summary of the industry as
a prelude to the discussion of financing options. It
reviews the market size, characteristics and concerns of
the target consumer, differing types of elderly real
OVERVIEW
The Elderly Housing Market
America is aging. Since 1900, its population over the age of 65 has increased nearly ten-fold from 3 million to 28 million people. By 2000, 35 million people will be over 65, and by 2030, when the baby boomers of the 1950s and 1960s hit retirement age, the elderly population will have more than doubled to 65 million people. This means that nearly one in five Americans will be over 65 in 2030. Details of this age distribution follow in Figure 1. (1)
FIGURE 1
PROJECTED GROWTH IN SENIOR POPULATION, 1985-2020 Millions and Owr 60 50 Age 5 74 Agv 7561 10 0 1985 1990 2000 2010 220
Source: American Association
Administration on Aging, U.S. Human Services, 1984
of Retired Persons and Department of Health and
The elderly market consists of three submarkets; the "go-go" market (age 65-74), the "slow-go" market (age 75-84) and the "no-go" market (85 and older). The primary difference between segments is the need for assistance in daily living. Typical types of assistance include help in dressing, bathing or taking of medicines. Approximately 7% of the "go-go" market requires assistance. Over twice as many "slow-go" individuals require assistance (16%) and over one third (39%) of the "no-go" market requires assistance in daily living as depicted in Figure 2. (2)
FIGURE 2
Percent Needing Functional Assistance, By Age: 1979-80* 40 -30 -20 10 -7% 3% 01% M 0 18-44 45-64 05-74 75.84 85+
Source: American Association of Retired Persons and
Administration on Aging, U. S. Department of Health and Human Services, 1984
Growth in the elderly population during the next 25 years will be skewed towards the "no-go" segment. More
specifically, while the size of the "go-go" and "slow-go"
markets will increase 24% and 42%, respectively, between
now and the year 2010, the size of the "no-go" market will
increase by 130% from 2.7 to 6.2 million individuals. After 2010, growth in the elderly population will begin to
skew back towards the "go-go" elderly as the baby boom
generation begins to enter the retirement market. This distribution of growth is outlined in Table 1. (3)
TABLE 1
ELDERLY HOUSING GROWTH BY SUB-GROUP ---(millions of people
-"GO-GO" "SLO
indicia versus base W-GO" "NO-GO" year) TOTAL % CHG. 1985 16.7 BASE 1990 19.0 (114) 2000 19.4 (116) 2010 20.8 (124) 2020 30.0 (180) Source: American Administration on % CHG. 8.6 BASE 10.0 (116) 11.6 (135) 12.2 (142) 14.3 (166) Association Aging, U. S. # % CHG. # % CHG. 2.7 BASE 28.0 BASE 3.5 (130) 32.5 (116) 4.9 (182) 34.9 (125) 6.2 (230) 39.2 (140) 7.1 (263) 51.4 (184)
of Retired Persons and
Department of Health and Human Services, 1984
The growth in elderly needing assistance in daily living will double over the next thirty five years and this
growth will be skewed heavily towards the "no-go" segment.
More specifically, when applying the forementioned
propensities to need assistance in daily living to the
projected population for each segment, we find that the
number of people needing assistance will double between
now and 2020 from 3.6 to 7.2 million individuals.
Approximately 1.8 million (50%) of these people will be
part of the "no-go" market while the remaining 1.8 million individuals will be split equally between the "go-go" and "slow-go" markets as outlined in Table 2.
TABLE 2
NEED BASED ELDERLY POPULATION GROWTH
(millions of people; changes versus base year) "GO-GO" "SLOW-GO" "NO-GO" TOTAL
YEAR # INCR. # INCR. # INCR. # INCR.
1985 1.2 BASE 1.4 BASE 1.0 BASE 3.6 BASE
1990 1.3 +.1 1.6 +.2 1.4 +.4 4.3 +.7
2000 1.4 +.2 1.9 +.5 1.9 +.9 5.2 +1.6
2010 1.5 +.3 2.0 +.6 2.4 +1.4 5.9 +2.3
2020 2.1 +.9 2.3 +.9 2.8 +1.8 7.2 +3.6
Source: American Association of Retired Persons and
CHARACTERISTICS OF THE ELDERLY
The elderly do not move frequently, and when they do, they do not move far. Approximately 17% of elderly persons changed their residence between 1975 - 1979 compared with 40% of the general population. Only one fifth of those that did move (or 4% of the entire elderly population) relocated to a different state. In fact, most movers
stayed within their original county of residence. (4)
The reasons that most elderly do not move are; 1)
satisfaction with their current home - a home they have typically lived in for many years; 2) the proximity of their home to family and friends; and 3) the comfort of knowing an area and how to "get around". Among the small segment that do move a sizeable distance, the overwhelming reason is to be closer to another family member.
As a group, the elderly are affluent. Although their wealth is primarily driven by home equity, over one third of households 70 and over do have cash incomes of $15,000 or more. In terms of home equity, over 70% of households over 65 own their own home, with over 85% owning them free and clear. If the average homeowner sold his home and
invested the net proceeds at 10% per year, 23% have
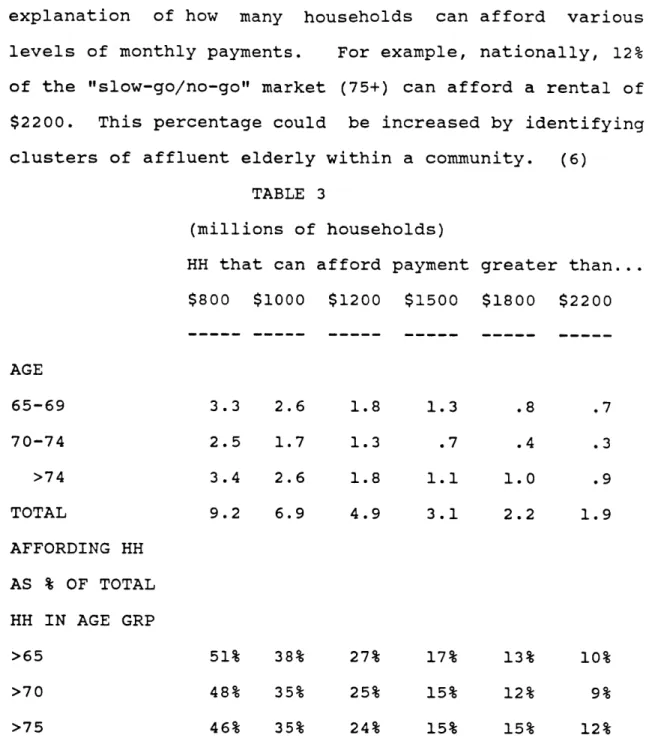
Table 3, "Rent Capacity of The Elderly", gives a further
explanation of how many households can afford various levels of monthly payments. For example, nationally, 12% of the "slow-go/no-go" market (75+) can afford a rental of $2200. This percentage could be increased by identifying clusters of affluent elderly within a community. (6)
TABLE 3
(millions of households)
HH that can afford payment greater than... $800 $1000 $1200 $1500 $1800 $2200 AGE 65-69 3.3 2.6 1.8 1.3 .8 .7 70-74 2.5 1.7 1.3 .7 .4 .3 >74 3.4 2.6 1.8 1.1 1.0 .9 TOTAL 9.2 6.9 4.9 3.1 2.2 1.9 AFFORDING HH AS % OF TOTAL HH IN AGE GRP >65 51% 38% 27% 17% 13% 10% >70 48% 35% 25% 15% 12% 9% >75 46% 35% 24% 15% 15% 12%
Source: Real Estate Research Corporation Analysis of Data from Susan Wachter, University of Pennsylvania
The elderly market is skewed towards widowed females.
Over two thirds of the "slow-go/no-go" market is female, 68% of those females are widows and 52% live alone. Typically, these women might see family members who live nearby several times a month, but have no desire to live with them. For perspective, in retirement centers today, women outnumber men by a ratio of four to one. (7)
Interviews with the elderly and facility operators
indicate the "go-go" segment is primarily concerned with
lifestyle. Typically, they still lead a highly active
life and consider moving into a retirement community only inasmuch as that environment enhances or compliments that
active lifestyle. While this group might be concerned
about future assistance in daily living, this concern is typically secondary to lifestyle issues.
Consumer and facility operator interviews indicate the
"slow-so/no-go" market is concerned about the future.
This group (75+) either currently needs assistance in daily living or perceives that this need is "around the corner" and planning for it is important. They have a
controlling desire to maintain their independence
throughout their lives and look at a retirement facility
as a way of preserving that independence. Secondary
concerns might be rising property taxes and difficulties in getting economical home maintenance assistance.
REAL ESTATE PRODUCTS SERVING THE ELDERLY
Real estate products for the elderly fall broadly into three categories; retirement villages, congregate care and
life care communities. While lifecare communities are
heavily regulated due to their inclusion of a nursing home
, retirement villages and congregate communities are
typically subject to significantly less regulation.
The retirement villages are planned communities that are
usually self-contained, age-segregated housing
developments offering home ownership and rental units in a leisure-oriented environment. They tend to attract people between the ages of 55 and 74 and, in general, their
medically based programs are not exceptionally strong.
These facilities are decreasing in number due to their inability to provide for their residents as they become older and require additional services.
Congregate care communities cater to the "slow-go/no-go" market. Residents are ambulatory but not highly active. Residents have their own apartment and most have kitchens. Amenities include daily food service in a central dining
room, transportation, maid service and organized
activities. While this type of facility may provide
assistance in daily living, it does not have a nursing home on site. Congregate communities are almost always
rental communities.
Lifecare communities generally provide a continuum of care with housing options ranging from independent, detached cottages to skilled nursing units. They also provide a full range of services including central dining, maid
service, transportation and organized activities. Life
care facilities can have either rental or endowment
pricing programs. Endowment programs typically have the endowments take out construction lending, thereby carrying no long term debt, while rental facilities typically carry long term mortgages.
Services required for all elderly can be broken into four major groups; building maintenance services, recreational
services, daily living and health services. All four
types of services are always needed; the difference is in who provides them. The following chart helps make this
FIGURE 3
SERVICES PROVIDED IN ELDERLY LIVING
AT HOME BUILDING UPKEEP RECREA-TIONAL DAILY LIVING SELF SELF SELF ACTIVE COMMUNITY FACILITY FACILITY SELF CONGREGATE FACILITY FACILITY FACILITY LIFECARE FACILITY FACILITY FACILITY HEALTH SEVICES FACILITY Source: American
"Trends and Strategies Health Care Association.
in Long 1985, p.
Term Care," 4
Length of stay typically varies by type of institution.
Residents average 10 years at an active retirement
community before moving to a more skilled environment or
back home. Residents of congregate care and lifecare
facilities average stays of 4 and 15 years, respectively. The abnormally long stay in a lifecare facility reflects
its
ability to care for the elderly in basically any
mental or physical state outside that of acute care.
These differences in average length of stay can impact
financing decisions as it
is important that there be a
timing differential between refinancing and any major
occupancy turnover.
This
is
important
because the
overlapping of financing and major occupancy voids puts
the facility at risk by forcing it to absorb the risk of
refinancing and operational risks at the same time. It is
highly likely
that a facility
allowing refinancing
decisions and significant turnover to occur simultaneously
would find it difficult to refinance the project.
There are currently three major groups of individuals
vying to capture the retirement home business. They are
hospitals, hotel companies and developers. Within the
development community, there are two types of developers
-- larger developers with a national horizon and smaller
developers looking on a much more localized basis.
Hospitals are becoming actively involved in retirement
housing for three reasons. First, they believe retirement
housing has
a large medically based
component and
therefore,
is a logical extension of their profession.
Second, they believe it will diversify their profitability
stays in hospitals. Third, the hospitals believe they bring significant value to a retirement venture both in terms of surplus land and goodwill within a community. Hospitals most often joint venture with a developer and an
example of such an arrangement is the Massachusetts
General Hospital/ Cabot, Cabot and Forbes project in
Westwood, Massachusetts.
Hotel companies are also becoming actively involved in retirement housing. They view the business as principally hospitality based and therefore, believe they bring the highest value added to a retirement facility. The two major hotel companies in the field are Marriott and Hyatt. Unlike its hotel operations, Marriott is acting as both
developer and operator in retirement housing. Hyatt is
joint venturing with developers on a city by city basis and will act as operator only. While these hotel chains have only a handful of "in the ground" retirement projects active, they are committed to significantly higher levels of future activity in both the lifecare and congregate care businesses.
Developer involvement in retirement housing reflects the demographic attractiveness of the elderly market compared with the relative unattractiveness of other segments in the real estate business. Large national developers are tending to develop prototypical facilities and expand the
concept broadly. An example of this is Oxford's "Chambrel" retirement facilty -- a large scale facility with independent, assisted and nursing care to be located throughout the U. S. and marketed at all locations under the "Chambrel" name. Additionally, national developers
tend to have specialized subsidiaries to operate
facilities and therefore, tend to build with the objective of long term ownership.
Smaller developers tend to start from the "bottom up" on a
project by project basis and typically do not have
operational expertise. Smaller developers may attempt to
operate the facility themselves or contract out/joint
FINANCING OF ELDERLY HOUSING
OVERVIEW
Financing of elderly housing is evolving quickly. As the industry grows, it is attracting significant amounts of attention from the financial community and this attention is resulting in a sizeable number of financing programs. However, an important realization is that although the breadth of attention may bode well for the future of retirement housing financing, there are few programs actually financing retirement housing today. The programs that are being developed fall broadly into two areas; debt
and equity programs.
Debt is currently receiving a significant amount of
attention for a variety of reasons. Although the Tax
Reform Act of 1986 has increased the cost of debt to the
investor, and hence the developer, it still remains
attractive. This attractiveness reflects the
favorableness of interest rates today vis-a-vis historical rates and the perception that the developer can maintain a
larger degree of project control through debt versus
equity financing. Examples of debt are financing achieved through commercial banks, FHA coinsurance lending, tax exempt bonds and pension fund financing.
Equity offerings remain the preferred way of raising funds
for some institutions. Typically, these companies are
large entities raising money for multiple projects
simultaneously. Examples of equity financing are public
companies issuing incremental stock (ie, Marriott) and
national syndications.
A discussion of each financing vehicle follows. Each option is evaluated in three critical areas; 1) the cost of funds to the developer; 2) the constraints placed upon the developer by the financier; and 3) the agency costs or organizational costs associated with pursuing and adhering to the guidelines of each financing option. An example of
an application of each financing option follows the
discussion and then a summary and conclusions are
DEBT FINANCING
COMMERCIAL BANKS
OVERVIEW - Interviews with commercial banks indicate that they have a sizeable amount of interest in retirement housing. However, they currently know little about the business, perceive it to be high risk and are approaching
it cautiously.
The first decision commercial banks face is the decision as to what area of the bank should handle the loan application. Should a retirement center loan be handled by the real estate or health care lending group? In most
instances, the decision has been the health care lending group. This is important as it may cause a developer to forge entirely new allegiances in pursuing this type of financing.
Although the banks interviewed had done no retirement
center lending to date, several proposals were actively
under consideration. The objectives of the banks while
reviewing these proposals were; 1) to place money within the risk profile outlined by the bank; 2) to earn a satisfactory return; 3) to service the bank's existing client base and generate new clients; and 4) to maintain the bank's competitive lending position vis-a-vis other
banks in the area.
The banks were especially concerned about maintaining the relationships of their existing client base. Among the
proposals received were proposals from development
companies and developer/hospital ventures with whom the banks had established successful, longterm relationships. The banks clearly valued these relationships highly and
for competitive reasons, were as concerned about not
making the loans as making them. More specifically, the banks believed a refusal would cause the developer or
hospital to take the retirement project to another
institution and that this might become the point of entry through which all of the developer's or hospital's future projects would be financed by the competitive bank.
The banks were particularly frustrated by retirement
center lending proposals. Due to lack of information and the newness of the industry, they were having a difficult time isolating the key criterea with which to evaluate proposals. Consequently, in the short term, the banks had decided to minimize their lending position by; 1) lending only to their existing client base; 2) minimizing their
position in any deals entered into; and 3) learning
quickly about the industry as they were convinced the industry was going to be a major source of future business.
As they see the proposals today, the banks have three
major reservations about retirement housing projects.
First, they see themselves lending on a project without any assurance of occupancy. They see pre-sales as being of little value (although they do still require them) as elderly consumers have a legal right to and often do withdraw after having entered into any such obligation. A frightening realization to banks is that this creates a
situation where the endowments of these as yet
unidentified residents are the takeout to their
construction loan. Second, the banks are concerned that
retirement centers are specialized products with no
alternate use and this makes them extremely apprehensive. Third, they are concerned because they know it would be difficult to recoup their investment via foreclosure as it would create a major negative public relations incident in the community.
COST OF FUNDS - Interviews with commercial banks indicate
that commercial banks charge a significant premium to
finance retirement housing. More specifically, they view
retirement housing as a substantially higher risk than
other types of real estate projects and want to be
compensated accordingly. Additionally, the number of
banks willing to finance retirement housing appears to be minimal at this time, and those that do put significant
constraints on usage of funds.
CONSTRAINTS - The major constraint commercial banks put on retirement housing is the type of financing that they are willing to provide. Typically, they provide construction
financing and are leary of providing any long term
financing. From their perspective, providing long term
financing significantly increases the risk of foreclosure sometime during the life of the loan and this is a risk they are usually unwilling to take.
The banks impose significant constraints on construction lending for retirement housing. The most stringent are; 1) the requirement that a significant percentage (usually 50%) of units be pre-sold prior to construction
commencement; 2) that a specific takeout be identified
prior to construction; 3) control over type of
construction contract and a guarentee of completion; and 4) that bank participation be minimized through layered financing with the bank taking the "last in, first out" position.
ORGANIZATIONAL COSTS - The organizational costs associated with securing bank financing are frontloaded. The biggest challenge is generation of the necessary pre-sales. This typically involves development of extensive site models, opening of a pre-sale office and hiring a sales staff.
This process may require over 12 months of project time.
Other costs center around the structuring and
follow-through on a fairly complicated financial deal. An example of this is the role a bank proposed taking in a
particular proposal from a developer/hospital joint
venture. The venture is proposing building a 300 unit endowment based lifecare center and the hospital is a major client of the bank. To do business with the bank, the venture first had to generate 80% of its financing via
a bond issue. Then, after an involved paperwork and
time-intensive negotiation, the venture and the bank were able to structure a deal where the bank agreed to take the remaining 20% position with priority over the bondholders, a takeout identified, pre-sales completed and construction performance guarenteed.
FHA INSURED MORTGAGES
OVERVIEW - There are two federal programs in existence today that are designed to assist in the funding of elderly housing. The programs are offered by the Federal Housing Authority (FHA) through the Department of Housing and Urban Development (HUD) and broadly fall into two areas -- programs for retirement centers (#221.d.4) and
those for nursing homes (#232). The focus of this
analysis is on the retirement center product, consistent
with the focus of the remainder of the thesis.
FHA programs have been evolving over time. More specifically, HUD recently began approving private lenders to underwrite coinsured FHA loans on retirement housing. HUD's objective is to shift the mortgage underwriting responsibility from the public to the private sector.
Once a loan request has coinsurance approval, it is *
eligible for AAA rated Ginnie Mae securitization via
mortgage backed securities. At this point, 80% of the loan amount is insured by FHA and the remaining 20% by the private sector coinsurance lender.
COST OF FUNDS - The cost of funds under FHA financing is in line with that of conventional financing. Although an FHA mortgage placed with Ginnie Mae will most likely have
a lower interest rate versus a conventional loan, the
interest rate differential is typically offset by; 1)
coinsurance lender fees (usually 2.5-3.5 points); 2) FHA
insurance fees (50 basis points on declining schedule
balances); and 3) Ginnie Mae fees (25 basis points).
The advantage of this progam, although not in interest rate per se, are multiple. First, and most importantly,
these loans are very available at a time when most
providers of financing are leary of retirement housing.
More specifically, there are currently 69 FHA insured
projects "in the ground" around the country at a time when most other financing vehicles for retirement housing are
in the formulation stage. Additionally, they are
available to developers without an extensive track record.
There are other areas where FHA coinsurance approved
mortgages are more liberal than their conventional
counterparts; 1) liability - FHA loans are non-recourse; 2) loan term - FHA provides 40 year assumable permanent
financing vis-a-vis 30 year non-assumable from
conventional sources; 3) loan amount - FHA insures 90% loan to value financing versus 70-75% from conventional sources; and 4) inclusion of developer profitability as a
relevant cost - FHA allows a developer profit to be
included as a reasonable project cost versus conventional sources which may or may not allow its inclusion.
CONSTRAINTS - There are many restrictions associated with FHA insurance. They fall primarily into the areas of project type, financial, amenity and timing constraints.
In terms of project type, the FHA retirement center
program will not insure facilities which charge
endowment/initial entrance fees or facilities which have extensive medical services (NOTE - the separate nursing home FHA program exists for facilities devoted exclusively
to nursing care). As a direct result of these *
constraints, the FHA does not insure life-care facilities.
The financial constraints are threefold. The first is
designed to insure that the developer has a sizeable financial reserve. Specifically, the FHA requires that; 1) developers hold a reserve equal to six months of debt service or 200% of the projected operating deficit (NOTE
-If projected operating deficit equals or exceeds six
months' debt service, BOTH reserves are required); and 2)
operating deficit escrow and/or debt service reserve be
held until sustaining occupancy has been reached and
maintained for 90 days (The reserve requirement can be covered with cash, a letter of credit or a bond). Second, the FHA requires laborers on FHA insured projects to be paid "prevailing" wages (most often synonymous with union wages) as outlined in the Davis Bacon Act.
The final financial constraint is FHA limitation on mortgage amount per unit. This limit is adjusted on a regional basis and is currently $70,000 for an average unit in the Boston area. High land costs have driven the average cost in the Boston area to approximately $100,000
per unit and made this last constraint the most
controlling one in pursuing FHA financing in this area.
Amenity constraints imposed by FRA financing are not
stringent. The restrictions are as follows; 1) each unit
must have a kitchen (including a sink, refrigerator and
burner); 2) each unit must have an individual bathroom; and 3) the unit must be of a "liveable" size. (8)
Timing constraints have traditionally been a major factor in FHA financing. When the government was processing
applications itself, it took approximately a year to
receive approval. However, with the advent of
coinsurance, leadtimes have been reduced to 60 to 90 days.
ORGANIZATIONAL COSTS - Administrative costs and time
required to secure FHA financing is significant and front
loaded. The information required during project
processing is exhaustive, particularly the market area
information requested by FHA. However, once a project is
approved and completed, maintenance of FHA financing
TAX EXEMPT BONDS
OVERVIEW - Tax exempt funding is a growing source of
retirement center financing. However, the benefit
associated with tax exemption has decreased as a result of the decrease in marginal tax rates created by the Tax Reform Act of 1986. There are three types of tax exempt bond financing. First, there are project specific bonds
issued by non-profit agencies such as hospitals to
particpate in their non-profit retirement ventures.
Second, there are project specific tax exempt industrial
revenue bonds issued by non-profit agencies such as
housing authorities on behalf of for-profit developers agreeing to set aside some fixed percentage of units for
low and moderate income individuals. Third, there are
blind pool bond funds issued by for-profit companies for investment in ventures with non-profit partners.
Project specific bonds are typically smaller than their blind pool counterparts. Whether issued in the public or private sector, they originally have only the backing of a priority lien against the property for which the funds were raised. This project specific backing is typically not substantial enough to generate significant interest on Wall Street and creates a need for credit enhancement
or bank -- prior to sale to the investment community.
The financial community has been apprehensive about
providing credit enhancement for project specific
retirement housing bonds. Without this enhancement, bonds
are "junk" and require a high yield in order to be
absorbed in to the marketplace.
Tax exempt blind pools differ sizeably from their project specific counterparts. First, by definition, the projects
are unknown at the time the investor decides to
participate in the venture. Second, the investor does not participate directly in a specific tax exempt project but rather in a fund which subsequently invests in a diverse set of tax exempt ventures. Third, the partnership shares are not enhanced but rather backed solely by the strength of the participating projects. An example of a blind pool
is the Oxford Tax Exempt Fund Limited Partnership. It
invests solely in the company's tax exempt ventures and pays 8.25% on a priority basis and can return a ceiling of
16% with superior performance of its facilities.
COST OF FUNDS - The cost of funds to the project specific entity raising funds through tax exempt bonds typically reflects market levels less the benefit associated with tax exemption plus the cost of enhancement. While there are no retirement center examples of enhancement cost
available, multi-family non-retirement enhancement costs average 2 to 4 points plus 125 to 200 basis points.
The cost of funds in a blind pool typically has three
components; 1) interest payments which have been
unconditionally guaranteed; 2) incremental returns
associated with superior performance; and 3) costs of
underwriting a national issue. The ability of the blind pool operator to successfully field his offering without
enhancement costs most likely reflects the geographical
diversity already built into a national offering.
CONSTRAINTS - The business constraints arising from a
non-profit entity raising tax exempt funds vary. For an entity raising funds on its own behalf (ie, a non-profit
hospital building a retirement center for its own
account), its constraints are simple -- it has to operate the created retirement facility as a non-profit entity.
For the for-profit operator raising tax exempt money
through a local agency such as a housing authority, the
constraints can be significantly more stringent. As
mentioned earlier, this operator has to include units for low and moderate income individuals and families. This requirement may elapse well before bond maturity and
differs from deal to deal. State or locally imposed
prices of market rate units) and most often represent the second major constraint for this type of program.
The major business constraint for a blind pool operator is that he is limited in the type of investment that can be made with the proceeds from the blind pool. A second constraint, which is true for all tax exempt financing, is that pressure exists to generate smooth and significant
flows of current income from operations to satisfy
bondholder/limited partner obligations.
ORGANIZATIONAL COSTS - The organizational costs associated with tax exempt financing are substantial. For whatever reason (ie, non-profit status, low income designation), the government has bestowed a tax exemption status and it wants to insure that the developer fulfills his end of the
deal. As a result, there is a significant amount of
paperwork associated with tax exempt financing. There is also a significant amount of effort required to maintain files and correspondence with bondholders/limited partners throughout the life of the financing.
PENSION FUNDS
OVERVIEW - Pension funds can provide funding for
development, takeout or both. They have not provided any such financing to date. However, interviews with pension fund advisors indicate they believe retirement housing may have a place as a high risk component of a pension fund's real estate portfolio. They are approaching the business cautiously and prefer to be involved in projects on a long term basis. The pension fund advisors interviewed believe the key variables to scrutinize in evaluating retirement housing proposals are micro-market penetration issues and
experience of the proposed management company.
COST OF FUNDS - Since the pension funds believe retirement
projects are high risk, they believe they should be
compensated accordingly. This compensation can take one of two forms; 1) straight debt at a significant rate premium; or 2) debt at a moderate interest rate and a
significant equity kicker.
CONSTRAINTS - The general attitude of the pension fund
advisors is that they want to be involved in major
decisions only and want to leave day to day decisions to
the development team. Consistent with this mindset,
construction financing constraints might involve selection
construction completion guarantee. On a long term basis, the key variables for the pension fund is control of the management company and any refinancing of the facility.
ORGANIZATIONAL COSTS - The administrative effort and time required to secure pension fund financing is not that significant as these deals rely more on relationships than extensive paperwork detail. On a going basis, the venture is required to report on the status of the project to the pension fund advisor who in turn, aggregates information and forwards a report to the pension fund itself on all of its real estate holdings.
EQUITY FINANCING
STOCK OFFERING
There are two types of companies financing congregate care retirement housing through public stock offerings; large organizations such as the Marriott hotel chain and smaller companies devoted exclusively to the development and operation of retirement housing. An example of the latter is the Forum Group of Indianapolis, Indiana.
OVERVIEW - Stock offerings are typically backed by the
full faith and credit of the issuing organization. They are liquid investments and are typically traded on one of
the three major exchanges. From a real estate
perspective, the strength of a stock offering is that it
provides the developer an opportunity to raise funds
through access to the broad based consumer market.
COST OF FUNDS - Cost of funds varies and typically
reflects the strength of the issuing organization.
Marriott is viewed as a market leader who has consistently generated superior returns to investors, and therefore,
expected returns reflect this reduction in risk.
Conversely, the Forum Group, a newly established
retirement housing company, has a minimal track record in an admittedly risky business and therefore, must offer a significantly higher return to attract investors.
CONSTRAINTS - There are two major constraints associated with public offerings. The first is the demand of the shareholder for current income. This is typically not achieved quickly in retirement housing and consequently, ventures in this area may be a drain on profitability of
other company operations, thereby reducing short-term
returns to the shareholder.
In a company devoted exclusively to retirement housing, this inability to generate current income can adversely impact share price. An example is the Forum Group which issued stock last year at $12 a share, has produced no
profits due to long lease-ups, and, although still
perceived to be successful by retirement housing
standards, has seen its share price plummet to its current level of $5 a share.
The second constraint reflects the need to protect the enormous value in a company's goodwill and impacts the major public companies. For example, a company such as Marriott, which attaches an enormous value to its name, will test for years or until it is virtually certain it
has a successful formula for elderly housing before
entering the market. This is because it cannot afford the negative goodwill associated with a project failure.
ORGANIZATIONAL COSTS - Much like the cost of funds, organizational costs vary by the size and earning history
of the company. A company such as Marriott would
typically raise funds in bulk and issuing costs would be 3-5% of the funds raised. However, a smaller company such as Forum Group would spend 8-15% of its issue on issuing
costs. Both companies would incur the cost of
SYNDICATION
OVERVIEW - Syndication of limited partnership shares is
becoming a highly successful way to raise funds for
retirement housing. For example, the National Housing Partnership (NHP) is currently enjoying enormous success
in selling its $175 million Retirement Housing
Partnership. The NHP issue targets both taxable and
non-taxable investors and is currently raising funds for retirement housing at a rate of $750,000 a day. (9) The syndications are typically backed by the projects being
financed by the issue and many are typically not
publically traded and hence, reasonably illiquid.
COST OF FUNDS - Private syndications costs are in line
with those of conventional funding. This form of
financing represents a tradeoff for the developer between the positive of being able to reach the consumer market
versus the negative or premium that must be paid to
compensate for investment illiquidity. An example of a
syndication compensation is the NHP syndication which
offers investors a 13% return. (10)
CONSTRAINTS - The business constraints of syndications
appear to be twofold. First, the facilities purchased with syndication funds need to generate the funding to return the promised returns to investors each and every
year. This can be difficult in a business as volatile as retirement housing. Second, the management of the company is reasonably constrained as to the investments it can make with syndication funds. For example, the NHP is constrained to invest solely in rental retirement housing.
Investors typically require this specificity before
surrendering the liquidity of their investment funds.
ORGANIZATIONAL COSTS - The organizational costs associated with syndication are primarily threefold; 1) the time and cost associated with structuring the deal; 2) the cost of marketing the syndication -- typically 10% of the amount raised; and 3) the cost of communicating with the investor on a regular basis.
COMPARISON OF FINANCING OPTIONS
The following pages illustrate the implementation of each of the financing options. Each page is devoted to a specific type of financing and the deal is held constant across types of financing in order to isolate differences.
The hypothetical development is a 300 unit congregate care facility. It costs $28,500,000 to build or approximately $95,000 per unit. It is a luxury development and rents on average for $2,250 per unit per month. For purposes of simplicity, we assume that it is occupied after one year in all options. The specific assumptions pertaining to
each option are outlined immediately below their
respective financial analyses.
The rates of return are not significantly different across most financing types. However, it is important to note
that there are significant differences as to how the
returns are being generated across options. For example, syndications are generating their return from fees while conventional debt and other options generate their returns primarily through increased backend value.
The one option that does provide a lower return vis-a-vis other returns is that of facilities supported through
financing generated a 14% return versus a 20-30% return for other options. I believe this is due to the public company being less aggressive in generating typical fees
of a public syndication such as organizing and asset
TYPICAL RETIREMENT FACILITY
CONVENTIONAL FINANCING - 12% INTEREST WITH ONE POINT
YEAR I YEAR 2 YEAR 3 YEAR 4 YEAR 5 INCOME
8ROSS INCOMJfE
LESS VACANCY (4Y."
NET INCOME EXPENSES
661 OF NET INCOME AVAILALE FOP DEBT
$8,100,000 $8,535,000 $324,000 $340,200 $7,77t,000 $8,164,800 $8,930,250 $357,210 $8,573,040 $9,76,763 $375,071 $9,001,692 $9,845,601 $393,824 $9,451,777 $5,132,160 $5,388,768 $5,658,206 $5,941,117 $6,238,173 2,4,84 $2,776,032 $2,914-,84 $3,060,575 DEBT PRINCIPAL, INTEREST POINTS COINSURANCE ENHANCEMENT ISSUANCE FEES OTHER
PRE TAX CASH FLOW TAX BENEFIT (28v) AFTER TAX CASH FLOW
($3,156,663) ~$3,156,663) ($,156,6631 ($3,156,6~3~ ($255,000 ($3,000,000) ($767,823) $214,990 ($552,833) ($380,631) $106,577 ($274,054) ($241,829) $67,712 ($174,117) ($96,0B8) $26,905 ($69, 183) ($3. 16 ) $56,941 ($15,943) $40,998 SALE SALE PRICE PAYOFF PRE-TAX SAIN TAX LIABILITY NET SALE PROCEEDS NET CASH FLOW
INTERNAL RATE RETURN
$40,170,051 ($23,623,240) $16,546,811 ($4,373,614) $12,173,196 ($3,000,000) ($552,833) ($274,054) ($174,117) ($69,183) $12,214,194 0.269 ASSUMPTIONS 1. 300 UNIT FACILITY
2. FACILITY COSTS $28.5 MILLION OR $95,000/UNIT 3. DEVELOPER HAS $3.0 MILLION IN DEAL
4. RENT AVERAGES $2250/MONTH; GROWS 5% ANNUALLY
5. EXPENSES --66% OF REVENUES, CONSISTENT WITH L&H STUDY M.
FACILITY OCCUPIED ONE YEAR AFTER DEVELOPER INPUT OF FUNDS 7. INTEREST RATE 12% WITH ONE POINT
8. CAP RATE ON RESALE - 8%.
9. BENEFITS FROM TAX LOSS REALIZED AT DISPOSITION 10. DISPOSITION OCCURS AFTER YEAR 5
TYPICAL RETIREMENT FACILITY
TYPICAL FHA FINANCING - 11% INTEREST WITH 3 POINTS AND INSURANCE FEES YEAP ! INCOME GROSS INC0ME LESS VACANCY (4%) NET INCOE EXPENSES 66 OF NET INCOME AVAILABLE FOP DEET
$8, 1 000
$324, 000 $7,776,000
YEAR 2 YEAR 3 YEAR 4 YEAR 5
$8,505,000 $340,200 $8,164,800 $8,930,250
$357
,10 $8,573,040 $9,376,763 $375,071 $9,001,692 $5,132,160 $5,388,768 $5,658,206 $5,941,117 $2,643,840 $2,776,032 $2,914,834 $3,060,575 $,213,604 PRINCIPAL, INTEREST POINTS COINSURANCE ENHANCEMENT ISSUANCE FEES OTHERPRE TAY CASH FLOW TAX BENEFIT (28%*1 AFTER TAX CASH FLOW
($2,93, 127 ($720,000) ($199,986' ($, 000,000 ($1,209,273) $338, 596 ($870,677) ($2,933,127)($2,93,127)($2,93,127) ($2,933,127) ($199,986) ($199,986) ($199,986) ($357,081) $99,983 $257,098) ($218 ,279) $61,118 ($157,161) ($72,538) $20,311 ($52,227) ($199,986' $80,491 ($22, 537) $57,954 SALE SALE PRICE PAYOFF PRE-TAX SAIN TAX LIABILITY NET SALE PROCEEDS NET CASH FLOW
INTERNAL RATE RETURN
($3,000,000) ($870,677) ($257,098) ($157,161) ($52,227) $12,231,150
0.253 ASSUMPTIONS
1. 300 UNIT FACILITY
2. FACILITY COSTS $28.5 MILLION OR $95,000/UNIT
3. DEVELOPER HAS $3.0 MILLION IN DEAL
4. RENT AVERAGES $2250/MONTH; GROWS 5% ANNUALLY
5. EXPENSES --66% OF REVENUES, CONSISTENT WITH L&H STUDY 6. FACILITY OCCUPIED ONE YEAR AFTER DEVELOPER INPUT OF FUNDS
INTEREST RATE 11% WITH THREE POINTS AND INSURANCE FEES
8. CAP RATE ON RESALE - 8%.
9. BENEFITS FROM TAX LOSS REALIZED AT DISPOSITION 10. DISPOSITION OCCURS AFTER YEAR 5
DEBT $9,845,601 $393,824 $9,451,777 $6,238, 173 $40, 170,.051 ($23,623. 240) $16,546,811 ($4,373,614) $12, 173,196
TYPICAL RETIREMENT FACILITY TYPICAL TAX EXEMPT FINANCINS - 8.25% INTEREST NITH 3 POINTS YEAR 0
AND ENHANCEMENT COiTS
YEAR 1 YEAR 2 YEAR 3 YEAR 4 YEAR 5 INCOME GROSS INCOME LESS VACANCY (4'% NET INCOME EXPENSES 661 OF NET INCOME
AVAILABLE FOR DEBT
$7,200,000 $283,000 $6,912,000 $7,416,000 $302,400 $7,257,600 $7,638,480 $317,520 $7,620,480 $4,561,920 $4,790,016 $5,029,517 $7,B67,634 $333,396 $8,001,504 $8,103,663 $350,066 $8,401,579 $5,280,993 $5,545,042 $2,350,)80 $2,467,584 $2,590.963 $2,720,511 DEBT PRINCIPAL, INTEREST POINTS COINSURANCE ENHANCEMENT ISSUANCE FEES OTHER
PRE TAX CASH FLOW TAX AT 281
AFTER TAX CASH FLOW
($2,318,738$2,3i8,73)$2,318,78)$2,318,738) ($2,318,7381 ($765,000) ($491, 853 ($49,85 ($491,853) ($491,853) ($491,853) ($v,000,000) ($733,658' ($205,424: ($528,234) $148,846 $41,677 $107,169 $272,225 $76,223 $196,002 $401,773 $112,497 $289,277 $537,799 $150,584 $387,215 DISPOSITION SALE PRICE PAYOFF PRE-TAX GAIN TAX LIABILITY NET SALE PROCEEDS
$35,706,712 ($23,623,240)
$12,083, 472 ($3,383,372)
NET CASH FLOW
INTERNAL RATE RETURN
($3,000,000) ($528,234) $107,169 $196,002 $289,277 $9,087,315
0.238 ASSUMPTIONS
1. 300 UNIT FACILITY, 20% OF UNITS TO MODERATE INCOME 2. FACILITY COSTS $28.5 MILLIOLION OR $95,000/UNIT 3. DEVELOPER HAS $3.0 MILLION ON IN DEAL
4. RENT AVERAGES $2000/MONTH: INCREASES 3% ANNUALLY 5. EXPENSES --66% OF REVENUES, CONSISTENT NT WITH L&H STUDY
6. FACILITY OCCUPIED ONE YEAR AFTER DEVELOPER INPUT OF FUNDS 7,. INTEREST RATE 8.251 WITH 175 BASIS POINT ONGOING ENHANCEMENT COST 8. CAP RATE ON RESALE - 81.
9. BENEFITS FROM TAX LOSS REALEALIZED AT DISPOSITION 10. DISPOSITION OCCURS AFTER YEAR 5
TYPICAL PENSION FUND
TYPICAL RETIREMENT FACILITY
FINANCING - 11% INTEREST RATE WITH 501 BACKEND PARTICIPATION YEAR 0 INCONE GROSS INCOME LESS VACANCY 14l) NET INCOME EXPENSES 661 OF NET INCOME AVAILABLE FDP DEBT
Y YEAR 2 YEAR YEAR 4 YEAR 5
$8,10,000 $324,000 $7,776,000 $8,505,000 $340,200 $8, 164,800 $8,930,250 $357,21 $2,573,040 $9,7767 $775,071 $9, 001,692 $5,132,160 $5,388,768 $5,658,206 $5,941,117 $2,643,840 $2,776,02 $2,914,84 $3,060,575 $9,845,601 $393,824 $9,451,777 $6,238,173 DEBT PRINCIPAL, INTEREST POINTS COINSURANCE ENHANCEMENT ISSUANCE FEES OTHER
PRE TAX CASH FLON TAXES
AFTER TAY CASH FLOW
$3,11050,64, f$3115,6641 $3,105,6641 $3,105,664) ($3,105, 664) ($1,500,000) ($461,824) $129,311 ($332,513) ($329,632) $92297 ($237,335t ($190,830) $53,433 ($137,398) ($45,089) $12, 625 ($32,464) $107,940 ($30,223) $77,717 SALE SALE PRICE PAYOFF PRE-TAX GAIN TAX LIABILITY NET SALE PROCEEDS NET CASH FLOW
INTERNAL RATE RETURN
$40,170,051 ($23,623,240) $16,546,811 ($4,373,614) $12,173, 196 ($1,500,000) $332,513) ($237,335) ($137,38) ($32,464) $6,164,315 0.252 ASSUMPTIONS 1. 300 UNIT FACILITY
2. FACILITY COSTS $28.5 MILLIOLION OR $95,000/UNIT 3. DEVELOPER HAS $1.5 MILLION IN DEAL
4. RENT AVERAGES $2250/MONTH; INCREASES 5'. ANNUALLV
5. EXPENSES -- 66% OF REVENUES, CONSISTENT WITH L&H STUDY
6. FACILITY OCCUPIED ONE YEAR AFTER DEVELOPER INPUT OF FUNDS 7. INTEREST RATE 11 WITH 50% BACKSIDE PARTICIPATION
8. CAP RATE ON RESALE - 8%.
9. BENEFITS FROM TAX LOSS REALEALIZED AT DISPOSITION 10. DISPOSITION OCCURS AFTER YEAR 5
TYPICAL RETIREMENT FACILITY
TYPICAL COMMON STOCK OFFERING - DIVIDENDS AT DISPOSITION
YEAR 0 YEAR 1 YEAR 2 YEAR 3 YEAR 4 YEAR 5 INCOME GROSS INCOME $8,100,000 $8,505,000 $8,930,250 $9,376,763 $9,845,601 LESS VAoANC (4%) $324,000 $340,200 t357,210 $375,071 $393,824 NET INCOME $7,776,000 $8,164,800 $8,573,040 $9,001,692 $9,451,777 EXPENSES 66% OF NET INCOME $5,132,160 15,388,768 $5,658,206 $5,941,117 $6,238,173
AVAILABLE FOP EQUITY $2,64,840 $2,776,032 $2,914,834 $3,060,575 $3,21,604 EQUITY PAYMENTS POINTS COINSURANCE ENHANCEMENT ISSUANCE FEES ($1,000,000) OTHER
PRE-SALE CASM FLOW ($28,50000 DISPOSITION
SALE PRICE $40,170,051
PAYOFF $0
PRE-TAX GAIN $40,170,051
TAX LIABILITY ($4,373,614)
NET SALE PROCEEDS
MANAGENENT FEE (5l) $405,000 $425,250 $446,513 $468,838 $492,280 NET CASH FLOW ($29,500,0001 $3,048,840 $3,201,282 $3,361,346 $3,529,413 $39,502,320
INTERNAL RATE RETURN 0.145 ASSUMPTIONS
1. 300 UNIT FACILITY
2. FACILITY COSTS $28.5 MILLION OR $95,000/UNIT
DEVELOPER (MARRIOTT) FINANCES 100% THROUGH STOCK OFFERING 4. RENT AVERASES $2250/MONTH; GROWS 5% ANNUALLY
5. EXPENSES --66% OF REVENUES, CONSISTENTNT WITH L&H STUDY 6. FACILITY OCCUPIED ONE YEAR AFTER DEVELOPER INPUT OF FUNDS 7. INTEREST RATE 12% WITH ONE POINT
8. CAP RATE ON RESALE - 8%.
9. BENEFITS FROM TAX LOSS REALIZED AT DISPOSITION 10. DISPOSITION OCCURS AFTER YEAR 5
TYPICAL RETIREMENT FACILITY
TYPICAL SYNDICATION FINANCING - 131 INTEREST-85% OF BACKEND TO LIMITED PARTNERSHIP YEAR 1 YEAR 2 YEAR 3 YEAR 4 YEAR 5 INCOME GROSS INCrME LESS VACANCY (4%" NET INCOME EXPENSES 66 OF NET INCOCE
AAILABLE FOR E9LITY
$8,100,000 $324,000 $7,776,000 $8,505,000 $340,200 $8,164,800 $8,930,250 $357,210 $8,573,040 $9,376,763 $375,071 $9,001,692 $5,132,160 $5,388,768 $5,658,206 $5,941,117 $2,643,840 $2,776,032 $2,914,834 $3,060,575 EQUITY PA YMENTES ($3,775,521 ($3,775,521($3,775,521) ($3,775,521) ($3,775,521)
PRE TAX CASH FLOW TAX
AFTER TAX CASH FLOW
($400,000) ($1,131,681) ($316,871) ($814,810) ($999,489) ($279,857) ($719, 632) ($860,687) ($240,992) ($619,695) ($714,946) ($200, 185) ($514, 761) ($561,917) ($157,337) ($404,580) SALE SALE PRICE PAYOFF PRE-TAX GAIN TAX LIABILITY NET SALE PROCEEDS FEES
ORBANIZATIONAL (27) MANAGEMENT (5.)
DISPOSITION (2%)
TOTAL FEES
NET CASH FLOW
INTERNAL RATE RETURN
$40,170,051 ($23,623,240) $16,546,811 ($4,373,614) $1,825,979 $570,000 $405,000 $425,250 $446,513 $468,838 $492,280 $1,205,102 $975,000 $425,250 $446,513 $468,838 $1,697,382 ($400,000) ($156,681) ($294,382) ($173,182) ($45,9231 $3,118,781 0320. ASSUMPTIONS 1. 300 UNIT FACILITY
2. FACILITY COSTS $28.5 MILLION OR $95,000 PER UNIT 3. SYNDICATION PUTS UP $400,000 IN START-UP FUNDS 4. RENT AVERAGES $2250/MONTH; INCREASES 5% ANNUALLY J. EXPENSES -66% OF REVENUES, CONSISTENT WITH L&H STUDY 6. FACILITY OCCUPIED ONE YEAR AFTER DEVELOPER INPUT OF FUNDS 7. INTEREST RATE 13%, LIMITED PARTNERS GET 85% OF BACSIDE 8. CAP RATE ON RESALE - OZ.
9. BENEFITS FROM TAX LOSS REALEALIZED AT DISPOSITION
YEAR 0
$9,845,601
$393,824
$9,451,777
COST OF FUNDS
Conventional Debt
-Cost: High, can sometimes decrease rate through
participation
-Type: Construction, shy away from long term financing
-Comments: Lending tends to be highly relationship
oriented
FHA Insured Mortgages
-Cost: Rate slightly below cost of conventional debt -Type: Construction through long term ownership
-Comments: Non-recourse, assumable, 40 year financing
Tax Exempt Financing
-Cost: Face interest rates well below those of
conventional; in line with conventional after enhancement, issuing costs
-Type: Construction through long term ownership
-Comments: Industrial revenue bonds issued in public
sector, blind pools and enhanced financing in private sector
Pension Funds
-Cost: In line with debt: latitude in structuring
debt/equity deals
-Type: Construction through long term financing
-Comments: Interested in business, no lending to date
Public Stock Offering
-Cost: Varies, reflects strength of issuing firm -Type: Limited only as directed in prospectus
-Comments: Issued by larger firms (ie, Marriott) and small firms devoted exclusively to retirement housing (ie, Forum Group of Indianapolis)
Syndication
-Cost: In line with cost of conventional financing
-Type: Construction through long term, purchase of
existing facility
-Comments: Partnerships tend to make most of return
CONSTRAINTS
Conventional Financing -Major Constraints: Pre-leasing, takeout
-Other Constraints: Layered financing, construction
completion guarantee
FHA Financing
-Major Constraints: Extensive financial reserve, cost per unit, type facility - no lifecare or extensive medical
-Other Constraints: Must pay union wages, units need
kitchens
Tax Exempt Financing
-Major Constraints: Industrial revenue bonds, % of units
to low and moderate income families; blind pools and
project specific tax exempts, to run as non-profit
facility
-Other Constraints: Communication and payments to
Pension Funds
-Major Constraints: Control of refinancing and management company goes to pension fund
-Other Constraints: Review required in selecting market research company and construction company
Stock Offerings
-Major Constraints: Demand of shareholder for current
income
-Other Constraints: Profitability drain on other company operations, need to protect corporate goodwill position
Syndication
-Major Constraints: Inability to use funds for any purpose other than that identified in prospectus, difficulty in generating income to make promised yearly payments to partnership
ORGANIZATIONAL COSTS
Conventional Financing
-Major Costs: Development of site models, opening of
office to generate necessary pre-sales
-Other Costs: Effort required to find takeout lender prior to start of construction
FHA Mortgages
-Major Costs: Extensive upfront time required to file and follow-through on FHA application
-Other Costs: Modest time required to maintain FHA
relationship
Tax Exempt Financing
-Major Costs: Adherence with guidelines
government to maintain tax exempt status
-Other Costs: Time and company resources
regularly communicate with bondholders
required
required by
Pension Funds
-Major Costs: Relationship development time and deal
structuring effort with fund advisor
-Other Costs: Monthly reporting to pension fund advisor
Stock Offering
-Major Costs: Cost and effort required to issue stock -Other Costs: Communication with shareholders
Syndication
-Major Costs: Development of partnership structure; Cost and effort required for issuance