HAL Id: hal-00489200
https://hal.archives-ouvertes.fr/hal-00489200
Submitted on 4 Jun 2010
HAL is a multi-disciplinary open access
archive for the deposit and dissemination of
sci-entific research documents, whether they are
pub-lished or not. The documents may come from
teaching and research institutions in France or
abroad, or from public or private research centers.
L’archive ouverte pluridisciplinaire HAL, est
destinée au dépôt et à la diffusion de documents
scientifiques de niveau recherche, publiés ou non,
émanant des établissements d’enseignement et de
recherche français ou étrangers, des laboratoires
publics ou privés.
Holographic laser Doppler ophthalmoscopy
Manuel Simonutti, Michel Paques, José-Alain Sahel, Michel Gross, Benjamin
Samson, Caroline Magnain, Michael Atlan
To cite this version:
Manuel Simonutti, Michel Paques, José-Alain Sahel, Michel Gross, Benjamin Samson, et al..
Holo-graphic laser Doppler ophthalmoscopy. Optics Letters, Optical Society of America - OSA Publishing,
2010, 35 (12), pp.1941. �10.1364/OL.35.001941�. �hal-00489200�
M. Simonutti,1 M. Paques,1 J. A. Sahel,1 M. Gross,2 B. Samson,3 C. Magnain,3 and M. Atlan3
1
Institut de la Vision, Institut National de la Sant´e et de la Recherche M´edicale (INSERM), UMR-S 968. Centre National de la Recherche Scientifique (CNRS) UMR 7210.
Universit´e Pierre et Marie Curie (UPMC) 75012 Paris, France 2
Laboratoire Kastler-Brossel de l’ ´Ecole Normale Sup´erieure, CNRS UMR 8552, UPMC, 24 rue Lhomond 75005 Paris, France
3
Institut Langevin, CNRS UMR 7587, INSERM U 979, Fondation Pierre-Gilles de Gennes, UPMC, Universit´e Paris 7,
ESPCI ParisTech, 10 rue Vauquelin, 75005 Paris, France. (Dated: June 14, 2010)
We report laser Doppler ophthalmoscopic fundus imaging in the rat eye, with near infrared het-erodyne holography. Sequential sampling of the beat of the reflected radiation against a frequency-shifted optical local oscillator is made onto an array detector. Wide-field maps of fluctuation spectra in the 10 Hz to 25 kHz band exhibit angiographic contrasts in the retinal vascular tree without re-quirement of exogenous marker.
OCIS : 170.4470; 170.0110; 170.3340
Retinal blood flow plays a pivotal role in several blind-ing diseases such as diabetic retinopathy and vascular occlusions. While currently available optical instrumen-tation is well adapted for imaging retinal vessels, there are still technological limitations of currently available methods for retinal blood flow measurement that impair their clinical applications. Self-beating intensity fluctu-ations from a laser spot focused in the eye fundus was demonstrated to enable retinal flow assessment [1–3] non-invasively. It paved the way for the development of spa-tial scanning techniques such as confocal spot [4] or line [5] scanning Doppler ophthalmoscopy. Yet, laser Doppler methods for retinal blood flow mapping are still limited in term of velocity resolution and mapping capabilities.
Optical coherence tomography, commonly used for structural retinal layers imaging, was translated to a depth-resolved functional Doppler-contrast technique [6, 7]. Optical micro-angiography further improved depth-resolved Doppler measurements for eye fundus imaging [8]. Such techniques can enable quantitative and direc-tional flow assessment, but vessel segmentation is re-quired [9, 10].
Our approach to functional Doppler imaging is based on the detection of light fluctuations with an array detec-tor. Multiply-scattered light yields Doppler spectra from which the directional information of flow is lost because of wave vector randomization. Nevertheless, it provides a spatially-resolved hemodynamic contrast in low-light il-lumination conditions. In this letter, we demonstrate ex-perimentally the feasibility of wide-field holographic laser Doppler ophthalmoscopy, in vivo.
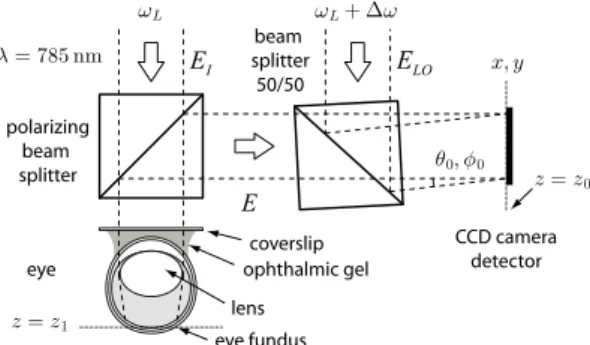
The experimental ophthalmoscope realized for this study is based on the heterodyne imaging scheme de-scribed in [11]. It consists of a Mach-Zehnder laser in-terferometer in off-axis and frequency-shifting configura-tion. The detection scheme is sketched in Fig.1. A laser diode provides the main near-infrared radiation at
wave-FIG. 1: Optical configuration. The eye fundus is illuminated in broad field through the dilated iris. The cornea curvature is compensated by a coverslip and ophthalmic aqueous gel.
length λ = 785 nm, polarized linearly. In the object arm, a polarizing beam splitter cube is used to illuminate the preparation and collect the cross-polarized backscattered light component, in order to increase the relative weight of multiply scattered Doppler-shifted photons with re-spect to photons scattered once [12]. Three adult rats were used for the preparations. Anesthesia was induced by intraperitoneal injection of 100 mg/kg ketamine and 25 mg/kg xylazine (both from Sigma-Aldrich). Topical tropicamide (CibaVision) was administered for pupil di-lation. Each rat was placed on its side under the illumi-nation beam. The head was supported so that the iris was perpendicular to the illumination axis. After admin-istration of topical oxybuprocaine (CibaVision), a cover-slip was applied on a ring surrounding the globe. Methyl-cellulose (Goniosol) was applied as contact medium. The incident optical field EIis expanded to form a plane wave.
Illumination power within 5 × 5 mm2at the object plane is ∼ 1 mW. In the reference arm (local oscillator : LO), an attenuator, a half wave plate, and a beam expander (not shown) are used to control the beam power, polar-ization angle, and to ensure a roughly flat LO
illumina-2 tion of the detector. The optical frequency detuning ∆ω
between the two optical channels is imposed by acousto-optic modulators. The backscattered field E is combined with the LO field ELOwith a non-polarizing beam
split-ter cube. The detuning ∆ω shifts a component of insplit-ter- inter-est of the scattered field temporal fluctuation spectrum within the actual camera bandwidth (temporal hetero-dyning). Moreover, a small angular tilt θ0, φ0 of ∼ 1◦
ensures off-axis mixing conditions that shift the spatial frequency spectrum of the recorded object field (spatial heterodyning). The interference pattern I = |E + ELO|2
is measured by a Sony ICX 285AL charge-coupled device (CCD) array sensor (gain: 3.8 e/count), from which the central 1024×1024 pixels region is readout at 10 Hz. The detector is set ∼ 30 cm away from the object plane. The recorded intensity pattern In at time tn in the detector
plane (z = z0) is : In = |E|2+ |ELO|2 + EE∗ LOe−i(∆ωtn+∆kxx+∆kyy) + E∗E LOe+i(∆ωtn+∆kxx+∆kyy) (1)
where E and ELOare the complex envelopes of the
scat-tered and LO field, respectively. ∆kx = 2πsin(θ0)/λ,
∆ky = 2πsin(φ0)/λ are the projections of the difference
between the LO and signal wave vectors in the transverse (x, y) plane. ∗ denotes the complex conjugate. The two
first terms of the right member of eq. 1 are the self-beating (homodyne) contributions of E and ELO. The
heterodyne signal of interest lies is the third term. The fourth term is the twin-image (ghost) contribution.
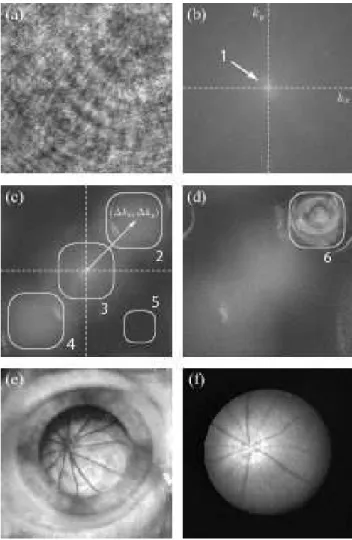
A typical interference pattern In of E beating against
ELO is shown in fig. 2(a). The magnitude of the fast
spatial Fourier transform (FFT) of one recorded frame |FFT(In)|2 mainly carries the LO contribution in high
heterodyne gain regime, when the optical power in the LO channel is larger than in the object channel [fig. 2(b)]. Since the LO beam exhibits flat-field fluctuations, its self-beating contribution is gathered in the low frequency re-gion (1) in reciprocal space (kx, ky). Making the
differ-ence of two consecutive frames before (or after) applying the spatial Fourier transform yields |FFT(In+1− In)|2; it
decreases substantially the relative weight of the LO self-beating term, showing up the object-against-LO self-beating term and the ghost term [regions (2) and (4), respectively, in fig. 2(c)]. The object beam self-beating term also ap-pears, in region 3. Detection noise is assessed in region (5). Because of off-axis geometry, the heterodyne sig-nal contribution is shifted-away, by ±(∆kx, ∆ky), from
self-beating fields contributions. In on-axis geometry (∆kx = 0, ∆ky = 0), all interferometric terms would
overlap spatially. The object field can hence be assessed with much better sensitivity than if measured in either on-axis-only or off-axis-only conditions and used for nu-merical reconstruction of the signal S with a discrete Fresnel transform S = |FFT((In+1− In)ei
π
λ∆z(x2+y2))|2,
FIG. 2: Recorded interference pattern; ∆ω/(2π) = 10 Hz (a). FFT of the recorded frame (b). The dominating noise (1) is gathered in the low spatial frequencies. FFT of the differ-ence of two consecutive frames (c). Heterodyne contributions (2,4), homodyne contributions (3), noise (5). Image focus (6) by Fresnel transform (d). Magnified view of the retina (e). White-light endoscopic view of the retina (f).
where the distance parameter used for free-space back-propagation of the optical field is ∆z = z1−z0= 26.6 cm.
Once accurate focus is found, the fundus image appears as reported in fig. 2(d), in region 6, magnified in fig. 2(e). These Doppler images are time-averaged hSi; an-gular brackets h i account for averaging over 32 frames. The star-shaped vascular tree of the rat eye fundus is clearly visible and consistent with the white-light endo-scopic image performed afterwards in the same prepara-tion, displayed in fig. 2(f).
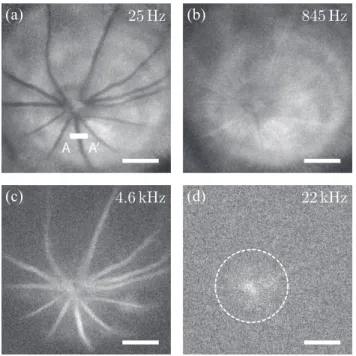
Detuning ∆ω slows down selectively the drift rate of the set of fringes associated to a given Doppler compo-nent, and sets it within the actual camera bandwidth. Frequency-selective eye fundus images hSi of a healthy rat at four LO detunings (25 Hz, 845 Hz, 4.6 kHz, and 22 kHz) are reported in Fig. 3. A contrast reversal is observed between vessels and surrounding retinal tissue
(a)
(b)
(c)
(d)
A A’25 Hz
845 Hz
4
:
6 kHz
22 kHz
FIG. 3: Doppler fundus images at four frequency detunings ∆ω/(2π). Optical power is displayed in logarithmic scale (white is for high signal). [AA′] indicates the measurement region of the lines reported in fig. 4(a). Scale bar, 1 mm.
FIG. 4: (a) hSi against position along [AA′] of fig. 3(a), av-eraged over 15 pixels in the orthogonal direction. Traces cor-respond to logarithmically-spaced detuning frequencies from 10 Hz to 25 kHz. (b) hSi against ∆ω at positions 1, 2, 3, 4 from the center of the vessel to its periphery.
(and most likely in the choroid) from low to high fre-quency detunings [figs. 3(a) and (c)]. Fluctuation spec-tra lines hSi throughout a vessel cross section are re-ported in Fig. 4, as a function of position (a), and as a function of ∆ω, at four locations within the vessel (b); typical spatial standard deviation of hSi are shown in the inset. It can be estimated that choroidal flow signif-icantly contributed to the signal along the retinal vessel section [AA′]. Within this vessel, the Doppler spectrum
is clearly broader from those of immediate surrounding
areas, showing that the retinal flow predominantly con-tributed to the signal in this specific zone. The broadest Doppler signal, which is still visible at 22 kHz in fig. 3(d) is found in the optic nerve head region (circled); it is interpreted as a consequence of vessels orientation and increased density in this area.
In conclusion, we have demonstrated the feasibility of holographic laser Doppler ophthalmoscopy with near in-frared radiation. The illumination power over the whole eye fundus can be kept low (∼ 1 mW). High detection sensitivity, in moderate to high heterodyne gain regime, is achieved by spatiotemporal heterodyning, which en-ables an efficient rejection of parasitic interferometric contributions. Fluctuation spectra discrepancies below 25 kHz between the superficially vascularized regions and the surrounding retinal tissue layers provide an optical contrast suitable for angiographic mapping. A high re-producibility of the signal acquired over up to several hours, over repeated trials, and between different animals is observed. Potential applications are essentially the in-vestigation of retinal and possibly choroidal vascular dis-eases. At the current stage there are yet limitations due to suboptimal lateral, depth, and time resolution, which for instance do not allow heart-beat related flow varia-tions detection. Technical improvements are expected to circumvent these problems.
We acknowledge financial support from Agence Na-tionale de la Recherche (ANR-09-JCJC-0113 grant), Fon-dation Pierre-Gilles de Gennes (FPGG014 grant), Fonda-tion Voir & Entendre, R´egion Ile-de-France, ESPCI and CNRS.
[1] C. E. Riva, G. T. Feke, B. Eberli, and V. Benary. Bidi-rectional ldv system for absolute measurement of blood speed in retinal vessels. Applied Optics, 18:2301–2306, July 1979.
[2] Yoshihisa Aizu, Kouji Ogino, Toshiaki Sugita, Tetsuya Yamamoto, Nobukatsu Takai, and Toshimitsu Asakura. Evaluation of blood flow at ocular fundus using laser speckle. Appl. Opt., 31(16):3020, 1992.
[3] H. Fujii. Visualisation of retinal blood flow by laser speckle flowgraphy. Medical and Biological Engineering and Computing, 32(3):302–304, 1994.
[4] G Michelson, B Schmauss, MJ Langhans, J Harazny, and MJ Groh. Principle, validity, and reliability of scanning laser doppler flowmetry. J. Glaucoma., 5(2):99–105, 1996. [5] R. D. Ferguson, D. X. Hammer, A. E. Elsner, R. H. Webb, S. A. Burns, and J. J. Weiter. Wide-field reti-nal hemodynamic imaging with the tracking scanning laser ophthalmoscope. Optics Express, 12:5198–+, Au-gust 2004.
[6] Z. Chen, T.E. Milner, S. Srinivas, X. Wang, A.Malakzali, M.J.C van Gemert, and J.S. Nelson. Non invasive imag-ing of in-vivo blood flow velocity usimag-ing optical doppler tomography. Optics Letters, 22:1119–1121, 1997. [7] J. A. Izatt, M. D. Kulkarni, S. Yazdanfar, J. K. Barton,
4 and A. J. Welch. In vivo bidirectional color doppler flow
imagingof picoliter blood volumes using optical coherence tomography. Optics Letters, 22:1439–1441, September 1997.
[8] L. An and R.K. Wang. In vivo volumetric imag-ing of vascular perfusion within human retina and choroids with optical micro-angiography. Optics Express, 16(15):11438–11452, 2008.
[9] Yimin Wang, Bradley A. Bower, Joseph A. Izatt, Ou Tan, and David Huang. In vivo total retinal blood flow measurement by fourier domain doppler optical coherence tomography. Journal of Biomedical Optics, 12(4):041215, 2007.
[10] Roland Michaely, Adrian H. Bachmann, Martin L.
Vil-liger, Cedric Blatter, Theo Lasser, and Rainer A. Leitgeb. Vectorial reconstruction of retinal blood flow in three di-mensions measured with high resolution resonant doppler fourier domain optical coherence tomography. Journal of Biomedical Optics, 12(4):041213, 2007.
[11] M. Atlan, M. Gross, T. Vitalis, A. Rancillac, B. C. For-get, and A. K. Dunn. Frequency-domain, wide-field laser doppler in vivo imaging. Optics Letters, 31(18):2762– 2764, 2006.
[12] JM Schmitt, AH Gandjbakhche, and RF Bonner. Use of polarized light to discriminate short-path photons in a multiply scattering medium. Appl. Opt, 31(30):6535, 1992.