HAL Id: hal-03008499
https://hal.archives-ouvertes.fr/hal-03008499
Submitted on 16 Nov 2020HAL is a multi-disciplinary open access archive for the deposit and dissemination of sci-entific research documents, whether they are pub-lished or not. The documents may come from teaching and research institutions in France or abroad, or from public or private research centers.
L’archive ouverte pluridisciplinaire HAL, est destinée au dépôt et à la diffusion de documents scientifiques de niveau recherche, publiés ou non, émanant des établissements d’enseignement et de recherche français ou étrangers, des laboratoires publics ou privés.
Distributed under a Creative Commons Attribution - NonCommercial - NoDerivatives| 4.0 International License
Phase diagram of poly(VDF-ter-TrFE-ter-CTFE)
copolymers: Relationship between crystalline structure
and material properties
François Bargain, Damien Thuau, Georges Hadziioannou, Fabrice Domingues
dos Santos, Sylvie Tencé-Girault
To cite this version:
François Bargain, Damien Thuau, Georges Hadziioannou, Fabrice Domingues dos Santos, Sylvie Tencé-Girault. Phase diagram of poly(VDF-ter-TrFE-ter-CTFE) copolymers: Relationship be-tween crystalline structure and material properties. Polymer, Elsevier, In press, pp.123203. �10.1016/j.polymer.2020.123203�. �hal-03008499�
1
Phase Diagram of poly(VDF-ter-TrFE-ter-CTFE) copolymers:
Relationship between crystalline structure and material
properties
François Bargain,1,2 Damien Thuau,3 Georges Hadziioannou,3 Fabrice Domingues Dos Santos,4 Sylvie Tencé-Girault1,2,5,*
1Molecular, Macromolecular Chemistry and Materials, ESPCI Paris, PSL University, CNRS, 10 rue
Vauquelin, 75005 Paris, France
2Arkema, CERDATO, Route du Rilsan, 27470 Serquigny, France
3Laboratoire de Chimie des Polymères Organiques, ENSCBP, Université de Bordeaux, 16 Avenue
Pey-Berland, F-33607 Cedex Pessac, France
4Piezotech S.A.S., Arkema - CRRA, rue Henri Moissan, 69493 Pierre-Bénite Cedex, France
5 Laboratoire PIMM, Arts et Metiers Institute of Technology, CNRS, Cnam, HESAM University,
75013 Paris, France
*Corresponding author. E-mail address: [email protected] (S. Tencé-Girault)
Abstract.
Depending on their CTFE content (from 0 to 10 mol %), poly(VDF-ter-TrFE-ter-CTFE), poly(vinylidene fluoride-ter-trifluoroethylene-ter-chlorotrifluoroethylene) copolymers, exhibit ferroelectric (FE) or relaxor ferroelectric (RFE) properties at room temperature. Solvent cast films of these terpolymers can crystallize in three orthorhombic phases: FE, DFE (Defective Ferroelectric) or RFE according to their amount of CTFE. The relative amount of each crystalline phase depends on the amount of CTFE and evolves after annealing. We study the dependence of the electric displacement−electric field (D−E) loop with the amount of CTFE and with annealing step. We observed a closely link between the remnant polarization, PR, and the fraction of (FE + DFE) crystalline phase.
Macroscopic properties, studied using thermo-mechanical experiments (DSC and DMA) and dielectric spectroscopy, evolve continuously with the CTFE amount and are well correlated with the structural properties. Finally, a temperature versus mol% CTFE phase diagram is established and discussed in relation-ship with material properties.
2 Introduction
Electroactive polymers (EAPs) are materials that undergo dimensional change in response to an applied electrical field. EAPs can be classified into two categories: ionic EAPs and electronic EAPs. The electrical activation of ionic EAPs is due to the migration of ions or electrically charged molecules whereas electronic EAPs are activated by applied electric fields and Coulomb forces. Among electronic EAPs, Poly(vinylidene fluoride) (PVDF) based polymers represent a family of promising material that exhibit exceptional electric properties whose can be tuned depending on their composition to achieve electrostrictive or piezoelectric behaviors [1] [2]. Consequently, fluorinated polymers are raising an increasing amount of interest as their unique tunable electric properties can meet the multiple requirements of the novel generation of flexible electronic applications [3]. For instance, they were recently integrated as active materials in piezoelectric or pyroelectric sensors [4] [5] [6], electromechanical actuators [4] [7], non-volatile memories [8] [9], high electric energy density capacitors [10] and nanogenerators for electric energy harvesting and self-powered electronics [11] [12] [13].
The electroactive properties of electronic EAP are closely related to the organization and orientation of dipoles in the crystalline lamellae of the semi-crystalline polymers considered [14]. In the VDF-based EAP family, dipoles are linked to C-F bonds due to the difference of electronegativity between hydrogen and fluorine atoms. The dipole orientation is defined by – (CH2-CF2) – conformations
in the crystal and by the symmetry of the crystalline cell. Thus, understanding and controlling crystal structures is therefore essential. Depending on the chain conformations, trans (T) and/or gauche (G), PVDF exhibits five crystalline phases, two of them are non-polar, ( and ), and three are polar phases (, and ) [15] [16]. While the phase, obtained after cooling from the melt, is the most frequently encountered, the phase is the most sought after for its ferroelectric, piezoelectric and pyroelectric properties [17] [18] [19], although less easy to obtain [20] [21]. In the phase, polymer chains are in all-trans conformation in crystals. A significant resultant dipole, perpendicular to the chains, aligned along the b parameter of the orthorhombic crystal cell, induces the ferroelectric properties of PVDF [22]. The ferroelectric properties characterized by a remnant polarization (PR) and a coercive field (EC)
depend on the amount and extension of crystalline lamellae [23]. In PVDF, although the ferroelectric phase is stable until the melting temperature of the polymer, the remnant polarization decreases above 75 °C [24]. A crystalline structure of the same symmetry, with chains in the same all-trans conformation can be obtained in copolymers of vinylidene fluoride and trifluoroethylene, poly(VDF-co-TrFE), whatever the crystallization route used, from the melt or from solution [25] [26]. This phase (named FE [27] or LT [28]) induces ferroelectric behavior; it is stable at low temperature until the Curie temperature (TC). Above TC, conformational disorder appears along chains leading to a paraelectric (PE) material
3 [28] [29]. The Curie transition in poly(PVDF-co-TrFE) copolymers is a first order crystal-crystal transition, from the orthorhombic FE (or LT) phase to the hexagonal PE (or HT) phase. Piezoelectric and ferroelectric properties are observed in PVDF homopolymer and in poly(VDF-co-TrFE) copolymers under TC with VDF amount around 60-80 mol% [26], a bipolar polarization loop can be measured with
high PR and EC, respectively around 50-80 mC/m2 and 40-80 V/m for a PVDF [22] [30]. After
irradiation or after copolymerization with a third monomer, CFE (ChloroFluoroEthylene) or CTFE (ChloroTriFluoroEthylene), this low temperature ferroelectric behavior disappears in favor of relaxor-ferroelectric behavior [31] [32] [33] [34]. The appearance of these relaxor-relaxor-ferroelectric properties is due to a disorder in the all-trans sequences and in the dipoles organization along the chains, thus to a modification in the crystalline state [35] [36] [37]. A significant modification of the bipolar loop with low PR and EC and an high deformation under electric field (through electrostriction) are observed [32].
The optimal and most studied compositions of poly(VDF-co-TrFE) copolymers for ferroelectric properties are in the range 65 to 80 mol% of VDF [26] [38] [39]. For these copolymers, lot of publications have demonstrated how the crystalline structure, the extension of crystalline lamellae and the orientation of the chains are closely related to ferroelectric performances. Various parameters as the nature of the solvent, the annealing effect [27] [40] [41] [42] and the orientation and the confinement [43] [44] [45] [46] are explored to improve the electroactive properties by playing on the crystalline structure and on the all-trans conformation organization. For example, the annealing of solvent cast films at a temperature above TC, allows the crystallization of a defective ferroelectric phase (DFE) which can
transit into FE phase after application of the electric field [27]. For terpolymers with CFE or CTFE, and their related relaxor-ferroelectric properties, the most studied compositions correspond to contents of CFE or CTFE termonomers close to 8 mol% [36] [47]. The subtle incorporation of CFE or CTFE inside the FE crystals inducing the relaxor-ferroelectric crystal structure (RFE) via the introduction of conformational disorder [48] [37], leads to relaxor-ferroelectric properties via the pinning effect [36]. Whereas other termonomers, as 3,3,3-trifluoropropene or trans-1,3,3,3-tetrafluoropropene, expelled out of the FE crystals, decrease the crystal ratio and degrade the ferroelectric properties [49] [50]. At room temperature, the RFE crystal structure is orthorhombic with inter-chain distances higher than in the FE crystals and with the absence of intra-chain order [36] [48]. Using in-situ SAXS-WAXS experiments, recent work proved the existence of a structural transition between the orthorhombic RFE phase to the high temperature hexagonal PE phase [48]. This structural transition is a continuous crystal-crystal transition, covering a wide temperature range from 20 to 50 °C. This transition is also marked by a broad maximum of dielectric constant in the same temperature range. As with the Curie transition, the physical transition from relaxor-ferroelectric state to paraelectric state is related to a structural transition, showing, once again, the strong impact of crystal structure on macroscopic properties.
4 High amount of CTFE (8-10 mol%) are mostly studied, and only rare studies report evolution of macroscopic properties with CTFE (or CFE) content [51] [52] [53]. Recent publication shows the coexistence of FE and RFE crystal phases in an intermediate composition (4.4 mol% CTFE), this conclusion is supported by the observation of two simultaneous crystal-crystal transitions, one discontinuous between the FE to PE phases and one continuous from the RFE phase to the PE phase [48]. One can wonder how crystal structures (FE, DFE and RFE) evolve and/or coexist when the amount of CTFE increases progressively from 0 to 10 mol%. Answering this question is the aim of this study. As with our previous studies, solvent cast films (six compositions have been selected) were prepared and characterized, as this process is easily transferable to organic electronics applications. As expected and using WAXS experiments, three crystal phases ferroelectric (FE), defective ferroelectric (DFE) and relaxor-ferroelectric (RFE) are observed. From correlation between electric displacement−electric field (D−E) loop measurements and WAXS experiments before and after thermal annealing, the behavior of each crystal structure (FE, DFE and RFE) under electric field was highlighted. Thus, we are able to precise the specificity of each crystal structure: FE, DFE and RFE structure. Finally, by studying the thermal, mechanical, dielectric and polarization macroscopic properties, a phase diagram is established, showing the evolution of crystalline structures and macroscopic properties for CTFE content from 0 to 10 mol%. To our knowledge, such a phase diagram had never been published before.
2. Experimental section
2.1. Materials and films preparation
Poly(VDF-ter-TrFE-ter-CTFE) terpolymers powders, with six various compositions (Table 1), were provided by Piezotech [https://www.piezotech.eu/en/]. In order to study the influence of the CTFE content, the VDF / TrFE ratio was kept almost constant, at around 67/33, for all the compositions. Polymer powders were dissolved in methylethylketone at 10 wt % at 80 °C overnight to get homogeneous polymer solution. Two different protocols were used for sample preparation depending on the targeted characterization method.
Solvent-casting method. The solution was spread homogeneously on glass substrate and let 1h at room
temperature to evaporate. A drying step at atmospheric pressure was performed overnight in an oven at temperature depending on the composition (Table 1). Solvent-cast films (20 µm thickness) were named TerpoX, with X the molar fraction of CTFE. These samples were used to perform WAXS experiments. Then, a 1h annealing at high temperature was done in an oven. The annealing temperature was fixed at 15-20°C below the melting temperature of each sample (Table 1). Corresponding samples were used for WAXS, DSC, DMA and dielectric spectroscopy experiments.
5
Spin-coating method. For electrical characterization (D-E loops), metal-insulator-metal (MIM)
capacitors were formed on glass substrate. Glass substrates were cleaned by ultrasonic bath of acetone and isopropanol of 15 min each and subsequently air dried. 80 nm thin layer of aluminum (Al) was deposited by thermal evaporation (70°C) at low pressure (1 × 10⁻⁷ mbar) on the substrate through shadow mask to pattern the bottom electrode. Then, copolymer and terpolymer solutions containing various amount of CTFE unit were spin coated at a rotation speed of 2000 rpm for 60 s and subsequently either dried or annealed at different conditions listed in Table 1. Afterwards, another 80 nm thin layer of Al was deposited on the 3 µm thick fluorinated polymer layer by e-beam evaporation through shadow mask to form the top electrode.
Information on various films and thermal treatments are gathered in Table 1.
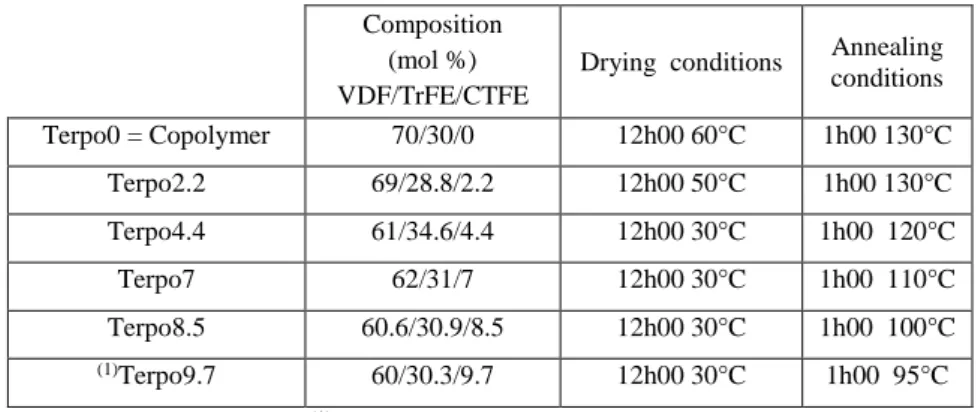
Table 1: Composition and annealing conditions for different film samples
Composition (mol %) VDF/TrFE/CTFE
Drying conditions Annealing conditions Terpo0 = Copolymer 70/30/0 12h00 60°C 1h00 130°C Terpo2.2 69/28.8/2.2 12h00 50°C 1h00 130°C Terpo4.4 61/34.6/4.4 12h00 30°C 1h00 120°C Terpo7 62/31/7 12h00 30°C 1h00 110°C Terpo8.5 60.6/30.9/8.5 12h00 30°C 1h00 100°C (1)Terpo9.7 60/30.3/9.7 12h00 30°C 1h00 95°C
(1) Sample from previous study [48]
2.2. Electric displacement−electric field (D−E) loops
D-E loops were recorded with a TF Analyzer 2000 (aixACCT System). D-E loops of thin films (~ 3 µm)
of diverse compositions were measured on metal-insulator-metal (MIM) capacitors as integrated current versus electric field, which was swept as a triangular voltage waveform up to about 200 V/μm at a frequency of 10 Hz between the bottom and the grounded top electrode.
2.3. WAXS experiments
Wide Angle X-rays Scattering (WAXS) experiments were performed on the Xenocs Nano-inXider SW system in transmission mode using Cu Kα radiation ( = 1.54 Å) from an X-ray microsource
(GeniX3D) operating at 50 kV-0.6 mA (30 W). Patterns were collected on a detector Pilatus3 (Dectris) allowing a 2 range between 5° and 62°, the collimation was chosen at 800 m to maximize intensity. The reduction of 2D datasets from the Pilatus3 detectors to 1D was achieved by radially averaging the
6 raw data detector counts using Foxtrot data reduction software [54]. WAXS intensities were corrected for the flat field and for the Ewald sphere solid angle.
WAXS spectra, I(2), were fitted using the Fityk0.9.8 software [55] in the full 2θ range. With this software, each WAXS spectrum is decomposed into crystalline and amorphous contributions. The crystalline peaks are associated with sharp peaks while amorphous signal is fitted by broad peaks. The 2hkl of each crystalline peak gives the inter-planar distance dhkl using the Bragg law:
2𝑑ℎ𝑘𝑙sin 𝜃ℎ𝑘𝑙= (1)
A weight crystallinity 𝐶of films was calculated using the following equation:
𝐶 = Ac
Ac+Aa× 100 [%] (2)
in which Ac and Aa are the areas under fitted crystalline peaks and amorphous halos, respectively.
2.4. Differential Scanning Calorimetry (DSC)
DSC measurements were performed using a Q1000 series TA Instruments. Disks of polymer films were cut using a 3 mm cylindrical shape punch and superimposed in the DSC aluminum pan to reach 7-8 mg. Heating and cooling ramps were done at 10 °C/min under helium flow, temperature ranges were adapted to each composition.
2.5. Dynamic Mechanical Analysis (DMA)
Samples for DMA experiments were cut from 20 µm thickness films by using a rectangular shape punch. DMA tests were performed using a Q800 TA Instruments Dynamic Mechanical Analyzer. Storage modulus, E’, and loss factor, tan δ = E’’/E’, of samples were measured in film tension configuration following a heating ramp at 3 °C/min from 100 °C to melt temperature. A sinusoidal tensile strain around 0.2 % (20 µm deformation) was applied at 1 Hz frequency.
2.6. Dielectric spectroscopy
Dielectric measurements were achieved on an Alpha-Analyser (Novocontrol) spectrometer. Annealed samples were placed between two circular titanium electrodes (1 cm diameter). A sinusoidal tension (1 V amplitude at 102, 103, 104, 105 and 106 Hz) was applied to determine the complex relative
permittivity ε (ε’, ε’’ and tan δ = ε’’/ ε’). At the same time, temperature ramps at 1 °C/min were applied using a Quatro Cryosystem (Novocontrol). A first heating until the annealing temperature was
7 performed to ensure a good thermal contact between the electrodes and the terpolymer films. Data were recorded during the cooling back to 50 °C and upon the second heating.
3. Results
3.1. Influence of annealing in the paraelectric phase
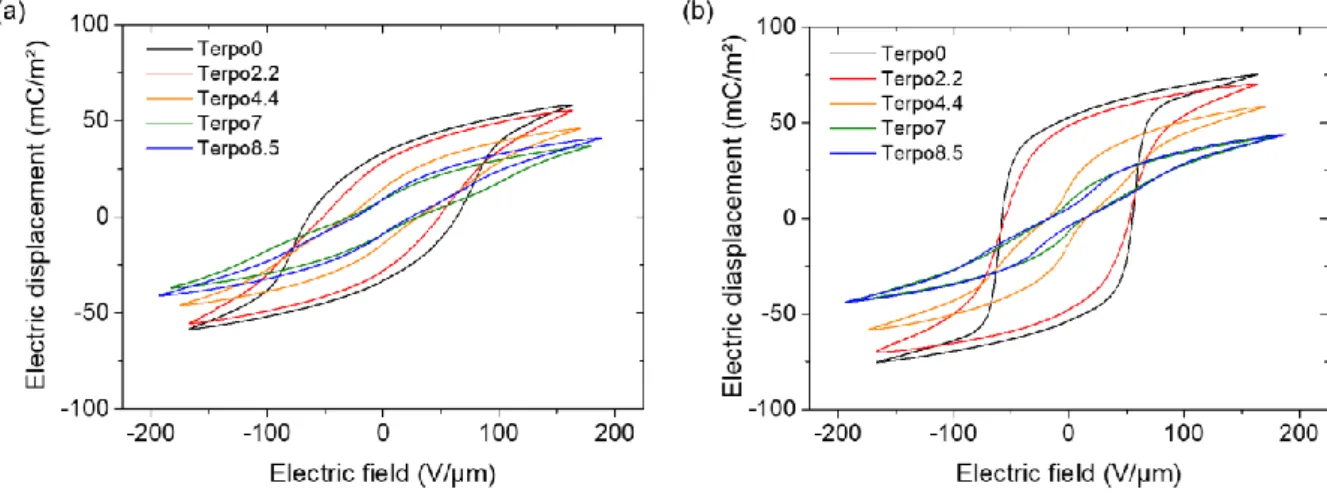
Electric displacement – electric field (D-E) hysteresis loop is commonly used to define the type of behavior (FE, RFE or PE) of fluorinated polymers from spontaneous dipoles switching in response to an applied external electric field. Figure 1 shows the D-E loops of poly(VDF-co-TrFE) copolymer and poly(VDF-ter-TrFE-ter-CTFE) terpolymer thin films (~ 3 µm) of diverse compositions. Here, D, the electric displacement of each composition and for both solvent-cast (Figure 1a) as well as annealed films (Figure 1b) was measured as a function of applied electric field, E, to investigate the effects of annealing (conditions listed in Table 1) on the electro-active properties of terpolymers.
Figure 1: Bipolar D-E loops of (a) solvent cast and (b) annealed films of poly(VDF-co-TrFE)
copolymer and poly(VDF-ter-TrFE-ter-CTFE) terpolymers of different compositions with CTFE content ranging from 2.2 to 8.5 mol%
From these measurements, we can classify the different compositions in two distinct groups. Clearly, the shape of the hysteresis loops of poly(VDF-co-TrFE) copolymer and poly(VDF-ter-TrFE-ter-CTFE) terpolymers with 2.2 mol% of CTFE unit differ from the ones of poly(VDF-ter-TrFE-ter-CTFE) terpolymers with higher CTFE amount. Concretely, hysteresis loops of solvent-cast Terpo0 and Terpo2.2 exhibit a distinct and large coercive field (EC) and large remnant polarization (PR) indicating
the presence of DFE and FE phases. An annealing step at 130 °C for 1 h on these two compositions significantly increases PR (+ 60%) as shown in Table 2.
Table 2. Remnant and saturated polarizations and coercive field of solvent-cast and annealed film for
8 Composition Terpo0 Terpo2.2 Terpo4.4 Terpo7 Terpo8.5 (1)Terpo9.7
PR (mC/m²) Solvent cast 33 28 14 9 9 Annealed 54 47 13 6 4 2-3 PS (mC/m²) Solvent cast 58 55 46 37 41 Annealed 75 70 58 42 43 40 EC (V/µm) Solvent cast 63.3 48.7 30.9 29.7 24.9 Annealed 55.0 51.2 15.2 13.2 11.1 5.0
(1) Sample from previous study [48]
Similarly to our previous study on poly(VDF-co-TrFE) copolymer [27], we believe that an annealing step increases the total crystallinity of Terpo2.2 by the crystallization of conformational chemical defects in the defective DFE phase. Moreover, we had shown for poly(VDF-co-TrFE) that poling can transform DFE phase into FE phase [27]. Whereas solvent-cast of poly(VDF-ter-TrFE-ter-CTFE) terpolymers with higher CTFE unit (4.4 mol% and above) exhibit narrow hysteresis loop with a small EC and PR,
common characteristics of RFE phase. An annealing step of poly(VDF-ter-TrFE-ter-CTFE) terpolymers films of 7 and 8.5 mol% of CTFE further shrinks their hysteresis loop, reduces EC and PR without
significant change in polarization at saturation (PS), which can be attributed to an increase of RFE phase
content to the detriment of the FE phase. To get further insight on the effect of thermal annealing on the crystalline structure of terpolymers we decided to carry out WAXS measurements.
Crystalline structure
WAXS spectra were recorded on each terpolymer film, after solvent evaporation (as-cast sample) and after annealing 1h00 at a temperature 15-20 °C below the melting point. We analyzed all WAXS spectra using Fityk software [55] in order to separate the crystalline and amorphous contributions. Decomposition in crystalline and amorphous components is shown in Figure 2 for the two specific composition 2.2 mol% and 7 mol% of CTFE, after solvent casting (Figure 2-a and b) and after annealing (Figure 2-d and e).
9 Figure 2: WAXS experiments: spectra recorded on Terpo2.2: (a),(d) and Terpo7: (b), (e);
evolution of the interplanar distances, dFE, dDFE and dRFE, and crystal ratio, C, with the composition (c), (f) after solvent cast (a-c) and after annealing (d-f).
WAXS spectrum presents an asymmetrical crystalline peak around 2 = 19° (Fig. 2 a, b and d) which can be decomposed in two peaks: one contribution (red or orange peak) at small 2DFE/RFE, with the
higher inter-reticular distance (dDFE or dRFE) and the second one (blue peak), for higher 2FE, which
corresponds to a smaller distance, dFE. The relationship between 2 and d is given by the Bragg formula
(1). For all the samples, we report the evolution of the inter-planar distances dDFE, dRFE, dFE with the
amount of CTFE, after solvent casting (Figure 2-c) and after annealing (Figure 2-f). We added on these graph the composition 9.7 mol% already studied in a previous publication [48]. On these two graphs, the numerical value reported near each point corresponds to the relative area of the crystalline peak: for example, at low CTFE amount, the Bragg peak associated to FE phase (dFE) is the main peak with an
area ratio of 0.8, while the dDFE Bragg peak is the minority phase with an area peak ratio around 0.2. We
have also reported in these two graphs the weight crystallinity calculated with the expression (2). For the solvent cast films, whatever the CTFE amount in the terpolymer, the main diffraction peak is dissymmetric and can be decomposed with two Bragg peaks. The two inter planar distances increase with the amount of CTFE, the main evolution appears between 3 and 7 mol% of CTFE, while below 3 mol% and above 7 mol% no significant evolution is observed. Below 3 mol%, the blue peak, with the smaller dFE distance (around 4.45 Å) is the majority peak and conversely, for CTFE amount higher than
10 7 mol%, the red peak, associate with dDFE/RFE around 4.80 Å, is the majority peak. These evolutions,
increase of the inter-planar distances with the amount of CTFE, indicate that the termonomer CTFE is located inside each crystalline phase. The crystallinity decreases slowly from 24 % for 0 mol% to 13 % for 7 mol% of CTFE, then it remains constant until 9.7 mol%, thus the incorporation of CTFE bulky termonomer along chains and into the crystalline phase degrades the crystallinity after solvent evaporation.
After the annealing step, a global increase of the inter-planar distances is observed as well as a significant increase of the crystallinity. An asymmetrical diffraction line is observed for CTFE amount up to 4.4 mol% ; above this amount, only one Bragg peak is observed. In agreement with our previous results on 0 mol %, 4.4 mol % and 9.7 mol % of CTFE, the two crystalline phases observed at low amount of CTFE (< 6 mol %) are the DFE (or RFE) and the FE phases while the unique phase observed at high amount of CTFE (> 7 mol %) remains the RFE phase. The crystallinity decreases linearly from 42 % (for 0 mol% CTFE) to 23 % (for 7 mol % CTFE) and above this composition the crystallinity remains lower than 25%.
Discussion on the effect of annealing
As a reminder, polymer chains in the FE crystalline phase are organized with all-trans conformations (Tm, with m3). In DFE and RFE crystals, chains containing some conformational
defects, like TG, TG-, T
3G or T3G-, can crystallize. While, the conformations along the chains in the PE
phase are a random combination of TG, TG-, T
3G or T3G- sequences, there is a conformational disorder
along the chain [56].
The increase of the inter planar distances and the significant increase of the crystallinity, both observed after annealing is consistent with our previous results observed on copolymer poly(VDF-co-TrFE) [27]. Indeed, whatever the amount of CTFE, between 0 mol % and 10 mol %, the annealing at a temperature 15-20 °C below the melting temperature corresponds to an annealing in the paraelectric (PE) phase that allows the crystallization of chain segments containing chemical defects, with various conformations [27]. This is what we observe here, the amount of DFE or RFE crystal phases increases after annealing, leading to the significant increase of the global crystallinity. The incorporation of conformational defects in the crystalline cell, in agreement with recent publication [37], explains also the increase of the inter-planar distances and the disappearance of FE phase at high amount of CTFE. Evolution of the hysteresis loops after annealing is correlated with the crystallinity evolution for all CTFE range. In Figure 3, we have reported on the left the evolution of PR and PS and on the right the
evolutionof the crystal ratio C, after annealing for terpolymers with CTFE amounts varying from 0 to
9.7 mol%. For low amount of CTFE (<4 mol%), we observe a significant increase of PR (+60%), while
PR decreases (-50%) for higher amount of CTFE (>6 mol%). Thus, after annealing, the amplitude of
11 be less touched by annealing, especially for high CTFE amounts and its range of variation is much more limited in the same CTFE content range. The total crystallinity, 𝐶, reported in Figure 2 is calculated with all the crystalline components, i.e. the FE, DFE and RFE crystalline phases. Thanks to the integrated intensity ratios of FE/DFE or FE/RFE diffraction peaks, we can calculate the crystal ratio of each phase. The FE crystal ratio, 𝐶𝐹𝐸, reported Figure 3-b, does not evolve significantly after annealing, so the major effect of annealing lies in the increase of the DFE and RFE crystal ratios.
By comparing the evolution of the various crystal ratios, we observe that the evolution of PR is
well correlated with the evolution of 𝐶𝐹𝐸+𝐷𝐹𝐸, as well for the evolution before and after annealing as for the variation with the amount of CTFE. The two red curves, PR and 𝐶𝐹𝐸+𝐷𝐹𝐸, after solvent cast and
after annealing show very similar evolution. This observation confirms the conclusion already published [27], so that the Defective Ferroelectric (DFE) phase created after annealing in the terpolymers with low amount of CTFE, < 4 mol %, is transformed in FE phase after polarization and then contributes to PR
increase. On the other hand, for high amount of CTFE (> 6 mol %), the decrease of PR is explained by
the disappearance of the FE phase after annealing (Figure 3) and especially by the fact that the Relaxor Ferroelectric (RFE) phase is not polarizable.
Figure 3: Annealing effect on (a) the remnant PR (, ) and saturation PS (, ) polarization and (b) WAXS crystal ratio, C, open symbols: as cast and full symbols: after annealing. 𝐶𝑇𝑜𝑡𝑎𝑙 (, ) is the crystal ratio calculated for all the contributions, FE, DFE and RFE, while 𝐶𝐹𝐸 (, ) and
𝐶𝐹𝐸+𝐷𝐹𝐸(doted and solid red line for solvent cast and annealing respectively) are respectively
calculated with the FE+DFE and FE contributions.
In contrast, the range of variation of PS (a factor of 2, from 40 and 80 mC/m2) seems more
correlated to the range of variation of the global crystallinity (also a factor of 2, from 0.2 to 0.4). The correlation with the crystallinity seems less perfect in the case of Ps than in the case of PR. Particularly
12 of FE or DFE crystals are almost unchanged when the CTFE amount increases, since CTFE termonomers are only slightly incorporated into these crystals. On the other hand, the saturation polarization PS depends on the FE, DFE and RFE crystals. As RFE crystals contain more CTFE units
than FE or DFE crystals, the dipole moment of these crystals decreases dramatically as the amount of CTFE increases. Indeed, CTFE has a lower dipole moment than VDF and TrFE [36]. So, the total crystallinity is not sufficient to explain the saturation polarization behavior, the dipole moment of each crystal phase should be taken into account, perhaps also other effects as the crystal/amorphous interfaces.
The significant decrease of PR, when the amount of CTFE goes from 2.2 to 4.4 mol% (Figure
3-a), and the comparison with the crystal ratio curves (Figure 3-b) lead us to think that the defective phase observed after annealing in the terpolymer with 4.4 mol% of CTFE would probably be a RFE phase and not a DFE phase. While before annealing, it remains an uncertainty.
This significant difference in the behavior of the DFE and RFE phase with respect to the applied electric field is not obvious in the WAXS spectra. Maybe, the differences lie in the inter-planar distances, the DFE phase would be the defective crystal phase having its major inter-planar distance lower than an upper limit, around 4.70-4.75 Å, while above this limit, the crystal phase would be RFE.
Evolutions of the hysteresis loops and of the crystalline phase, nature and amount, with the CTFE amount are more or less sigmoid. Especially, it seems that above 7 mol % of CTFE, a saturation of the properties is observed.
3.2. Influence of CTFE amount on the macroscopic properties
The study of the influence of CTFE amount on the macroscopic properties was done on annealed samples only. Indeed, it is important to know how the evolution of crystalline structures (ratio and amount) impacts thermal, thermo-mechanical and dielectric properties of these materials.
DSC experiments
13 Figure 4: DSC experiments on annealing terpolymers, first heating (a) and melting and Curie
enthalpies (b) for CTFE amount from 0 to 9.7 mol%.
While the melting and Curie transition (endothermic events) are well defined for the sample without CTFE, temperatures and enthalpies associated with these two transitions decrease significantly when the amount of CTFE increases. The Curie transition is well marked for CTFE amount until 4.4 mol %, above this composition the enthalpy associated with this transition is lower than 3 J/g,and the Curie temperature evolves between 38 °C and 30 °C for CTFE amount ranging from 7 mol % to 9.7 mol %. For this later range of composition, the melting enthalpy and temperature remain almost constant, respectively at 120 °C and 15 J/g.
The evolution of the melting and Curie enthalpies are well correlated with the respective evolution of
𝐶𝑇𝑜𝑡𝑎𝑙 and 𝐶
𝐹𝐸, after annealing and reported in Figure 3-b. The very low Curie enthalpy measured for
high amount of CTFE will be discussed later.
14 DMA experiments were also performed on annealed terpolymer films. The evolution of the storage modulus, E’, and of the loss factor, Tan are reported in Figure 5.
Figure 5: DMA experiments on annealed terpolymer films with CTFE amount ranging from 0 to
9.7 mol%.
The storage modulus of terpolymers decreases when the temperature increases with two or three steps. Each of these levels clearly appears as a maximum on the curve of Tan , indicating successive transitions. The first, at low temperature, around 25 °C, corresponds to the glass transition (Tg).
Around this transition, E′ decreases more or less depending on the CTFE content: the decrease is low for Terpo0 and more important for Terpo9.7. As usual, for semi-crystalline polymers, the E' drop at Tg
is higher for the lower crystal ratios. At higher temperature, two overlapped peaks are observed in the Tan evolution, a broad one for all the CTFE content, followed by a narrow one for the low content of CTFE (< 4.4 mol%). We already observed these two relaxations for terpolymer with 4.4 mol% of CTFE [48], the first broad one is associated with the continuous RFE-PE transition while the second narrow one is associated with the Curie (FE-PE) transition. For terpolymers with CTFE amount lower than 5 mol%, the Curie transition is highlighted with a colored arrow and the decrease of E’ is well marked (Figure 5). Above these transitions (RFE to PE and FE to PE), a decreasing modulus plateau is reached, it is attributed to the thermal evolution of the PE phase [48].
Again, for high amount of CTFE, the mechanical behavior of terpolymers is very similar, since they have the same unique broad transition around 25°C and the same storage modulus at high temperature. This point will be discussed later.
Dielectric spectroscopy
Again, dielectric spectroscopy experiments were performed on annealed terpolymer films. The evolution of the dielectric constant, ’, with temperature and frequency for various compositions are reported in Figure 6.
15 Whatever the composition, i.e. the amount of CTFE, the dielectric constant evolution with the temperature is characterized by a broad maximum (Figure 6-a). The temperature of the maximum depends on the composition, it increases when the amount of CTFE decreases. For low amount of CTFE, 0 and 2.2 mol%, the maximum of ’ is located at the Curie transition, a thermal hysteresis (TCurie= T C-heat TC-cool) is observed, and Curie temperatures at heating (TC-heat ) and at cooling (TC-cool)do not depend
on the frequency (Figure 6-b). These observations correspond to the well-known Curie transition from the ferroelectric phase (FE) at low temperature to the paraelectric phase (PE) at high temperature. On the other hand, for high amount of CTFE (>7 mol%) no thermal hysteresis is observed and the temperature of the maximum of ’ depends on the frequency. This behavior correspond to the relaxor-ferroelectric (RFE) behavior [57] [58]. This ’ maximum is associated with the transition from the relaxor-ferroelectric to paraelectric phase, as reported previously [48]. For the intermediate composition, 4.4 mol%, the thermal behavior of ’ reflects both the FE to PE and the RFE to PE transitions [48].
16 Figure 6: Dielectric spectroscopy experiments on annealed terpolymer films; evolution of the dielectric
constant with the temperature (arrows indicate the heating, T, and cooling, T) for various amounst of CTFE (a), and for various frequencies, from 1 kHz to 1 MHz, for Terpo2.2 (b) and Terpo7 (c).
The behavior of the dielectric constant with temperature evolves continuously with the amount of CTFE. However, dielectric curves for Terpo7, Terpo8.5 and Terpo9.7 are almost superimposed, as if a plateau has been reached.
4. Discussion
It is well know that the thermal behavior of poly(VDF-ter-TrFE-ter-CTFE) copolymers is defined by the termonomer content [2] [51] [52] [48]. Especially, the nature of the low temperature phases, FE, DFE or RFE and then their respective transition towards the high temperature PE phase.
17 We have previously studied these transitions for 0, 4.4 and 9.7 mol% of CTFE [48]. In Terpo0, the Curie transition from the ferroelectric state to the paraelectric state is correlated with a discontinuous structural transition from the orthorhombic FE structure, with all-trans conformation, to the hexagonal PE structure characterized by a conformational disorder [28]. This Curie transition is enthalpic and characterized by a thermal hysteresis TC, observed in Figure 3 and represented by the hatched domain
in the phase diagram in Figure 7. In Terpo9.7, the transition from the relaxor-ferroelectric to the paraelectric state is correlated with a continuous structural transition from the orthorhombic pseudo-hexagonal RFE crystal structure to the pseudo-hexagonal PE structure. The temperature of this transition, defined at the maximum of the dielectric constant, depends on the frequency (Figure 3): this variation of the temperature transition is schematized by the broad white domain in the phase diagram (Figure 7). This transition is also detectable using DSC experiments; it is associated with a small broad endotherm with very low enthalpy, lower than 3 J/g (Figure 4-b). For the intermediate composition, terpolymer with 4.4 mol% of CTFE in which FE and RFE crystalline phases coexist at low temperature, we observe both the discontinuous Curie transition from the FE orthorhombic phase to the hexagonal PE phase and the continuous structural transition from the RFE orthorhombic phase to the PE hexagonal phase. Moreover, for all CTFE composition range from 0 mol% to 10 mol%, the high temperature phase is paraelectric associated with the hexagonal PE structure with only a progressive increase of inter-chain distance due to bulky CTFE units [48].
18 Figure 7: Temperature versus mol% CTFE phase diagram of annealed poly(VDF-ter-TrFE-ter-CTFE)
terpolymers . In the upper part, the phase diagram is deduced from experiments presented in this study and from [48]. In the lower part, the crystallinity C,, the coercive field EC,, the remnant polarization PR, , the storage modulus E’ (at 1 Hz), , and the dielectric constant ’(at 1 kHz), , are measured at 25 °C for the various amounts of CTFE.
In this study, we have studied in more depth the crystalline structure and the macroscopic properties at room temperature for all the terpolymers, prepared via direct radical terpolymerization, with amount of CTFE varying between 0 and 10 mol%. We observed that the crystalline structure evolves continuously by incorporating the termonomer CTFE in the crystalline structure(s). This progressive incorporation of CTFE leads to a continuous evolution of the macroscopic properties reported in the lower part of the phase diagram (Figure 7).
For low amount of CTFE (< 4 mol%), we observe the coexistence of the FE and the DFE crystalline structures at room temperature. When the amount of CTFE increases, the cell dimensions of these two crystalline structures increase while the proportion of DFE phase increases at the expense of FE phase. As the DFE structure is less dense and incorporates more defects, the storage modulus is reduced by the incorporation of CTFE due to mobility increase. On the other hand, this DFE crystalline phase can be transformed into the FE phase after poling, then the remnant polarization and the coercive field do not evolve a lot.
For an intermediate range of CTFE, around 4 to 6 mol%, the amount of FE phase is very low and the cell parameters of both phases continue to increase. For these amounts of CTFE, the defective phase is no longer polarizable at room temperature (around 25 °C); this is why this structure is now named RFE. Probably the inter-planar distance became too large to maintain a remnant polarization; the RFE crystal structure is not ferroelectric but relaxor-ferroelectric. Low PR and EC measure are due to the
low amount of FE crystalline phase.
For high amount of CTFE, above 6 mol%, the FE crystal structure is no longer observed after annealing, only the RFE crystal phase remains. The inter-planar distance and the crystallinity do not seem to evolve until 10 mol% of CTFE, dRFE and C remain around 4.83 Å and 23 % respectively. In
this range of CTFE content, the remnant polarization, PR, and the coercive field, EC, are very low (around
2-6 mC/m2 and 5-10 V/μm respectively); these values are characteristic of the narrow D-E loops already observed in these terpolymers [36]. In this range of CTFE, between 6 and 10 mol%, all the properties, PR, EC and the storage modulus E’, appear stabilized at their respective low values.
The transition temperature from the low temperature state (FE, DFE, RFE) to the high temperature paraelectric (PE) state, measured for example at the ’ maximum, decreases continuously from 110 °C to 40 °C and reaches a plateau for CTFE amount higher than 7 mol%. Consequently, the
19 dielectric constant at room temperature increases also continuously. For the high amount range of CTFE, ’ increases significantly from 20 to 28 for CTFE amount varying from 7 to 10 mol%.
Three studies exploring such a range of CTFE compositions have been already published. Two of them relate to Piezotech terpolymers [51] [53] obtained by direct terpolymerization, while the third considered terpolymers obtained after hydrogenation of P (VDF-co-CTFE) [52]. The comparison with this last study cannot be considered. Indeed, even if the transition temperatures and the crystallinity decrease as the content of CTFE increases, the nature of these transitions and their temperature ranges appear different. The differences observed might be mainly due to a different overall chemical composition and also to a probable different distribution of monomers along the chain. In fact, in our study, the CTFE content varies but the VDF / TrFE ratio is maintained approximately constant (around 65/35-70/30, see Table 1), while by hydrogenation, the CTFE content increases to the detriment of TrFE at constant VDF amount around 80 mol%.
The study carried out by Capsal et al. [51] is rather focused on the influence of a plasticizer on the electrostriction performances. Nevertheless, changes in storage modulus (E’) and melting enthalpy when the CTFE content increases are quite comparable to ours. By comparing the electromechanical responses of cantilevers moved by terpolymers with various amounts of CTFE from 0 to 10 mol%, Lheritier et al. [53] concluded to the existence of three domains: terpolymers with CTFE content lower than 3% are piezoelectric, they are electrostrictive at high CTFE content (beyond 8%) and they exhibit a mixed behavior for intermediate compositions of CTFE. Their conclusions are consistent with our observations, indeed, in the intermediate domain FE and RFE crystal structures coexist with relative ratio 0.2/0.8 (Figure 2-f and Figure 7) and these terpolymers exhibit an intermediate D-E loop (Figure 1-b). In the intermediate domain, a higher normalized deflection under electric field was measured [53]. Even though this effect is small, it might recall the morphotropic phase boundary (MPB) notion, initially introduced in lead zirconate titanate [59], and recently in poly(VDF-co-TrFE) copolymers [39]. In MPB a high electromechanical response was measured associated to a structural phase transition due to changes in composition [59]. In our case, when the amount of CTFE increases, a gradual evolution of the crystal structure from FE+DFE to RFE was observed and associated with changes in macroscopic properties, ferroelectric / piezoelectric then relaxor-ferroelectric/electrostrictive. These structural investigations necessitate future electromechanical studies to conclude on the existence of MPB for poly(VDF-ter-TrFE-ter-CTFE) terpolymers.
We thus observe a continuous evolution of the crystalline structures when the fraction of CTFE increases from 0 to 10 mol% in the terpolymers. Some macroscopic properties, like polarization, PR,
and mechanical behavior, E’, are closely linked to the crystalline nature (FE, DFE or RFE) and amount (C). In the same way as the crystalline properties: interplanar distances and C (Figure 2-f and Figure
20 Interestingly, such a plateau can be detected in the electrostrictive coefficient (M13) and in the
mechanical energy density for neat terpolymers in Capsal work [51]. Conversely, for the plasticized terpolymers, the plateau no longer exists, a significant increase of the mechanical energy density is observed for the highest CTFE content (9 mol%), perhaps revealing a different effect of the plasticizer for this composition. Hence an interesting remark on the evolution of the structure. Above this CTFE content (> 7 mol%), either the incorporation of a few additional CTFE monomers no longer causes variation in the interplanar distances and of the crystallinity, or they are no longer incorporated in the crystal and enrich the amorphous phase.
5. Conclusion
Depending on their CTFE content (from 0 to 10 mol %), poly (VDF-ter-TrFE-ter-CTFE), poly(vinylidene fluoride-ter-trifluoroethylene-ter-chlorotrifluoroethylene) copolymers exhibit ferroelectric (FE) or relaxor ferroelectric (RFE) properties at low temperature whereas they all present paraelectric (PE) behavior at high temperature. For solvent-cast films of copolymers poly(VDF-co-TrFE), we previously showed that after annealing above the Curie transition, a minority defective ferroelectric crystal phase (DFE) coexisted with the all-trans FE crystal phase.
In this work, we studied at room temperature before and after annealing, the evolution of the crystalline phases with CTFE content. After solvent cast and before annealing, for CTFE amount lower than 4 mol%, we observed the coexistence of the DFE and FE crystalline phases and for higher amounts the coexistence of RFE and FE crystalline phases. After annealing, the proportion of DFE or RFE phases increases to the detriment of the FE phase. There is no more FE phase for CTFE amount higher than 6 mol%. These evolutions are well correlated with the evolution of D-E loops. The remnant polarization, PR, evolves similarly as the total amount of DFE and FE crystal phases, both before and after annealing.
This observation clearly proves that the DFE phase is polarizable contrary to the RFE phase. That may prove the existence of a critical inter-planar distance around 4.70-4.75 Å, at 25 °C, that separates DFE and RFE phases. The saturation polarization, PS, is rather correlated with the total crystallinity
(FE+DFE+RFE), but this correlation is less obvious because of the different dipole moments to be considered.
In a second part, we have studied the macroscopic properties, specifically the thermo-mechanical and dielectric ones. We have shown that they evolve continuously with CTFE amount and that their evolutions are linked to the structural properties. From these observations, we were able to draw a «Temperature versus mol% CTFE phase diagram» of poly(VDF-ter-TrFE-ter-CTFE) terpolymers enriched with the macroscopic properties. The dielectric constant at room temperature increases continuously with the CTFE amount. For the other properties, which appear linked to the crystal structure, a plateau seems to be reached, as if the crystal cell dimensions and the crystal ratio are capped when the CTFE amount increases.
21 Acknowledgments
The authors are grateful to French National Agency of Research and Technology (ANRT) and Arkema for supporting this work during the PhD thesis of F. Bargain at the MMC laboratory (CIFRE convention no. 2014/0573) and for the financial support from the Industrial Chair HOMERIC (Arkema/ANR) within the grant agreement n°AC-2013-365. Part of this work was performed within the framework of the Equipex ELORPrintTec ANR-10-EQPX-28-01 with the help of the French state’s Initiative d’Excellence IdEx ANR-10-IDEX-003-02. Michel Cloitre and Ilias Iliopoulos are warmly thanked for enlightening and stimulating discussions. Authors are grateful to the LEM laboratory (Arkema, Serquigny, France) for facilitating SAXS-WAXS experiments and dielectric spectroscopy measurements, especially Sylvie Lebreton, David Deperrois and Stéphane Bizet for technical helps and discussions. Sara Zanchi from the PIMM is warmly thanked for her attentive reading and interesting remarks. Sylvie Tencé-Girault contribution was performed in part within the framework of the Industrial Chair Arkema (Arkema/CNRS-ENSAM-Cnam).
References
[1] L. Zhu et Q. Wang, «Novel Ferroelectric Polymers for High Energy Density and Low Loss Dielectrics,» Macrmolecules, vol. 45, pp. 2937-2954, 2012.
[2] T. Soulestin, V. Ladmiral, F. Domingues Dos Santos et B. Améduri, «Vinylidene fluoride- and trifluoroethylene-containing fluorinatedelectroactive copolymers. How does chemistry impact properties?,» Progress in Polymer Science, vol. 72, pp. 16-60, 2017.
[3] X. Chen, X. Han et Q.-D. Shen, «PVDF-Based Ferroelectric Polymers in Modern Flexible Electronics,» Advanced Electronic Materials, vol. 3, p. 1600460, 2017.
[4] D. Thuau, K. Kallitsis, F. Domingues Dos Santos et G. Hadziioannou, «All inkjet-printed piezoelectric electronic devices: energy generators, sensors and actuators,» Journal of
Materials Chemistry C, vol. 5, pp. 9963-9966, 2017.
[5] D. Thuau, M. Abbas, G. Wantz, L. Hirsch, I. Dufour et C. Ayela, «Piezoelectric polymer gated OFET: Cutting-edge electro-mechanical transducer for organic MEMS-based sensors,» Scientific
22 [6] X. Han, X. Chen, X. Tang, Y.-L. Chen, J.-H. Liu et Q.-D. Shen, «Flexible Polymer Transducers for
Dynamic Recognizing Physiological Sig,» Advanced Functional Materials, vol. 26, pp. 3640-3648, 2016.
[7] S. Ahmed, Z. Ounaies et E. A. F. Arrojado, «Electric field-induced bending and folding of polymer sheets,» Sensors and Actuators A: Physical, vol. 260, pp. 68-80, 2017.
[8] Z. Hu, M. Tian, B. Nysten et A. M. Jonas, «Regular arrays of highly ordered ferroelectric polymer nanostructures for non-volatile low-voltage memories,» Nature Materials, vol. 8, pp. 62-67, 2009.
[9] D. Thuau, M. Abbas, G. Wantz, L. Hirsch, I. Dufour et C. Ayela, «Mechanical strain induced changes in electrical characteristics of flexible, non-volatile ferroelectric OFET based memory,»
Organics Electronics, vol. 40, pp. 30-35, 2017.
[10] B. Chu, X. Zhou, K. Ren, B. Neese, M. Lin, Q. Wang, F. Bauer et Q. M. Zhang, «A Dielectric Polymer with High Electric Energy Density and Fast Discharge Speed,» Science, vol. 313, pp. 334-336, 2006.
[11] M. Kim, S. Lee et Y.-i. Kim, «Solvent-controlled crystalline beta-phase formation in electrospun P(VDF-TrFE) fibers for enhanced piezoelectric energy harvesting,» APL Materials, vol. 8, p. 071109, 2020.
[12] I. Jung, Y.-H. Shin, S. Kim, J.-y. Choi et C.-Y. Kang, «Flexible piezoelectric polymer-based energy harvesting system for roadway applications,» Applied Energy, vol. 197, pp. 222-229, 2017.
[13] F. R. Fan, W. Tang et Z. L. Wang, «Flexible Nanogenerators for Energy Harvesting and Self-Powered Electronics,» Advanced Materials, vol. 28, pp. 4283-4305, 2016.
[14] Y. Bar-Cohen, Electroactive polymer (EAP) actuators as artificial muscles : reality, potential, and challenge, Washington USA: SPIE PRESS, 2001.
[15] J. B. Lando et W. W. Doll, «The polymorphism of poly(vinylidene fluoride). I. The effect of head-to-head structure,» Journal of Macromolecular Science, Part B: Physics, vol. 2, n° %12, pp. 205-218, 1968.
[16] A. J. Lovinger, «Poly(vinylidene Fluoride),» chez Developments in Crystalline Polymers-1, Applied Science Publishers, 1982, pp. 195-273.
23 [17] R. G. Kepler et R. A. Anderson, «Ferroelectricity in polyvinylidene fluoride,» Journal of Applied
Physics, vol. 49, pp. 1232-1235, 1978.
[18] H. Kawai, «The Piezoelectricity of Poly(vinylidene Fluoride),» Japanese Journal of Applied
Physics, vol. 8, n° %17, pp. 975-976, 1969.
[19] R. G. Kepler et R. A. Anderson, «On the origin of pyroelectricity in polyvinylidene fluoride,»
Journal of Applied Physics, vol. 49, n° %19, pp. 4918-4921, 1978.
[20] K. Matsushige, K. Nagata, S. Imada et T. Takemura, «The II-I crystal transformation of
poly(vinylidene fluoride) under tensile and compressional stresses,» Polymer, vol. 21, pp. 1391-1397, 1980.
[21] P. Martins, A. C. Lopes et S. Lanceros-Mendez, «Electroactive phases of poly(vinylidene fluoride): Determination, processing and applicationsP,» Progress in Polymer Science, vol. 39, n° %14, pp. 683-706, 2014.
[22] A. J. Lovinger, «Ferroelectric Polymers,» Science, vol. 220, n° %14602, pp. 1115-1121, 1983.
[23] R. G. Kepler et R. A. Anderson, «Ferroelectric polymers,» Advances in Physics, vol. 41, n° %11, pp. 1-57, 1992.
[24] A. J. Bur, J. D. Barnes et K. J. Wahlstrand, «A study of thermal depolarization of polyvinylidene fluoride using x-ray pole-figure observations,» Journal of applied physics, vol. 59, n° %17, pp. 2345-2354, 1986.
[25] A. J. Lovinger, T. Furukawa, G. T. Davis et M. G. Broadhurst, «Crystallographic changes
characterizing the Curie transition in three ferroelectric copolymers of vinylidene fluoride and trifluoroethylene: 1. As-crystallized samples,» Polymer, vol. 24, pp. 1225-1232, 1983.
[26] K. Tashiro et M. Kobayashi, «Structural phase transition in ferroelectric fluorine polymers: X-ray diffraction and infrared/Raman spectroscopic study,» Phase Transitions, vol. 18, n° %13-4, pp. 213-246, 1989.
[27] F. Bargain, P. Panine, F. Domingues Dos Santos et S. Tencé-Girault, «From solvent-cast to annealed and poled poly(VDF-co-TrFE) films: New insights on the defective ferroelectric phase,» Polymer, vol. 105, pp. 144-156, 2016.
24 [28] K. Tashiro, R. Tanaka, K. Ushitora et M. Kobayashi, «Annealing effect on ferroelectric phase
transitional behavior of vinylidene fluoride-trifluoroethylene copolymers: An interpretation based on the concept of domain and trans-gauche conformational disorder,» Ferroelectrics, vol. 171, n° %11, pp. 145-162, 1995.
[29] J. F. Legrand, «Structure and ferroelectric properties of P(VDF-TrFE) copolymers,»
Ferroelectrics, vol. 91, n° %11, pp. 303-317, 1989.
[30] S. Chen, K. Yao, F. E. H. Tay et L. L. S. Chew, «Comparative Investigation of the Structure and Properties of Ferroelectric Poly(vinylidene fluoride) and Poly(vinylidene fluoride–
trifluoroethylene) Thin Films Crystallized on Substrates,» Journal ofAppliedPolymer Science, vol. 116, pp. 3331-3337, 2010.
[31] Q. M. Zhang, V. Barthi et X. Zhao, «Giant electrostriction and relaxor ferroelectric behaviour in electron-irradiated poly(vinylidene fluoride-trifluoroethylene) copolymer,» Science, vol. 280, pp. 2101-2104, 1998.
[32] R. J. Klein, J. Runt et Q. M. Zhang, «Influence of crystallization conditions on the microstructure and electromechanical properties of poly(vinylidene
fluoride-trifluoroethylene-chlorofluoroethylene) terpolymers,» Macromolecules, vol. 36, pp. 7220-7226, 2003.
[33] Y. Lu, J. Claude, B. Neese, Q. Zhang et Q. Wang, «A modular approach to ferroelectric polymers with chemically tunable Curie temperatures and dielectrics constants,» Journal of the American
Chemical Society, vol. 128, pp. 8120-8121, 2006.
[34] J. T. Garrett, C. M. Roland, A. Petchsuk et T. C. Chung, «Electrostrictive behaviour of
poly(vinylidene fluoride-trifluoroethylene-chlorotrifluoroethylene),» Applied Physics Letters, vol. 83, pp. 1190-1192, 2003.
[35] L. Yang, X. Li, E. Allahyarov, P. L. Taylor, Q. M. Zhang et L. Zhu, «Novel polymer ferroelectric behavior via crystal isomorphism and the nanoconfinement effect,» Polymer, vol. 54, pp. 1709-1728, 2013.
[36] L. Yang, B. A. Tyburski, F. Domingues Dos Santos, M. K. Endoh, T. Koga, D. Huang, Y. Wang et L. Zhu, «Relaxor Ferroelectric Behavior from Strong Physical Pinning in a Poly(vinylidene fluoride-co-trifluoroethylene-co-chlorotrifluoroethylene) Random Terpolymer,» Macromolecules, vol. 47, pp. 8119-8125, 2014.
25 [37] Y. Liu, B. Zhang, W. Xu, A. Haibibu, Z. Han, W. Lu, J. Bernholc et Q. Wang, «Chirality-induced
relaxor properties in ferroelectric polymers,» Nature Materials, 2020.
[38] K. Tashiro, K. Takano, M. Kobayshi, Y. Chatani et H. Tadokoro, «Structural study on ferroelectric phase transition of vinylidene fluoride-trifluoroethylene copolymers (III) dependence of
transitional behavior on VDF molar content,» Ferroelectrics, vol. 57, pp. 297-326, 1984.
[39] Y. Liu, H. Aziguli, B. Zhang, W. Xu, W. Lu, J. Bernholc et Q. Wang, «Ferroelectric polymers exhibiting behaviour reminiscent of a morphotropic phase boundary,» Nature, vol. 562, pp. 96-100, 2018.
[40] J. Kim, J. H. Lee, H. Ryu, J.-H. Lee, U. Khan, H. Kim, S. S. Kwak et S.-W. Kim, «High-Performance Piezoelectric, Pyroelectric, and Triboelectric Nanogenerators Based on P(VDF-TrFE) with Controlled Crystallinity and Dipole Alignment,» Advanced Functional Materials, vol. 27, p. 1700702, 2017.
[41] Y. Cho, D. Ahn, J. B. Park, S. Pak, S. Lee, B. O. Jun, J. Hong, S. Y. Lee, J. E. Jang, J. Hong, S. M. Morris, J. I. Sohn, S. N. Cha et J. M. Kim, «Enhanced Ferroelectric Property of P(VDF-TrFE-CTFE) Film Using Room-Temperature Crystallization for High-Performance Ferroelectric Device Applications,» Advanced Electronic Materials, p. 1600225, 2016.
[42] S. J. Kang, Y. J. Park, J. Sung, P. S. Jo, C. Park, K. J. Kim et B. O. Cho, «Spin cast ferroelectric beta poly„vinylidene fluoride… thin films via rapid thermal annealing,» Applied Physics Letters, vol. 92, p. 012921, 2008.
[43] E. Baer et L. Zhu, «50th Anniversary Perspective: Dielectric Phenomena in Polymers and Multilayered Dielectric Films,» Macromolecules, vol. 50, pp. 2239-2256, 2017.
[44] V. Cauda, S. Stassi, K. Bejtka et G. Canavese, «Nanoconfinement: an Effective Way to Enhance PVDF Piezoelectric Properties,» ACS Applied Materials & Interfaces, vol. 5, pp. 6430-6437, 2013.
[45] M.-C. Garcıa-Gutierrez, A. Linares, J. J. Hernandez, D. R. Rueda, T. A. Ezquerra, P. Poza et R. J. Davies, «Confinement-Induced One-Dimensional Ferroelectric Polymer Arrays,» Nano Letters, vol. 10, pp. 1472-1476, 2010.
[46] Y. Wu, Q. Gu, G. Ding, F. Tong, Z. Hu et A. M. Jonas, «Confinement Induced Preferential Orientation of Crystals and Enhancement of Properties in Ferroelectric Polymer Nanowires,»
26 [47] Q. Liu, C. Richard et J.-F. Capsal, «Control of crystal morphology and its effect on
electromechanical performances of electrostrictive P(VDF-TrFE-CTFE) terpolymer,» European
Polymer Journal, vol. 91, pp. 46-60, 2017.
[48] F. Bargain, D. Thuau, P. Panine, G. Hadziioannou, F. Domingues Dos Santos et S. Tencé-Girault, «Thermal behavior of poly(VDF-ter-TrFE-ter-CTFE) copolymers: Influence of CTFE termonomer on the crystal-crystal transitions,» Polymer, vol. 161, pp. 64-77, 2019.
[49] T. Soulestin, V. Ladmiral, T. Lannuzel, F. Domingues Dos Santos et B. Ameduri, «Importance of Microstructure Control for Designing New Electroactive Terpolymers Based on Vinylidene Fluoride and Trifluoroethylene,» Macromolecules, vol. 48, pp. 7861-7871, 2015.
[50] F. Bargain, T. Soulestin, F. Domingues Dos Santos, V. Ladmiral, B. Améduri et S. Tencé-Girault, «Semicrystalline Organization of VDF- and TrFE-Based Electroactive Terpolymers: Impact of the trans-1,3,3,3-Tetrafluoropropene Termonomer,» Macromolecules, vol. 50, pp. 3313-3322, 2017.
[51] J.-F. Capsal, J. Galineau, M.-Q. Le, F. Domingues Dos Santos et P.-J. Cottinet, «Enhanced Electrostriction based on Plasticized Relaxor Ferroelectric P(VDF-TrFE-CFE/CTFE) Blends,»
Journal of Polymer Science, Part B: Polymer Physics, vol. 53, pp. 1368-1379, 2015.
[52] B. Qiao, X. Wang, S. Tan, W. Zhu et Z. Zhang, «Synergistic Effects of Maxwell Stress and
Electrostriction in Electromechanical Properties of Poly(vinylidene fluoride)-Based Ferroelectric Polymers,» Macromolecules, vol. 52, pp. 9000-9011, 2019.
[53] P. Lheritier, S. Noel, N. Vaxelaire, F. Domingues Dos Santos et E. Defay, «Actuation efficiency of polyvinylidene fluoride-based co- and ter-polymers,» Polymer, pp. 270-275, 2018.
[54] Foxtrot software can be obtained by sending a mail to [email protected]. Software is free for
non-profit usage, directly usable with Nexus and ESRF 2D data format..
[55] M. Wojdyr, «Fityk: a general-purpose peak fitting program,» Journal of Applied Crystallography, vol. 43, n° %15, pp. 1126-1128, 2010.
[56] K. Tashiro, K. Takano, M. Kobayashi, Y. Chatani et H. Tadokoro, «Structural study on
ferroelectric phase transition of vinylidene fluoride-trifluoroethylene random copolymers,»
27 [57] S. Zhang, R. J. Klein, K. Ren, B. Chu, X. Zhang et J. Runt, «Normal ferroelectric to ferroelectric
relaxor conversion in fluorinated polymers and the relaxor dynamics,» Journal of Materials
Science, vol. 41, pp. 271-280, 2006.
[58] F. Bauer, «Review on the properties of the ferrorelaxor polymers and some new recent developments,» Applied Physics A, vol. 107, pp. 567-573, 2012.
[59] M. Ahart, M. Somayazulu, R. E. Cohen, P. Ganesh, P. Dera, H.-k. Mao, R. J. Hemley, Y. Ren, P. Liermann et Z. Wu, «Origin of morphotropic phase boundaries in ferroelectrics,» Nature, vol. 451, pp. 545-549, 2008.