HAL Id: inserm-00128602
https://www.hal.inserm.fr/inserm-00128602
Submitted on 6 Jun 2007HAL is a multi-disciplinary open access archive for the deposit and dissemination of sci-entific research documents, whether they are pub-lished or not. The documents may come from teaching and research institutions in France or abroad, or from public or private research centers.
L’archive ouverte pluridisciplinaire HAL, est destinée au dépôt et à la diffusion de documents scientifiques de niveau recherche, publiés ou non, émanant des établissements d’enseignement et de recherche français ou étrangers, des laboratoires publics ou privés.
Prescreening tools for diabetes and obesity-associated
dyslipidaemia: comparing BMI, waist and waist hip
ratio. The D.E.S.I.R. Study.
Beverley Balkau, David Sapinho, Anne Petrella, Leila Mhamdi, Martine
Cailleau, Dominique Arondel, Marie-Aline Charles
To cite this version:
Beverley Balkau, David Sapinho, Anne Petrella, Leila Mhamdi, Martine Cailleau, et al.. Prescreening tools for diabetes and obesity-associated dyslipidaemia: comparing BMI, waist and waist hip ratio. The D.E.S.I.R. Study.: Screening for undiagnosed diabetes and dyslipidaemia. Eur J Clin Nutr, 2006, 60 (3), pp.295-304. �10.1038/sj.ejcn.1602308�. �inserm-00128602�
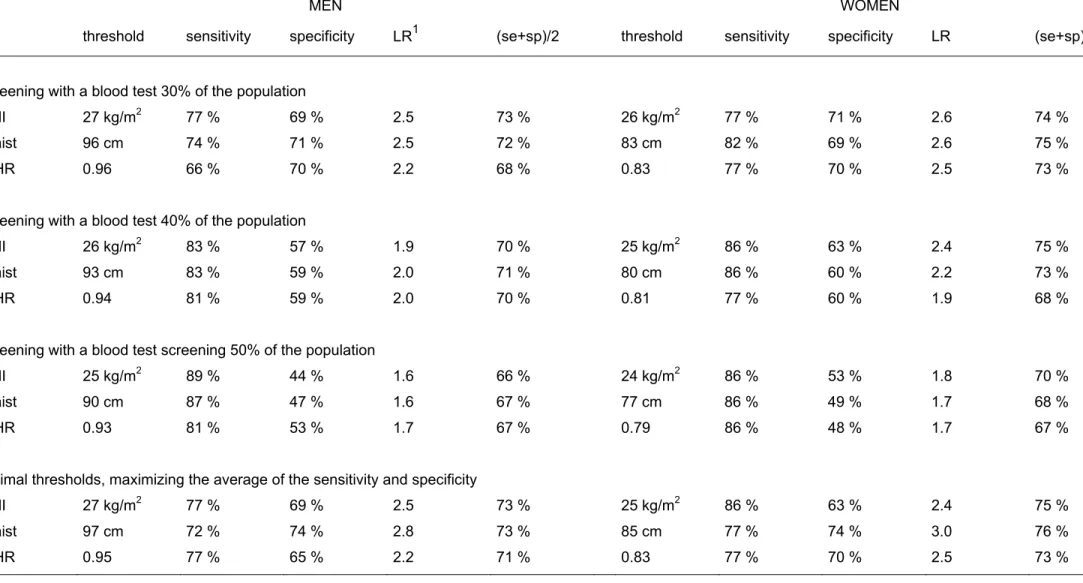
Table 2 Characteristics of different thresholds for the body mass index (BMI), waist circumference and waist hip ratio (WHR), corresponding to a 30%, 40% and 50%
screening of the population. Subjects aged 40 to 64 years who were not treated for diabetes. The D.E.S.I.R. Study.
MEN WOMEN
threshold sensitivity specificity LR1 (se+sp)/2 threshold sensitivity specificity LR (se+sp)/2 screening with a blood test 30% of the population
BMI 27 kg/m2 77 % 69 % 2.5 73 % 26 kg/m2 77 % 71 % 2.6 74 %
Waist 96 cm 74 % 71 % 2.5 72 % 83 cm 82 % 69 % 2.6 75 %
WHR 0.96 66 % 70 % 2.2 68 % 0.83 77 % 70 % 2.5 73 %
screening with a blood test 40% of the population
BMI 26 kg/m2 83 % 57 % 1.9 70 % 25 kg/m2 86 % 63 % 2.4 75 %
Waist 93 cm 83 % 59 % 2.0 71 % 80 cm 86 % 60 % 2.2 73 %
WHR 0.94 81 % 59 % 2.0 70 % 0.81 77 % 60 % 1.9 68 %
screening with a blood test screening 50% of the population
BMI 25 kg/m2 89 % 44 % 1.6 66 % 24 kg/m2 86 % 53 % 1.8 70 %
Waist 90 cm 87 % 47 % 1.6 67 % 77 cm 86 % 49 % 1.7 68 %
WHR 0.93 81 % 53 % 1.7 67 % 0.79 86 % 48 % 1.7 67 %
optimal thresholds, maximizing the average of the sensitivity and specificity
BMI 27 kg/m2 77 % 69 % 2.5 73 % 25 kg/m2 86 % 63 % 2.4 75 %
Waist 97 cm 72 % 74 % 2.8 73 % 85 cm 77 % 74 % 3.0 76 %
WHR 0.95 77 % 65 % 2.2 71 % 0.83 77 % 70 % 2.5 73 %