WORKING
PAPERS
SES
N. 511
XI.2019
Faculté des sciences économiques et sociales Wirtschafts- und sozialwissenschaftliche Fakultät
The Korea discount and
chaebols
Romain Ducret
and
1
The Korea discount and chaebols
Romain Ducret
Dušan Isakov
This version: November 11, 2019
Abstract:
Finance practitioners frequently claim that stocks of Korean firms are undervalued and trade at a discount relative to foreign firms. This phenomenon is commonly called "the Korea discount". It is based on anecdotal evidence comparing either the price-earnings ratios of different market indexes or those of different individual stocks. This paper provides empirical evidence on the existence of such a discount using a large sample of stocks from 28 countries over the period 2002-2016. We find that Korean stocks have significantly lower price-earnings ratios than their global peers. We also investigate the role of large business groups called chaebols, which are often considered to be the main cause of the discount because of their poor corporate governance. Our findings show that it is not the case.
JEL Classification: G15; G32
Keywords: valuation, price-earnings ratio, business groups; emerging markets; Korea
We thank participants of the Accounting and Finance doctoral seminar of the University of Fribourg for their
helpful comments and suggestions. We are responsible for all remaining errors.
University of Fribourg, Boulevard de Pérolles 90, 1700 Fribourg, Switzerland, Email: [email protected] University of Fribourg, Boulevard de Pérolles 90, 1700 Fribourg, Switzerland, Email: [email protected]
2
The Korea discount and chaebols
1. Introduction
Finance practitioners frequently claim that stocks of Korean firms are undervalued and trade at a discount relatively to comparable foreign firms. They call this phenomenon "the Korea discount". This term first appeared in Korea in the aftermath of the 1997 Asian financial crisis but quickly became global when Korea opened its stock market to foreign investors at the turn of the century as this increased the general interest for this market.1 The Korea discount refers to a lower price-earnings (PE) ratio of Korean stocks relative to their global peers (OECD, 2018, p. 75). The evidence on the existence of this discount is obtained either by comparing the level of the PE ratio of a Korean market index (e. g. Noble, 2010) with the PE ratio of an international index or the PE ratio of some Korean firms (e. g. WSJ, 2007) with the PE ratio of foreign peers. However, these comparisons offer only anecdotal evidence and a systematic analysis is necessary to be able to conclude that Korean stocks really trade at a discount. Surprisingly, despite the interest of practitioners and its recurrence in the financial press, this question has not been addressed in the academic literature so far. Our paper fills this gap and provides a detailed empirical research on a large sample of international stocks over the period 2002-2016. We report the presence of a significant discount over this period. Korean stocks have PE ratios that are, on average, lower by 30% than their foreign peers.
Our analysis uses firm-level data and includes firms from 28 countries for the period 2002-2016. The total sample contains 25,863 unique firms and 162,495 firm-year observations. We measure the presence of the Korea discount using three different approaches. Two of them aggregate stocks into portfolios and provide results that are comparable to the index-based anecdotal evidence. A third approach is based on individual stocks. The latter offers a finer view on the presence of the discount as the grouping of stocks into portfolios can eventually hide some differences in valuation ratios. It also offers the possibility to control for firm specific parameters. The results of all three approaches converge in terms of both forward and trailing earnings valuation ratios and document the presence of a significant discount for Korean stocks. In addition to providing a statistical support to practitioner observations, our approach also allows us to document the evolution of the discount over time as well as with respect to different
1 The 1997 Asian crisis and international bail-out of Korea forced the country to reform corporates and financial
markets. Since 1998, most of restriction on foreign equity investment have been removed (Eichengreen et al., 2015, p. 100).
3
reference countries. We notably find that there is a decline of the Korea discount over time. Our results also suggest that the Korea discount is a pervasive phenomenon that affects most Korean industries relative to their foreign counterparts, no matter if these foreign firms are from emerging or developed markets
The financial press and analysts of the Korean market offer different potential explanations for the presence of the discount. These include tensions with North Korea, social and political risks, or poor corporate governance. However, numerous observers attribute the main cause of the discount to the presence of chaebols (The Economist, 2012; OECD, 2018, p. 75). A second objective of this paper is to investigate the role played by these large business groups in the Korean discount. Chaebols are often criticized for their poor governance and the misbehavior of their controlling families (The Economist, 2012; Choi et al., 2018). The governance and risk of expropriation might cause the discount observed at a market level if investors discount firms affiliated to a chaebol for these reasons. If this explanation is valid, we should only observe a discount for firms affiliated to a chaebol. Our results do not support this hypothesis since both chaebol and non-chaebol firms exhibit a significant discount. Moreover, we find that firms affiliated to a chaebol have a lower discount than other Korean firms. This could be due to the gain in international reputation and visibility of some chaebol firms which may have led investors to consider affiliated firms differently from less known Korean firms. This result is also consistent with an alternative explanation, less discussed in the context of the Korea discount, which is related to the substantial economic power that chaebols have accumulated over time. Indeed, policymakers and international organizations point out the negative effect of the dominance of chaebols on competition and competitiveness of other firms typically small and medium-sized enterprises (SMEs) and startups (OECD, 2018, p. 74). The lower valuations of non-affiliated firms could therefore simply reflect the fact that these firms are harmed by the presence of chaebols.
The paper contributes to the literature in the following ways. First, the paper identifies and documents extensively the presence of the Korea discount at the market, industry and individual firm levels. This is an important issue for Korean financial markets that has not been addressed previously in the academic literature. Second, we analyze the role played by chaebols in the discount and find that they are not directly responsible for the lower valuation of Korean stocks. Their role seems to be different from what most observers expect.
The rest of this paper is organized as follows: Section 2 describes the data and the different variables used in the analysis while Section 3 provides empirical results documenting the presence of the Korea discount using different approaches. Section 4 investigates the role
4
played by chaebols in the valuation of Korean firms. Section 5 summarizes the major findings and concludes the paper.
2. Data
This study uses firm-level data to provide a detailed analysis of the Korea discount. We obtain data from three sources: Thomson Reuters Datastream (Datastream), Worldscope, and I\B\E\S. As Karolyi and Kim (2017), we use a number of filters on Datastream to build our sample.2 Our final sample includes publicly listed firms from 28 markets3 covering all continents and both emerging and developed markets. For different tests, countries are also grouped in three geographical areas: Asia-Pacific, emerging markets, and developed markets (based on MSCI classification). Note that Korea is excluded from sub-samples to avoid overlapping issues. We use these three groups of countries to estimate the Korea discount to check the robustness of the discount with respect to different countries of reference. For instance, the discount might only exist with respect to one group of countries which would imply that the discount is not only a Korean phenomenon, but a more general problem. Our sample covers the time period from 2002 to 2016. Our goal is also to analyze the evolution of the discount over time and to document any change. We specifically isolate the global financial crisis to document if there was a difference during this specific episode. We therefore divide the sample into three sub-periods, namely the pre-crisis (2002-2006), crisis (2007-2009), and post-crisis (2010-2016) periods. After deletion of observations with missing data, the final sample contains 25,863 unique firms for 162,495 firm-year observations.
[Insert Table 1 here]
Table 1 shows the number of firms from each country included in our sample as well as their evolution over time. We observe that the coverage of firms from developed markets remains fairly stable over time while the number of firms from emerging market and Asia-Pacific has increased. The data on both historical and forecasted earnings are obtained from the
2 The following filters are used in DFO navigator: category (Equities), market, currency (local currency), type
(Equity), security (Major), and quote (Primary). For some countries, firms that are not listed on a domestic exchange are excluded. Dead and active securities are kept in order to avoid survivor bias.
3 The sample includes Australia, Austria, Belgium, Brazil, Canada, Chile, France, Germany, Hong-Kong, India,
Indonesia, Israel, Italy, Japan, Korea, Malaysia, Netherland, New Zealand, Singapore, South Africa, Spain, Sweden, Switzerland, Taiwan, Thailand, United Kingdom, and US. We do not include China due to the valuation issue regarding different classes of shares.
5
Institutional Brokers' Estimate System (I\B\E\S) database covering a large number of countries and firms. This data is also widely used by practitioners.
As the Korea discount is generally defined in terms of PE ratio (see Appendix 1), we only consider the PE ratio in our analysis. Moreover, this ratio is very important for analysts as they essentially support their stock recommendation (Brown et al., 2015) with this measure.4 Finally, investors primarily use this ratio to assess the possible under/over-valuation of a stock. Even though the anecdotal evidence on the Korean discount is mostly based on forward valuation (see Appendix 1), we analyze both 12 months trailing and 12 months forward earnings valuation ratios. The former refers to realized earnings, whereas the latter is based on the expected earnings (Welch, 2009, p. 47). The trailing ratio corresponds to a realized or historical perspective, whereas forward valuation has a prospective dimension. From an investor point-of-view, the trailing ratio may be interpreted as how the market values the current/realized performance, whereas the forward valuation reflects more market expectations. The results might therefore be different for the two measures. For each firm, we collect the 12 months trailing earnings per share (item EPS1TR12) and forward earnings per share (item EPS1FD12) measured at year-end. Both are expressed in local currency. We also collect the year-end price (item IBP) expressed in local currency, and number of outstanding shares (item IBNOSH). From Worldscope, we collect the market capitalization in local currency (item 08001) and the market capitalization expressed in US dollars (item 07210). We use the Industry Classification benchmark (ICB) provided by FTSE Russell as industry classification. For each firm, we collect industry (item ICBIC), and sector (item ICBSC) level data.
The tests in Section 4 require information relative to the affiliation to chaebols for Korean firms. To determine whether Korean firms are affiliated or not to a chaebol, we use the Korean Fair Trade Commission (KFTC) classification. This is a common practice in the literature (see for instance Black et al., 2015; Hwang and Kim, 2016; Kim et al., 2019). We consider as a chaebol firms, firms that are affiliated to one of the 30 largest business groups as classified by the KFTC. Authors working in this area motivate the choice of analyzing separately affiliation to one of the 30 largest chaebols by their economic power, higher diversification, and difference in capital and ownership structure (Bae et al., 2002). With this definition, on average, 27.1% of the Korean firms included in our sample are considered as
4 According to a survey conducted by Brown et al. (2015), analysts use mostly the earnings and
price-earnings-growth ratios. 61.33 percent of the respondents claim to use these ratios very often. This result is consistent with Block’s (1999) survey findings.
6
being affiliated to a chaebol. They represent 67.6% of the total market value of the Korean market.
3. Estimation of the Korea discount
This section presents estimates of the Korea discount. We first provide statistical evidence of the existence of this phenomenon. Second, we analyze the evolution of the Korea discount over time. We also investigate if Korea discount is a market-wide or industry-specific phenomenon. Our analysis is performed with three different approaches. The two first approaches are based on the valuation of portfolios. First, we use market-wide portfolios (market portfolio approach hereafter) to replicate the comparison of country indexes as it is usually done in financial press to illustrate the Korea discount. However, the main drawback of the market portfolio approach is the lack of time-series observations, which does not allow to analyze statistically the differences between two portfolios. To address this issue and conduct a more rigorous analysis, we build portfolios containing stocks of the same country and industry and compute their PE ratio (industry portfolio approach hereafter). The industry portfolio approach allows the analysis of difference in Korea discount across industries and its evolution over time. The third empirical approach is based on the PE of individual firms (individual stock approach hereafter). This approach allows controlling for firm-level characteristics. It also offers a finer view on the presence of the discount as the grouping of stocks into portfolios can eventually hide some differences in valuation ratios.
3.1. Market portfolio approach
We first replicate the results obtained with market indexes by analysts and journalists to illustrate the Korea discount phenomenon. To do so, we compute market-level portfolio valuation ratio. The methodology used to compute market-level valuation is inspired by MSCI methodology (MSCI, 2019). The market-level PE ratio is computed as the ratio between the year-end sum of market capitalizations in USD divided by the sum of total earnings (forward
7
or trailing) in USD. 5 This measure of market-level value can be interpreted as an aggregated and value weighted measure.
[Insert Figure 1 here]
Figure 1 presents evolution of forward (left hand figure) and trailing (right hand figure) PE ratio of Korea (dotted red line) and the full sample (blue line). Consistent with practitioners' anecdotal evidence, we observe the lower valuation level of the Korean market relative to the full sample both in terms of trailing and forward PE ratios. The only exception is the worst year of financial crisis (2008) when the valuation of the Korean market exceeded the valuation of other markets. The quick recovery of Korean economy can explain this phenomenon. Over the full period, we observe an upward trend for the valuation of the Korean market and a decline in valuation difference.
[Insert Table 2 here]
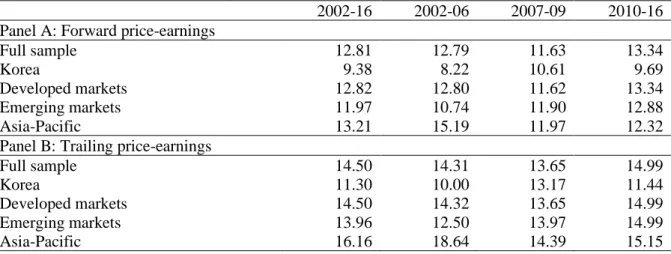
Table 2 presents mean valuation ratios for the full sample length (2002-2016) and for three different sub-periods. The average valuations obtained for the different periods confirm the observations based on Figure 1. For all sub-periods, Korean market exhibits a lower valuation than the full sample as well as other geographical areas. This observation is valid for both forward and trailing ratios, even though we find slightly smaller differences when valuation is compared in terms of trailing ratio. We also find that the difference in valuation depends on the geographical area used as benchmark. For instance, the difference in valuation between Korean market and emerging markets is lower than the difference with developed market. The industry portfolio and individual stocks analysis in the following subsections confirm these observations.
Consistent with anecdotal evidence from practitioners and the financial press, this first analysis based on market portfolio approach reveals a lower valuation ratio of Korean market
5 Formally, the PE ratio of an index composed of N stocks is computed as (MSCI, 2019, p. 47):
𝑃𝐸 = ∑ 𝑃𝑖∗ 𝑆ℎ𝑎𝑟𝑒𝑖∗𝐹𝑋1 𝑖 𝑁 𝑖=1 ∑ 𝐸𝑃𝑆𝑖∗ 𝑆ℎ𝑎𝑟𝑒𝑖∗𝐹𝑋1 𝑖 𝑁 𝑖=1
in which, 𝑃𝑖 is the year-end share price of firm i, 𝐸𝑃𝑆𝑖 is the earning-per-share (forward or trailing) of firm i,
𝑆ℎ𝑎𝑟𝑒𝑖 is the number of shares outstanding by firm i, and FX is the exchange rate between the currency of firm i
8
relative to other markets. Except during the global financial crisis, the difference in valuation is observed during the full period under review (2002-2016) and relative to different benchmarks. Our analysis also confirms that the Korea discount is not due to index construction or valuation methodology used by index providers. If the market portfolio approach has the advantage of being close to practitioners' practices, a major drawback is the impossibility to test statistically the existence of the Korea discount because of the modest number of observation points available.
3.2 Industry portfolio approach
To address the issue of the lack of observations present in the market portfolio analysis but nevertheless keeping an aggregate data approach, we develop an industry by country-level analysis. The industry portfolio approach allows using pooled regression to estimate the Korea discount. In addition, through cross-section and time series estimations, this approach allows a finer analysis of the phenomenon by documenting its evolution over time and presence across industries. A difference between market and industry portfolio approaches is the weighting of each industry. In the market portfolio approach, each industry is value-weighted at the country-level, whereas industries are equally weighted in the case of industry portfolio approach. Another difference between the market and industry portfolio approaches is the effect of exchange rates. Indeed, in the case of market portfolios, valuation is expressed in USD, whereas industry by country portfolios valuation ratios are computed in local currency.
Instead of sorting firms by geographical area as in the market portfolio approach, we sort firms by industry and then by country. The valuation of the industry by country annual portfolios is computed using the same methodology as for market portfolios. However, a drawback of industry portfolio approach is the limited number of firms in some industries making the estimation of country-level value sensitive to some outliers. To mitigate this issue, we winsorize the portfolios at the 1 and 99 percent levels. The estimate of the Korea discount is then obtained using industry portfolio-level pooled regression. The baseline model corresponds to equation (1)
𝑃𝐸𝑐,𝑘,𝑡 = 𝛼0+ 𝛿1 𝐾𝑜𝑟𝑒𝑎 + 𝛿2,𝑘 𝐼𝑛𝑑𝑢𝑠𝑡𝑟𝑦 + 𝛿3,𝑡 𝑌𝑒𝑎𝑟 + 𝜀𝑐,𝑘,𝑡 (1)
where the PE ratio of portfolio for industry k in country c in year t is regressed on a Korea indicator, a dummy variable equal to one in the firm is from Korea. The regression also includes an industry (ICB industry-level) and year fixed effects. Since our analysis has a
time-9
series dimension, the inclusion of year dummies allows controlling for macroeconomic trend. The coefficient 𝛿1 measures the difference in PE ratios between Korean portfolios and benchmark portfolios (other countries) after controlling for industry and fixed effects.
[Insert Table 3 here]
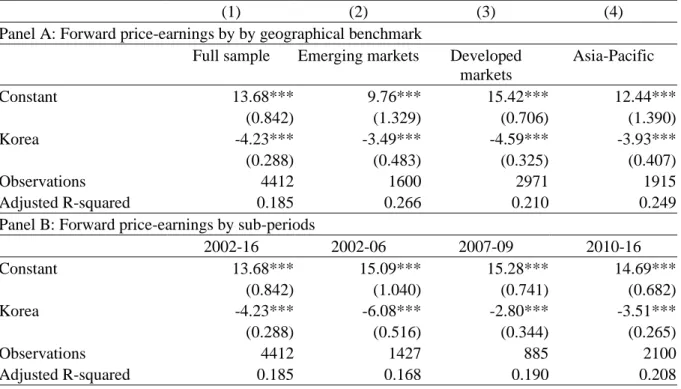
Table 3 presents the results of different estimations of equation (1). In Panel A, the Korea discount is estimated relative to different geographical benchmarks (group of countries). The goal of this analysis is to check if the Korea discount appears only relative to a certain type of countries. We report that, regardless of the benchmark, the coefficients of the Korea indicator is negative and highly significant meaning that, on average, the Korean market is discounted relative to other markets. However, we find some differences in terms of magnitude depending on the benchmark group of countries used. Reported to the sample mean6, the Korean market is discounted by 30.90 percent relative to developed markets, whereas the discount relative to other emerging markets is 25.64 percent. 7 The difference in discount magnitude depending on benchmark are consistent with observations made in the market portfolio approach (in Table 2). In Panel B, we estimate the Korea discount on the three sub-periods corresponding to pre-crisis, pre-crisis, and post-crisis periods. The results of the industry portfolio approach confirm the decline in magnitude observed in the market portfolio approach. We observe the smallest Korea discount during the financial crisis period which is consistent with our previous observations. The results for trailing ratio are provided in Appendix 2 and reveal some slight differences with results for forward earnings. We find that the discount relative to Asia-Pacific markets is larger than the discount relative to developed markets, whereas the discount for crisis-period is higher than the discount for post-crisis period. Results of Table 3 and Appendix 2 support the existence of a Korea discount which is robust to markets used as benchmark as well as to the periods studied.
Differences in industrial structure can possibly bias the interpretation based on valuation of market index since valuation levels differ from an industry to another. In addition, the Korea discount may be an industry specific rather than market-wide phenomenon. Typically, the financial press illustrates the Korea discount with market-level valuations. Such comparisons do not allow identifying potential industry effects. To investigate the discount at the industry-level, we use an interaction term between the Korea indicator and industry variable.
6 The mean is computed based on the sample of countries used as benchmark excluding Korea.
10
Coefficients of interaction terms provide industry-level Korea discount estimates. Figure 2 illustrates industry-level discount estimates for pre- and post-crisis periods.8 To ease the reading, the discount is expressed in positive value and as percentage of the mean industry valuation.
[Insert Figure 2 here]
In pre-crisis period (black bars), all industries are significantly discounted relative to similar industries in other countries. The magnitude of the discount ranges from 27.78 percent for consumer staples (ICB 45) to 52.83 percent in health care industry (ICB 20). In post-crisis period (grey bars), all industries remain discounted except health care industry exhibiting a non-significant premium. Consistent with previous observations, we also note a decline in magnitude of the discount in all industries except for the energy industry. However, this decline differs from an industry to another. The largest differences are observed for health care (ICB 20), financial (ICB 30), consumer staples (ICB 45), and industrial (ICB 50) firms. On the other hand, the discounts affecting technological (ICB 10), telecommunication (ICB 15), and consumer discretionary (ICB 40) firms remain stable. Industry-level analysis reveals that the Korea discount phenomenon affects all industries and is not due to the misvaluation of a specific industry. The analysis also provides an additional evidence of the decline of the Korea discount overtime.
While the market portfolio approach allows to replicate and confirm the results put forward by practitioners and media, the industry portfolio approach provides a strong statistical support to the existence of the Korea discount. Consistent with the observations made in Subsection 3.1, we find that the discount is statistically robust to the geographical area used as benchmark. We also find evidence of the persistence of the phenomenon even though the magnitude of the Korea discount decreases over time. Finally, our results show that the phenomenon is widely spread across Korean industries.
3.3 Individual stock approach
In this part of the analysis, we fully exploit the depth of the firm-level sample to address the issues related to the identification based on aggregated data. The identification strategy is based on pooled regression including a set of control for size, time, and industry controls.
11
Controlling for time, industry and size allows measuring a clean discount. To capture and measure the Korea discount, we add an indicator variable for Korean firms. The baseline model is given by equation (2).
𝐸𝑃𝑖,𝑡 = 𝛼0+ 𝛿1 𝐾𝑜𝑟𝑒𝑎 + 𝛿2𝑆𝑖𝑧𝑒 + 𝛿3 𝐼𝑛𝑑𝑢𝑠𝑡𝑟𝑦 + 𝛿4,𝑡 𝑌𝑒𝑎𝑟 + 𝜀𝑖,𝑡 (2) where the earnings-to-price (EP) ratio of firm i at time t is regressed on the Korea indicator and the set of controls. Industry is controlled at an ICB sector-level. As control for size, we classify firms into deciles by relative market value at country-level. We then create dummy variables for each size decile. This measure has the advantages to be independent of exchange rates and to take into account differences in terms of size between markets. As a robustness check, we use the market value in USD as a control for size instead of decile size dummies. Estimation of the Korea discount does not change significantly (see Appendix 4).
Ideally, our study should analyze PE ratios as they are the standard measure used to document the Korea discount. However, one of the drawbacks of the PE ratio is that this metric becomes meaningless for firms generating negative earnings (Palepu et al., 2016, p. 313). In addition, this measure presents a discontinuity around zero earnings. Indeed, the ratio switches from an infinitely positive value to an infinitely negative value when earnings turn negative (Welch, 2009, pp. 512-513). This specificity may generate several issues for empirical analyses involving individual stocks.9 The non-linearity of the ratio (dependent variable) makes OLS inference difficult. For a given share price, two firms with extreme loss/gain have close PE despite of large differences in terms of earnings. On the other hand, the difference of ratios between two firms generating a small loss/gain is large. In addition, excluding firms with negative PE ratio may bias results since poor performing firms (in terms of earnings) are systematically excluded (Welch, 2009, p. 514). This is especially relevant considering that our sample includes the global financial crisis period and is likely to include a larger proportion of firms generating losses. For these reasons, as other authors do, we prefer to use the EP ratio instead of PE ratio.10 Also called earning yield, EP ratio at a firm-level is computed as the earnings per share (forward or trailing) divided by the year-end share price. This ratio allows having a measure continuous through zero. This transformation implies to invert the
9 Note that these problems are less severe or non-existent for portfolios, which justifies the use of PE for the
market and portfolio approaches.
12
interpretation of ratio as well. High EP ratio means low valuation and low EP denotes high firm valuation. Table 4 presents results for the baseline regression (2).
[Insert Table 4 here]
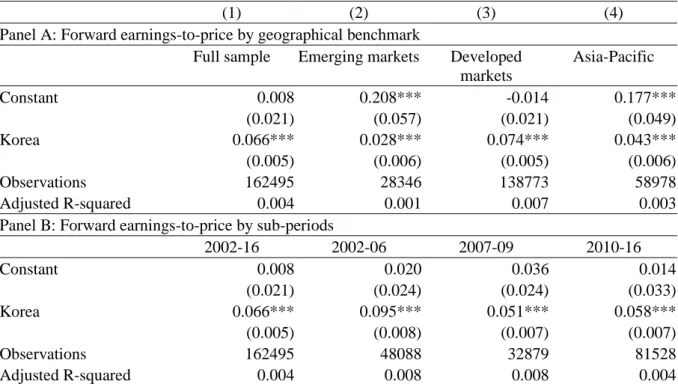
Table 4 presents results for individual stocks approach. Since the dependent variable is earnings-to-price ratio instead of price-earnings, a positive coefficient on Korea dummy indicates a discount. As for the industry portfolio approach, we first test the robustness of the Korea discount relative to different geographical areas. Results are presented in Panel A and reveals a significant discount regardless the geographical area used as benchmark. Results are qualitatively consistent with the results obtained for the industry portfolio approach. The strongest discount appears when Korean firms are compared with developed market firms, whereas the discount relative to other emerging market firms is the smallest. A quantitative comparison of results is more difficult since weighting schemes of both approaches are not the same. Firms are value weighted in portfolio approaches, whereas they are equally weighted in pooled regressions. In addition, the individual stocks approach includes control for firm size. Results for trailing earnings ratio presented in the Appendix 3 are consistent except for the discount relative to emerging markets firms that becomes insignificant.
Panel B of Table 4 presents the results for the evolution of the Korea discount over time. The decline in the discount between pre- and post-crisis periods observed in the portfolio approach is confirmed for the individual stock analysis. We also observe a lower discount during the financial crisis period. The results are similar for trailing valuation ratio (see Appendix 3). The decline of Korea discount may find an explanation in the development and reforms undertaken since the previous financial crisis in Korea. The 1997 Asian crisis triggered reforms in Korea aiming to improve internal and external corporate governance mechanisms (Claessens and Yurtoglu, 2013) as well as the financial situation of firms (Eichengreen et al., 2015, p. 95). In addition, the depreciation of the Korean won and fiscal response stimulated exports and domestic demand. As a result, Korea experienced a quick recovery after the financial crisis proving its resilience and the ability of authorities to answer crisis (OECD, 2010; BOK, 2016). The upgrade of South Korea from emerging to developed country by FTSE in September 2009 is another illustration of the development and the economic strength of the country during the 2000s (Woods, 2013).
Finally, we compute industry-discount using an interaction between Korea indicator and industry dummies (at industry classification level). Results are provided in Appendix 5 and tend
13
to confirm observations of Figure 3 suggesting that the Korea discount is a widespread rather than being limited to some industries.
The individual stocks approach provides results consistent with those obtained for the market and industry portfolio approaches. They confirm the statistical robustness of the existence of the Korea discount even after accounting for size and industry effects. In addition, the results for the individual stocks approach also document a decline over time of the level of the discount which has been observed in previous analyses. Finally, the Korea discount appears to be a market-wide phenomenon since most of Korean industries exhibit a discount relative with their global peers. If the results of different empirical approaches converge in terms of interpretation, they have their own specificity that does not allow comparing them quantitatively. Indeed, the weights of firms, industry, and country differ from an approach to another. In market portfolio approach, countries and firms are value weighted. In addition, this approach takes into account the effects of exchange rate. In the industry portfolio approach, firms are value weighted within industries, but industries and countries are equally weighted. Finally, the individual stock approach attributes the same weight to all firms. The fact that the results converge qualitatively despite these differences indicates that the discount is a robust phenomenon affecting all Korean firms.
3.4 Korea discount, corporate governance and financial development
As the discount appears to be a pervasive phenomenon across Korean firms, it might be due to some common factors. The general level of corporate governance in Korea is also often cited as a potential cause of the Korea discount phenomenon. Another possible common factor is the level of financial development. Indeed, we observe in Table 2 that emerging markets exhibit a lower valuation than developed markets. In order to control for these two possible explanations, we estimate Korea discount using models including country-level controls for corporate governance and development. To control for corporate governance, we include a set of dummy variables for legal origin. La Porta et al. (1998) document a link between the origin of the legal system of a country and shareholder protection. Korea has a German inspired legal system offering a better shareholder protection than French system, but less protection than common law countries. We also estimate models including controls for minority shareholder protection proxy namely minority shareholder protection score provided by the World Bank (WB) and the score of protection of minority shareholders provided by the World Economic Forum (WEF). Note that the former enters in the composition of the Doing business report published annually by the WB, whereas the second measure is part of the Global
14
Competitiveness Report established by the WEF and published every year. To control for the development of financial markets, we use the market size measured by the market capitalization of domestic firms expressed as the percentage of the GDP and the score of financial market development computed by the WEF as the 8th pillar of Global Competitiveness score. The availability of governance and development data is limited. In order to have a similar sample for different tests, we delete all observations with missing data. The final sample covers a restricted period from 2006 to 2015 and excludes Sweden and Taiwan.
[Insert Table 5 here]
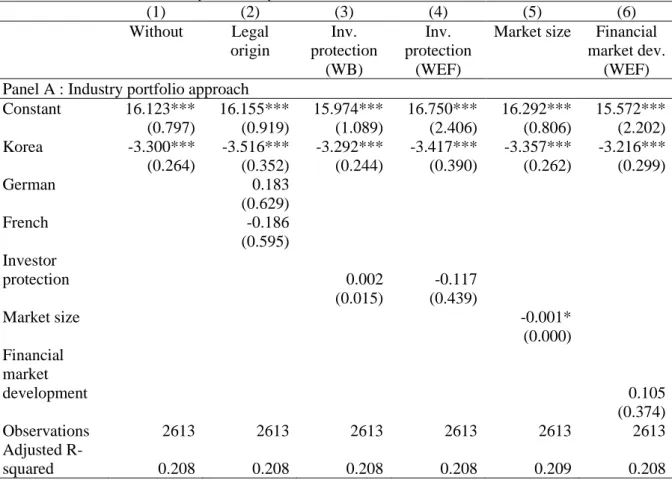
The results for models including governance and development control variables are reported in Table 5. Regardless of the governance or development proxy used, the Korea discount remains statistically significant for both industry portfolio approach (Panel A) and individual stock approach (Panel B). Note that the Korea discount remains significant after controlling for governance and development in terms of trailing valuation (see Appendix 6) as well. The results of these additional tests show that the Korea discount persist even after accounting for differences between countries in terms of corporate governance as well as in terms of economic and financial development. In addition, their effect on the magnitude of the Korea discount seems very limited suggesting that the major part of the phenomenon has other origins.
4. Role of chaebols in the Korea discount
Since numerous observers attribute the main cause of the discount to the presence of chaebols, we analyze specifically the link between the Korea discount and chaebols. Chaebols are family-run business groups that play a central role in the Korean economy. The emergence and development of chaebols came hand to hand with the industrialization of South Korea. To rebuild and industrialize Korea after the devastations of World War II and the Korean War, the government decided to develop certain industries. Selected entrepreneurs benefitted from support and privileged access to scarce resources in reward for implementing government strategy. The government support and protection transformed some initially small family businesses into large and diversified business groups (Eichengreen et al., 2015, pp.142-147). Chaebols contributed to turn Korea from one of the poorest countries to one of the most advanced economies and largest exporters in the world (Eichengreen et al., 2015, p.1).
15
However, the success of chaebols also generated some problems. The Korean economy became heavily dependent on those business groups that accumulated a substantial economic power. The excessive economic power of chaebols is likely to affect market competition and harm competitiveness of SMEs (OECD, 2018, p. 74). In addition, preferential loans provided by government fosters debt financing of chaebols. The high leverage made some chaebols financially vulnerable. As consequence, the 1997 Asian financial crisis led to the collapse of many chaebols and the country was heavily affected by this crisis requiring the intervention of the International Monetary Fund (Powers, 2010). Finally, chaebols are often criticized for their supposedly poor corporate governance and minority shareholder expropriation. These problems might affect the valuation of firms affiliated to a chaebol, but poor corporate governance is the main reason put forward by observers (The Economist, 2012).
4.1 Corporate governance of chaebols
Firms affiliated to a chaebol potentially suffer from a poor corporate governance and their non-controlling shareholders are exposed to expropriation by controlling shareholders. The structure of chaebols are the roots of these risks. Indeed, unlike conglomerates in which subsidiaries are wholly owned, firms affiliated to a business group are often publicly traded and rarely fully owned by the controlling shareholder (Colpan and Hikino, 2010, p. 27). Different mechanisms such as cross-shareholding, pyramids as well as appointment of individuals related to chaebols on the board of directors and/or in executive positions provide control over affiliates to shareholders with a limited amount of equity investment (Bae et al., 2002; Hwang and Seo, 2000). Therefore, the presence of a controlling shareholder with relative low equity stake creates principal-principal agency conflicts worsened by the fact that group-level interests are often prioritized over affiliate-level (and thus minority shareholder) interests (OECD, 2018, p. 79; Hwang and Seo, 2000). In addition, controlling families are often accused of nepotism and to favor their own interest instead of other shareholder wealth (Brown, 2001). Academic literature reports evidence of expropriation of minority shareholders through tunneling (Black et al., 2015), acquisitions (Bae et al., 2002; Bae et al., 2008), or during successions (Hwang and Kim, 2016). Since the finance literature documents a positive association between corporate governance and firm valuation (Gompers et al., 2003; Bebchuk et al. 2009) and chaebol affiliates account for a large share of Korean stock market (30% of firms and 68% on market value in our sample), it is reasonable to think that poor governance in chaebols is reflected in the valuation of the whole market, leading to the existence of the Korea discount.
16 4.2 Chaebols and the Korea discount
We analyze the role of chaebols using both industry portfolio and individual stock approaches. The procedure for industry portfolio approach is similar to the one used in Section 3 except that we split Korea portfolio into chaebol and non-chaebol firms portfolios. This method allows us computing discount for chaebol and non-chaebol firms by including a dummy variable for Korean chaebol and Korean non-chaebol portfolios in equation (1). In addition to portfolio approach, we also test the difference in valuation between chaebol and non-chaebol firms using individual stocks approach. To do so, we add to equation (2) a set of two dummy variables taking a value of one for Korean non-chaebol firms and one for Korean chaebol firms respectively, and zero for non-Korean firms. If the affiliation to a chaebol (and therefore poor corporate governance) is the main driver of the discount, we should only find a lower valuation for chaebol affiliates and no discount for unaffiliated firms.
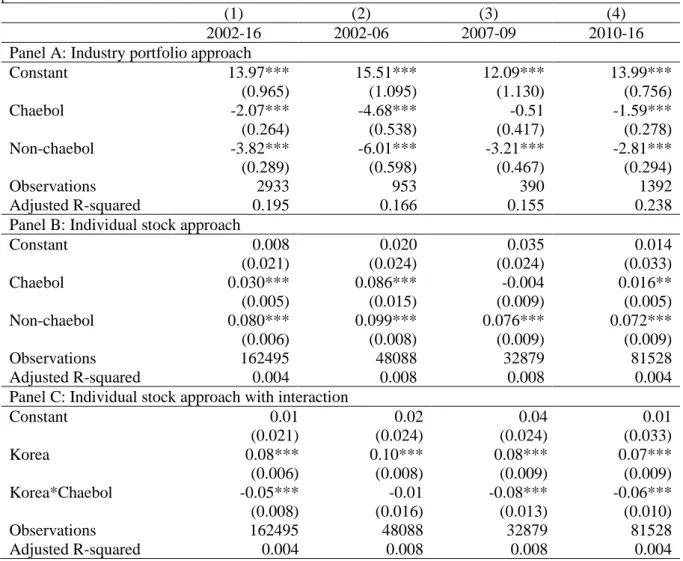
[Insert Table 6 here]
Table 6 presents results for the estimation of the discount affecting chaebol and non-chaebol Korean firms relative to their foreign peers. Both industry portfolio (Panel A) and individual stock (Panel B) approaches provide qualitatively similar results. First, we observe that chaebol affiliates exhibit a lower discount than non-chaebol firms over the full sample length as well as different sub-periods studied. Over the full period and in terms of forward PE, the chaebol portfolio is discounted by 14.33 percent in comparison with other country portfolios, whereas non-chaebol portfolio exhibits a discount of 26.44 percent. The results exhibited in Table 6 are consistent with the decline in the Korea discount observed in the market-level analysis. We observe that the discount on non-chaebol firms decreases gradually, whereas the discount on chaebol firms drops and is non-significant during the financial crisis. This observation suggests that chaebol firms are likely to be responsible of the lower discount observed during the financial crisis for the full sample.
The higher valuation of chaebol firms relative to non-chaebol firms does not support the hypothesis that chaebol affiliates and their poor governance is the main cause of the Korea discount. They show that both types of firms suffer from the discount and that affiliation to a chaebol in Korea has positive effect on valuation. Therefore, it is not chaebol affiliates that drive value of the Korean market down. In order to test if the there is a significant difference between discount of chaebol and non-chaebol firms, we use the individual stock approach and add an interaction terms between Korea and chaebol indicator. The results in Panel C show that
17
the difference in discount between chaebol and non-chaebol firms becomes statistically significant since the financial crisis. This result is valid for both forward and trailing valuation ratio (see Appendix 7). The higher valuation of chaebol affiliates relative to unaffiliated firms is, to some extent, consistent with the existing literature as it finds that chaebol affiliation is associated with a valuation premium during the 2000s (Black et al., 2006; Lee et al., 2010). However, the relative valuation of chaebol is found to be changing over time. During the 1980s, affiliation to a chaebol had a value enhancing effect (Lee et al., 2010) that turned into a discount during the 1990s (Ferris et al., 2003; Lee et al., 2010).
Why did the discount decrease or even disappear for chaebols affiliates since the financial crisis? There are different possible explanations for the change in the discount of affiliated firms. First, it is likely that chaebol affiliates suffered less and recovered faster from the global financial crisis than unaffiliated Korean firms as reported by Oliver (2010). Indeed, academic literature provides both theoretical and empirical evidence of the benefits of business group affiliation during crisis periods. Indeed, business groups are often seen an answer to institutional voids or market failures (Leff, 1978). During the 1997 Asian financial crisis, chaebol affiliates were on average less affected by the crisis (Chang, 2006; Almeida et al., 2015), benefitted from better access to financing (Gormley et al., 2015), and experienced faster recovery (Lee et al., 2010; Goh et al., 2016). Empirical evidence also suggest a beneficial effect of business group affiliation in Chile (Santioni et al., 2019) and Italy (Buchuk et al., 2019) during the global financial crisis.
A second explanation is the change in the investor perception of some large Korean firms relative to their foreign competitors. The fact that MSCI still classifies South Korea as an emerging market whereas FTSE upgraded the country in 2009 illustrates the debate regarding the classification of Korea (Woods, 2013). Despite of this unclear classification, some Korean firms gained an international reputation and visibility in playing a leading role in some industries such as consumer electronics, semiconductors or automotive since the mid-2000s.11 Access to resources such as capital, skilled workforce and knowledge represent a competitive advantage for chaebol affiliates relative to unaffiliated firms especially in the context of globalized and fierce competition requiring investment in R&D. These elements are likely to
11 For instance, Samsung dominates the semiconductor industry, whereas SK Hynix an affiliate of SK Group is
another key player in this industry. The success of Samsung in consumer products such as smartphones contributes to the visibility of the brand. On this market, the share of Samsung jumped from 3.3 to 20.4 percent between 2009 and 2015. For instance, in the annual ranking of brand value established by Brand Finance, Samsung jumped from the 32nd to the 3rd rank between 2007 and 2016, whereas during the same period Hyundai moved from the 154th to
18
have an impact on the perception of foreign investors, who might treat chaebol firms differently from other Korean firms due to their international reputation.
Changes in the legal framework are also likely to have narrowed the differences between chaebol firms and their international counterparts. In 2009, a series of reforms targeting primarily business groups abolished some equity investment restrictions and increased disclosure requirement to promote market monitoring (KFTC, 2009 and 2010). In addition, the mid-2000s is also marked by an increase in domestic and foreign shareholder activism (Song, 2006 and 2012; Lim, 2007). For instance, in 2006, a group of investors led by Carl Icahn entered in the capital of KT&G pushing for changes in order to enhance shareholder value (Lim, 2006). Another example is the Dubai-based Sovereign Asset Management that entered in the capital of SK Corp and asked for changes in the management (Song, 2012).
Resilience and recovery from the financial crisis, changes in investor perception towards large Korean firms and reforms are all likely to reduce the discount affecting chaebols firms and therefore increasing the difference in valuation between chaebol and non-chaebol firms. This difference is also consistent with an alternative explanation, less discussed in the context of the Korea discount, which is related to the substantial economic power that chaebols have accumulated over time. Indeed, policymakers and international organizations point out the negative effect of the dominance of chaebols on competition and competitiveness of other firms. The lower valuations of non-affiliated firms could therefore simply reflect the fact that these firms are harmed by the presence of chaebols. However, the identification of the exact determinants of the discount is beyond the scope of this paper and deserves a specific research focused on this issue. Our objective was to investigate the claim made by several observers that the Korea discount is solely due to the chaebols. We show that it is not the case but that chaebols certainly play an indirect role in the existence of the discount.
5. Conclusion
Different observers of the Korean economy claim that domestic stocks are undervalued and trade at a discount relative to foreign firms. This phenomenon is called "the Korea discount". However, so far, this claim is only based on anecdotal evidence comparing different indexes or different individual stocks. This paper is the first to provide scientific evidence on the existence of this discount. Using a large sample of international stocks over the period 2002-2016, we find that Korean stocks exhibit, on average, a PE ratio significantly lower by 30% than their global peers. We use different approaches to document empirically the existence of
19
this discount. They all converge to the same conclusions and our results show that the phenomenon is pervasive as it affects most Korean stocks. It is present in all industries and over the whole sample period. The discount is significant with respect to all countries of reference used to measure it. Korean stocks have lower PE ratios than firms from developed and emerging markets, as well stocks from the Asia-Pacific region. We also document that the discount tends to decrease over time and that is smaller in recent years. It has even completely disappeared during the peak of the financial crisis in 2008. The presence of the discount is robust to factors such as differences between countries in terms of corporate governance as well as in terms of financial development. The second part of our analysis investigates the link between the Korea discount and chaebols. These powerful business groups dominate the Korean economy and are often cited as a potential cause of the Korea discount. Observers assume that they are responsible of the discount because of their poor corporate governance and the high risk of minority shareholder expropriation, which should drive down their market valuation. Our results do not support this explanation as we find that the discount affects both chaebol and non-chaebol firms. Furthermore, we find that the discount of chaebol firms is significantly lower than the discount of other Korean firms since 2007. This result is possibly associated with the substantial market power of chaebols and its effect on unaffiliated firms. It could also be due to the fact that some chaebol firms gained an international reputation and visibility which could also lead investor to consider chaebol firms differently than less known Korean firms. However, the exact identification of the determinants of the discount is beyond the scope of this paper. We leave it for further research. Nevertheless, our paper contains two main contributions. It documents the existence of "the Korea discount", an issue not addressed by the academic literature so far, and analyzes the role of chaebols, showing that they are not the main cause of the discount.
20
References
Almeida, H., Kim, C. S., and H. B. Kim, 2015, Internal capital markets in business groups: Evidence from the Asian financial crisis, Journal of Finance, 70(6), 2539-2586.
Bae, G. S., Cheon, Y. S., and J. K. Kang, 2008, Intragroup propping: Evidence from the stock-price effects of earnings announcements by Korean business groups, Review of Financial
Studies, 21(5), 2015-2060.
Bae, K. H., Kang, J. K., and J. M. Kim, 2002, Tunneling or value added? Evidence from mergers by Korean business groups, Journal of Finance, 57(6), 2695-2740.
Bank of Korea (BOK), 2016, The Korean Economy
Beaver, W., and D. Morse, 1978, What determines price-earnings ratios?, Financial Analysts
Journal, 34(4), 65-76.
Bebchuk, L., Cohen, A., and A. Ferrell, 2009, What Matters in Corporate Governance?, The
Review of Financial Studies, 22(2), 783-827.
Black, B. S., Jang, H., and W. Kim, 2006, Does corporate governance predict firms' market values? Evidence from Korea, Journal of Law, Economics, and Organization, 22(2), 366-413. Black, B., Kim, W., Jang, H., and K.-S. Park, 2015, How corporate governance affect firm value? Evidence on a self-dealing channel from a natural experiment in Korea, Journal of
Banking & Finance, 51, 131-150.
Block, S. B., 1999, A study of financial analysts: Practice and theory, Financial Analysts
Journal, 55(4), 86-95.
Buchuk D., Larrain, B., Prem, M., and F. Urzúa, 2019 (forthcoming), How Do Internal Capital Markets Work? Evidence from the Great Recession, Review of Finance
Brand Finance, 2007, The annual report on the world’s most valuable brands, January 2007. Brand Finance, 2016, Global 500 The annual report on the world’s most valuable brands, February 2016.
Brown, H, 2001, The Korea discount, Forbes, April 16
Brown, L. D., Call, A. C., Clement, M. B., and N. Y. Sharp, 2015, Inside the “black box” of sell‐side financial analysts, Journal of Accounting Research, 53(1), 1-47.
Chang, S. J., 2006, Business groups in East Asia: Post-crisis restructuring and new growth, Asia
Pacific Journal of Management, 23(4), 407-417.
Choi, H., Kang, H. G., and C. Lee, 2018, What Constitutes “Too Big to Jail?” Evidence from South Korea's Family Business Groups, Asia‐Pacific Journal of Financial Studies, 47(6), 881-919.
Claessens, S., and B. B. Yurtoglu, 2013, Corporate governance in emerging markets: A survey,
Emerging Markets Review, 15, 1-33.
Colpan, A. M., and T. Hikino, 2010, Foundations of business groups: towards an integrated framework, in Colpan, A. M., Hikino, T., ad J. R. Lincoln, editors, The Oxford handbook of
21
Eichengreen, B., Lim, W. Lim, Park Y., and D. Perkins, 2015, The Korean Economy: From a
Miraculous Past to a Sustainable Future, Cambridge and London, Harvard East Asian
Monographs.
Ferris, S. P., Kim, K. A., and P. Kitsabunnarat, 2003, The costs (and benefits?) of diversified business groups: The case of Korean chaebols, Journal of Banking & Finance, 27(2), 251-273. Goh, J., Choi, W., and J. Cho, 2016, Changes in chaebol firms’ overinvestment after the Asian financial crisis: a long-term perspective, Asia-Pacific Journal of Accounting & Economics, 23(1), 75-111.
Gompers, P., Ishii, J., and Metrick, A., 2003, Corporate governance and equity prices, Quarterly
Journal of Economics, No. 118, 107-155.
Gormley, T. A., Johnson, S., and C. Rhee, 2015, Ending “too big to fail”: government promises versus investor perceptions, Review of Finance, 19(2), 491-518.
Harris, B., 2017, Taking on Korea Inc, Financial Times, September 13.
Hwang, I., and J. H. Seo, 2000, Corporate Governance and Chaebol, Seoul Journal of
Economics, 13(3).
Hwang, S, and W. Kim, 2016, When heirs become major shareholders: Evidence on pyramiding financed by related-party sales, Journal of Corporate Finance, Volume 41, 23-42.
Karolyi, G. A., and D. Kim, 2017, Is the Public Corporation Really in Eclipse? Evidence from the Asia‐Pacific, Asia‐Pacific Journal of Financial Studies, 46(1), 7-31.
Kim, W., Ko, Y. K., and S.-F. Wang, 2019, Debt restructuring through equity issues, Journal
of Banking & Finance, 106, 341-356.
Korea Fair Trade Commission (KFTC), 2009, Annual report Korea Fair Trade Commission (KFTC), 2010, Annual report
La Porta, R., Lopez-de-Silanes, F., Shleifer, A., and R. W. Vishny, 1998, Law and finance,
Journal of Political Economy, 106(6), 1113-1155.
Lee, K., Kim, J. Y., and O. Lee, 2010, Long-term evolution of the firm value and behavior of business groups: Korean chaebols between weak premium, strong discount, and strong premium, Journal of the Japanese and International Economies, 24(3), 412-440.
Leff, N. H., 1978, Industrial organization and entrepreneurship in the developing countries: The economic groups, Economic Development and Cultural Change, 26(4), 661-675.
Lim, J., 2006, Icahn Wins Once at KT&G, Wall Street Journal, February 15.
Lim, J., 2007, South Korea corporate crusader seeks to shake up chaebol, AFP, May 13. MSCI, 2019, MSCI Fundamental Data Methodology, April 2019.
Noble, J., 2010, Upgrade might end mystery of discount to Asian peers, Financial Times, November 10.
OECD, 2010, Economic Surveys: Korea 2010, Paris: OECD Publications. OECD, 2018, Economic Surveys: Korea 2018, Paris: OECD Publications.
22
Ou, J. A., and S. H. Penman, 1989, Accounting measurement, price-earnings ratio, and the information content of security prices, Journal of Accounting Research, 27, 111-144.
Palepu, K., Healey, P., and E. Peek, 2016, Business Analysis and Valuation, Fourth Edition, Andover: Cengage Learning.
Penman, S. H., 1996, The articulation of price-earnings ratios and market-to-book ratios and the evaluation of growth, Journal of Accounting Research, 34(2), 235-259.
Powers, C., 2010, The changing role of chaebol, Stanford Journal of East Asian Affairs, 10(3), 105-116.
Santioni, R., Schiantarelli, F., and P. E. Strahan, 2019 (forthcoming), Internal Capital Markets in Times of Crisis: The Benefit of Group Affiliation, Review of Finance.
Song, J., 2006, Korea sees rise of domestic activists A Dollars 200m equity fund aims to create value in midsized companies by improving governance, Financial Times, March 6.
Song, J., 2012, Torchbearer for better corporate governance, Financial Times, July 1. The Economist, 2012, The Korea discount: Minority report, The Economist, February 11. The Wall Street Journal (WSJ), 2007, Hyundai Motor has a new shine as labor, currency risks recede, The Wall Street Journal, September 13th.
Welch, I., 2009, Corporate Finance: An Introduction, New York: Prentice Hall.
Woods, C., 2013, Classifying South Korea as a developed market, FTSE White Paper Report. World Bank (WB), Doing business, various issues.
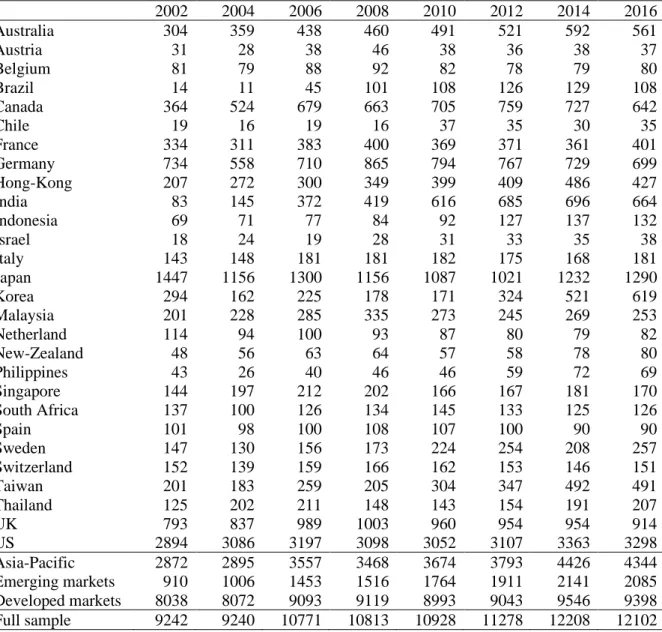
23 Table 1 Sample description
Table 1 provides the number of firm-year observations per country and geographical areas for even-numbered years. Emerging markets include Brazil, Chile, India, Indonesia, Israel (until 2009), South Africa, South Korea, Taiwan, Thailand, and Philippines. All other countries (including Israel since 2010) are classified as developed markets. Classification is based on MSCI. Korea is excluded from the emerging market and developed market portfolios to avoid overlap issues. Asia-Pacific countries include Australia, Hong-Kong, India, Indonesia, Japan, Malaysia, Philippines, Singapore, South Korea, Taiwan, and Thailand. Korea is excluded from the Asia-Pacific portfolio to avoid overlap issue. The full sample consists in 162,495 firm-year observations (25,863 unique firms).
2002 2004 2006 2008 2010 2012 2014 2016 Australia 304 359 438 460 491 521 592 561 Austria 31 28 38 46 38 36 38 37 Belgium 81 79 88 92 82 78 79 80 Brazil 14 11 45 101 108 126 129 108 Canada 364 524 679 663 705 759 727 642 Chile 19 16 19 16 37 35 30 35 France 334 311 383 400 369 371 361 401 Germany 734 558 710 865 794 767 729 699 Hong-Kong 207 272 300 349 399 409 486 427 India 83 145 372 419 616 685 696 664 Indonesia 69 71 77 84 92 127 137 132 Israel 18 24 19 28 31 33 35 38 Italy 143 148 181 181 182 175 168 181 Japan 1447 1156 1300 1156 1087 1021 1232 1290 Korea 294 162 225 178 171 324 521 619 Malaysia 201 228 285 335 273 245 269 253 Netherland 114 94 100 93 87 80 79 82 New-Zealand 48 56 63 64 57 58 78 80 Philippines 43 26 40 46 46 59 72 69 Singapore 144 197 212 202 166 167 181 170 South Africa 137 100 126 134 145 133 125 126 Spain 101 98 100 108 107 100 90 90 Sweden 147 130 156 173 224 254 208 257 Switzerland 152 139 159 166 162 153 146 151 Taiwan 201 183 259 205 304 347 492 491 Thailand 125 202 211 148 143 154 191 207 UK 793 837 989 1003 960 954 954 914 US 2894 3086 3197 3098 3052 3107 3363 3298 Asia-Pacific 2872 2895 3557 3468 3674 3793 4426 4344 Emerging markets 910 1006 1453 1516 1764 1911 2141 2085 Developed markets 8038 8072 9093 9119 8993 9043 9546 9398 Full sample 9242 9240 10771 10813 10928 11278 12208 12102
24 Table 2
Price-earnings ratios of market portfolios
Table 2 presents mean forward (Panel A) and trailing (Panel B) price-earnings ratios for the full sample length and three sub-periods. Emerging markets include Brazil, Chile, India, Indonesia, Israel (until 2009), South Africa, South Korea, Taiwan, Thailand, and Philippines. All other countries (including Israel since 2010) are classified as developed markets. Classification is based on MSCI. Korea is excluded from the emerging market and developed market portfolios to avoid overlap issue. Asia-Pacific countries include Australia, Hong-Kong, India, Indonesia, Japan, Malaysia, Philippines, Singapore, South Korea, Taiwan, and Thailand. Korea is excluded from the Asia-Pacific portfolio to avoid overlap issue. The full sample consists in 162,495 firm-year observations (25,863 unique firms).
2002-16 2002-06 2007-09 2010-16
Panel A: Forward price-earnings
Full sample 12.81 12.79 11.63 13.34
Korea 9.38 8.22 10.61 9.69
Developed markets 12.82 12.80 11.62 13.34
Emerging markets 11.97 10.74 11.90 12.88
Asia-Pacific 13.21 15.19 11.97 12.32
Panel B: Trailing price-earnings
Full sample 14.50 14.31 13.65 14.99
Korea 11.30 10.00 13.17 11.44
Developed markets 14.50 14.32 13.65 14.99
Emerging markets 13.96 12.50 13.97 14.99
25 Table 3
Estimation of the Korea discount for industry portfolios (forward EP)
Table 3 presents the results of the estimation of the Korea discount using industry portfolio approach based on equation (1). Dependent variables are 12 months forward price-earnings ratio. In Panel A, regressions are run on the full sample length (2002-2016) on different geographical benchmark. In column (1), all countries are included. Columns (2), (3), and (4) show results when only emerging markets, developed markets and Asia-Pacific countries are used as benchmark. Emerging markets include Brazil, Chile, India, Indonesia, Israel (until 2009), South Africa, South Korea, Taiwan, Thailand, and Philippines. All other countries (including Israel since 2010) are classified as developed markets. Classification is based on MSCI. Korea is excluded from the emerging market and developed market portfolios to avoid overlap issue. Asia-Pacific countries include Australia, Hong-Kong, India, Indonesia, Japan, Malaysia, Philippines, Singapore, South Korea, Taiwan, and Thailand. Korea is excluded from the Asia-Pacific portfolio to avoid overlap issue. In Panel B, the sample is divided in sub-periods corresponding to pre-crisis (column (2)), crisis (column (3)), and post-crisis (column (4)) periods. Industry-country portfolio PE are winsorized at 1 and 99 percent level. All regressions include industry (ICB industry-level) and year fixed effect. Robust standard errors are clustered at country-level and showed in parentheses. p-value *<5% **<1% ***<0.1%
(1) (2) (3) (4)
Panel A: Forward price-earnings by by geographical benchmark
Full sample Emerging markets Developed markets Asia-Pacific Constant 13.68*** 9.76*** 15.42*** 12.44*** (0.842) (1.329) (0.706) (1.390) Korea -4.23*** -3.49*** -4.59*** -3.93*** (0.288) (0.483) (0.325) (0.407) Observations 4412 1600 2971 1915 Adjusted R-squared 0.185 0.266 0.210 0.249
Panel B: Forward price-earnings by sub-periods
2002-16 2002-06 2007-09 2010-16 Constant 13.68*** 15.09*** 15.28*** 14.69*** (0.842) (1.040) (0.741) (0.682) Korea -4.23*** -6.08*** -2.80*** -3.51*** (0.288) (0.516) (0.344) (0.265) Observations 4412 1427 885 2100 Adjusted R-squared 0.185 0.168 0.190 0.208
26 Table 4
Estimation of the Korea discount for individual stocks (forward EP)
Table 4 presents the results for the individual stocks approach corresponding to equation (2). Dependent variables are 12 months forward earnings-to-price ratio. In Panel A, regressions are run on the full sample length (2002-2016) sorted by geographical area. Emerging markets include Brazil, Chile, India, Indonesia, Israel (until 2009), South Africa, South Korea, Taiwan, Thailand, and Philippines. All other countries (including Israel since 2010) are classified as developed markets. Classification is based on MSCI. Korea is excluded from the emerging market and developed market portfolios to avoid overlap issue. Asia-Pacific countries include Australia, Hong-Kong, India, Indonesia, Japan, Malaysia, Philippines, Singapore, South Korea, Taiwan, and Thailand. Korea is excluded from the Asia-Pacific portfolio to avoid overlap issue. In Panel B, the sample is divided in sub-periods corresponding to pre-crisis (column (2)), crisis (column (3)), and post-crisis (column (4)) periods. Size effect is controlled by a set of dummy variables for domestic market capitalization deciles. All regressions include industry (ICB sector-level) and year fixed effect. Robust standard errors are clustered at firm-level and showed in parentheses. p-value *<5% **<1% ***<0.1%
(1) (2) (3) (4)
Panel A: Forward earnings-to-price by geographical benchmark
Full sample Emerging markets Developed markets Asia-Pacific Constant 0.008 0.208*** -0.014 0.177*** (0.021) (0.057) (0.021) (0.049) Korea 0.066*** 0.028*** 0.074*** 0.043*** (0.005) (0.006) (0.005) (0.006) Observations 162495 28346 138773 58978 Adjusted R-squared 0.004 0.001 0.007 0.003
Panel B: Forward earnings-to-price by sub-periods
2002-16 2002-06 2007-09 2010-16 Constant 0.008 0.020 0.036 0.014 (0.021) (0.024) (0.024) (0.033) Korea 0.066*** 0.095*** 0.051*** 0.058*** (0.005) (0.008) (0.007) (0.007) Observations 162495 48088 32879 81528 Adjusted R-squared 0.004 0.008 0.008 0.004
27 Table 5
Estimation of the Korea discount with country factors (forward EP)
Table 5 provides the results of the estimation of the Korea discount (based on forward earnings ratio) including control for country-level corporate governance and financial development. To have comparable sample, we delete observations with missing data. The final sample covers period 2006-2015 and excludes Taiwan and Sweden. Column (1) provide results without corporate governance and financial development for comparison purpose. Column (2) shows results for models including control for legal origin. Columns (3) and (4) show results for model including control for minority investor protection proxies provided by World Bank and World Economic Forum. The minority investor protection score provided by the World Bank is part of the Doing business report and ranges from 0 to 100. The protection of minority shareholder is part of the 1st pillar
(institution) of the Global Competitiveness Report published by the WEF and ranges between 1 and 7 (best). Column (5) shows results for models including the market capitalization of domestic firms as percentage of the GDP (provided by WB). Column (6) shows results for models including financial market development score provided by WEF. The financial market development is the 8th pillar of the Global Competitiveness Score and ranges between 1 and 10. In Panel A, Korea discount is
estimated by industry portfolio approach. The dependent variable is forward price-earnings ratio Industry-country portfolio PE are winsorized at 1 and 99 percent level. All regressions include industry (ICB industry-level) and year fixed effect. Robust standard errors are clustered at country-level. In Panel B, the Korea discount is estimated by individual stocks approach. The dependent variable is forward earnings-to-price ratio. Size effect is controlled by a set of dummy variables for domestic market capitalization deciles. All regressions include industry (ICB sector-level) and year fixed effect. Robust standard errors are clustered at firm-level and showed in parentheses. p-value *<5% **<1% ***<0.1%
(1) (2) (3) (4) (5) (6) Without Legal origin Inv. protection (WB) Inv. protection (WEF)
Market size Financial market dev.
(WEF) Panel A : Industry portfolio approach
Constant 16.123*** 16.155*** 15.974*** 16.750*** 16.292*** 15.572*** (0.797) (0.919) (1.089) (2.406) (0.806) (2.202) Korea -3.300*** -3.516*** -3.292*** -3.417*** -3.357*** -3.216*** (0.264) (0.352) (0.244) (0.390) (0.262) (0.299) German 0.183 (0.629) French -0.186 (0.595) Investor protection 0.002 -0.117 (0.015) (0.439) Market size -0.001* (0.000) Financial market development 0.105 (0.374) Observations 2613 2613 2613 2613 2613 2613 Adjusted R-squared 0.208 0.208 0.208 0.208 0.209 0.208
28 Table 5 (ctd)
Panel B : Individual stock approach
Constant 0.024 0.023 0.042 -0.044 0.014 -0.042 (0.027) (0.027) (0.024) (0.078) (0.025) (0.057) Korea 0.059*** 0.053*** 0.058*** 0.073*** 0.064*** 0.071*** (0.007) (0.007) (0.007) (0.016) (0.007) (0.012) German 0.007 (0.004) French -0.005 (0.014) Investor protection -0.000 0.012 (0.000) (0.012) Market size 0.000*** (0.000) Financial market development 0.012 (0.009) Observations 99656 99656 99656 99656 99656 99656 Adjusted R-squared 0.004 0.004 0.004 0.004 0.004 0.004