*Corresponding author: Michaela Zauner, Institute for Building Materials, Department of Civil, Environmental and Geomatic Engineering, ETH Zurich, 8093 Zurich, Switzerland, Phone: +41-44-632-5231, Fax: +41-44-632-1174, e-mail: [email protected]
Marco Stampanoni: Institute for Biomedical Technique, Department of Information Technology and Electrical Engineering, ETH Zurich, 8092 Zurich, Switzerland
Peter Niemz: Institute for Building Materials, Department of Civil, Environmental and Geomatic Engineering, ETH Zurich, 8093 Zurich, Switzerland
Michaela Zauner*, Marco Stampanoni and Peter Niemz
Failure and failure mechanisms of wood
during longitudinal compression monitored
by synchrotron micro-computed tomography
Abstract: The lasting plastic deformation of the cellular
elements of beech, fir, and spruce wood under uniaxial compression has been investigated by the combination of
in situ loading and synchrotron micro-computed
tomog-raphy. The deformation of singular elements embedded in the tissue and their influence on the deformation lines and surrounding tissue was examined by tomographic reconstructions. An automatic observation of the failure area was applied in the case of the softwoods, which per-mitted the determination of the densification degree. The development of failure lines differed from the expected pattern by often showing branching. However, the 3D observations confirmed the effects known from 2D exami-nations in many cases.
Keywords: compression, European beech, in situ loading,
Norway spruce, silver fir, synchrotron radiation micro-computed tomography (SRμCT)
DOI 10.1515/hf-2014-0225
Received August 12, 2014; accepted March 5, 2015; previously pub-lished online June 10, 2015
Introduction
The deformation of wood with its complex microstruc-ture depends on the properties of its elements. In soft-woods, the tube-shaped tracheids transport water and mechanically support the structure in the longitudinal (L)
direction. In hardwoods, vessels with large lumens trans-port water, whereas the thick-walled fibers are the main mechanically stabilizing elements. The kind and amount of the cells and their density lead to differences in the behavior during mechanical load.
Figure 1 illustrates the lasting deformation of cellu-lar elements during L compression (Kucera and Bariska 1982; Cote and Hanna 1983; Reiterer and Stanzl-Tschegg 2001). In the case of thicker-walled elements, the trans-lation of the upper end against the lower end of the structural element leads to buckling (a; Cote and Hanna 1983). However, in the case of thin-walled elements, the upper and lower ends remain aligned in the L direction and the cell wall bulges. Kucera and Bariska (1982) coined the term “telescopic shortening” for this mechanism (b). Other mechanisms may also be observed due to the con-strictions and connections of the cells in the surrounding tissue. Additionally, the delamination of the cells (c) can also occur (Mattheck and Kubler 1995). Overall, failure lines are relatively constant for compression in the fiber direction with an angle of 45°–60° to the L axis (Kucera and Bariska 1982; Cote and Hanna 1983).
To observe failure mechanisms, a variety of nonde-structive imaging methods are available (Butterfield and Meylan 1980), such as electron microscopy (EM; Tabarsa and Chui 2000; Sippola and Fruhmann 2002; Fruhmann et al. 2003; Muller et al. 2003; Vasic and Stanzi-Tschegg 2006), light microscopy (LM; Futo 1969; Farruggia and Perre 2000; Dill-Langer et al. 2002), and X-ray micro-com-puted tomography (X-ray μCT). Both EM and LM necessi-tate cutting the sample or isolating elements (Eder et al. 2008) due to the low in-depth resolution in the opaque wooden material; thus, the possibilities are limited for the monitoring of the development and evolution of damage mechanisms. This does not apply to X-ray μCT or synchro-tron μCT (SRμCT), where the complete 3D sample can be recorded with high quality. X-ray μCT has a higher avail-ability and has been used for measuring shrinkage in situ (Taylor et al. 2013), vascular system (Peng et al. 2014), and wax filling (Scholz et al. 2010). SRμCT as an expen-sive research instrument has a lower availability, but it provides higher recording speeds and higher quality.
Despite the limited access to this instrument, SRμCT has been applied multiple times for the tracing of the vessel network (Hass et al. 2010) or the determination of fiber-board density (Walther and Thoemen 2009).
All methods have to be combined with in situ loading to observe the origin and development of lasting visible plastic deformations, which was also done in the case of SRμCT for mechanical loading tests (Forsberg et al. 2008; Zauner et al. 2012) and for the observation of the effects of water sorption and desorption (Derome et al. 2011; Patera et al. 2013; Rafsanjani et al. 2013).
The aim of the present study was the in situ observation of the compression behavior of European beech (Fagus
syl-vatica L.), white fir (Abies alba Mill.), and Norway spruce
(Picea abies [L.] Karst) wood in the L direction by means of SRμCT. The expectation was that the resulting 3D images may lead to new qualitative and quantitative information concerning the single elements of wood embedded in the surrounding tissue.
Materials and methods
The samples with a rotationally symmetric hyperboloid shape were made from adult wood without knots or failures (Zauner et al. 2012). As previously described, the method causes small deformations of the first two to four cell walls on the surface, but the cells are not damaged inside. The specimens were produced from white fir (Abies
alba Mill.), Norway spruce (Picea abies [L.] Karst.), and European
beech (Fagus sylvatica L.). The anatomical differences between fir and spruce are small; spruce may develop nontraumatic resin canals and has heterocellular wood rays with tracheids as bordering ele-ments. A steel negative was used for the production of the hyperbo-loid samples with a height of 8 mm, a circular cavity of 3 mm radius, and a resulting smallest diameter of 1.35 mm. Three fir, three spruce, and four beech samples were loaded and recorded until failure. A modified version of the setup introduced by Zauner et al. (2012) was used, which allows the measurement of forces and an automatized control of loading and tomographic imaging. The loading procedure was as follows: preload is applied to fix the sample and enable a Figure 1: Deformation mechanism during compressive load: (a) buckling, (b) telescopic shortening, and (c) delamination.
tomography of good quality. After the initial tomography, the sample is loaded through moving the crossbeam. After waiting a predeter-mined time (which increased with the load and was up to 5 min for higher loads) to lessen displacements due to movement, the tomog-raphy of the changed state was acquired. This was repeated at least until the compressive strength was reached. The loading velocity was 0.1 mm s-1, with a preload of 5 N. The climatic conditions in the
beam-line chamber were 23°C and 63% relative humidity, and the samples were at equilibrium moisture content.
The SRμCT device was used at the Tomographic Microscopy and Coherent Radiology Experiments (TOMCAT) beamline [located at Paul Scherrer Institute (PSI), Villigen, Switzerland; Stampanoni et al. 2006]. Previous experiments at this beamline without loading were described by Trtik et al. (2007) and Mannes et al. (2010). Beam energy: 10 keV; two magnifications with the 4 × objective having a digital resolution of 1.85 × 1.85 μm2 and the 10 × objective having a
dig-ital resolution of 0.75 × 0.75 μm2. The effective lateral resolution was in
the first case 4 μm, with a resolution of 30 line pairs per millimeter (lp mm-1), determined through modulated transfer function (MTF) in
the original image. The corresponding data for the 10 × objective are 2.3 μm with 60 lp mm-1 (MTF). To obtain the tomographic data, 2001
projections were recorded over 180°, with 50 dark-field and 200 flat images. The exposure time for the 4 × objective amounted to 130 and 190 ms for the 10 × objective.
After the reconstruction of the 3D tomographic data with the algorithms provided onsite (Marone and Stampanoni 2012), the infor-mation was filtered and cleaned. First, the projections were rotated to fit the wood-based coordinate system, and noise in the image with 4 × magnification was removed with a simple threshold. A Markov random field and Gibbs energy approach (measuring the probability of possible configurations) was applied to the images recorded with the 10 × objective, taking the connection of pixels to the neighbor-hood into account. An iterative (conditional) mode based on that of Besag (1986) and Demirkaya et al. (2009) was better than the simple threshold method (Otsu 1979). A universal outcome for all methods was the identification of the connected regions and the elimination of unconnected noise patterns.
To count pixels representing material and to obtain the area of the sample, repeated morphological operations (e.g., dilate) were executed and the resulting largest region of the material was selected. This allowed an automated identification of the sample. All material pixels were then counted and displayed in relation to the area as “pixel-density.”
Results and discussion
All samples were at least loaded until the compressive strength was reached and one or two tomographies were recorded thereafter. The stress-strain curves of three exemplary samples are presented in Figure 2, whereas the matching physical properties and compressive strengths are listed in Table 1. Beech 1 and fir 2 were recorded with the 4 × objective, whereas the other samples were tested with the 10 × objective. The smaller field of view for the 10 × objective resulted in a small portion of the sample surface not being recorded. Expectedly, the observed structure
Failure area
To display the change of the material during increasing load, the amount of pixels identified as cell wall sub-stance and the area of the cross-section were calculated for every slice. Figure 4a demonstrates this for beech 1-RT slices. A shortening and upward movement of the visible part of the sample is seen, whereas a compression cannot be directly observed. For softwoods, a compression is visible in the curve modification (Figure 4b). This is espe-cially true for the pixel density. Therefore, an automatic identification of the approximate height of the compres-sive failure line is possible for softwoods but not for beech. In Figure 4c and d, the amount of pixels represent-ing material is shown for the RT, LT, and LR plane. LT and LR were calculated around the failure line. Due to the smoothing of the curves and inconsistencies through cleaning process, the values at the beginning and end of the curve are not taken into account. For beech, a change in the LT plane is obvious. The sample is translated and a part of the curve evened out. For the softwood sample, the growth ring is visible. Overall, the differences in the LR slices are found, and for softwood, the slipping of the sample is visible.
Further, a combination of image processing methods can be used to find a failure line. If the vessels or trac-heids are heavily deformed, the lumen is minimized in and density influences the strength. An example for this
is that the strength of fir 1 surpassed that of the beech samples because of the large percentage of latewood (LW) to transition wood. Contrary to beech 4, the stress-strain curve of spruce 2 shows a significant change of the slope between the fourth step and the fifth step.
To be able to compare the porosity of the samples, the area of more than 1000 lumen slices was deter-mined for every specimen listed in Table 1 (Figure 3). The vessels have a large mean area (1600 μm2 for beech 1
and 1500 μm2 for beech 4) compared to the tracheids in
fir 2 and spruce 1 with 530 and 440 μm2, respectively. As
expected, fir 1 mainly built from LW has the lowest mean area with 255 μm2. 0 20 40 60 80 100 Stress (N/mm 2) Beech 4 0 2 4 6 8 10 12 Strain (%) Spruce 2 Fir 1 0 2 4 6 8 10 12 Strain (%) 0 2 4 6 8 10 12 Strain (%)
Figure 2: Stress-strain curves of beech 4, spruce 2, and fir 1. Table 1: Mass, smallest cross-section, and compressive strength of the five samples in Figure 2.
Property
1 Beech 4 Spruce 2 1 Fir2 Density (kg m-3) 780 846 462 682 538 Area (mm2) 1.94 1.86 1.71 1.62 1.93 Compressive strength (N mm-2) 67.7 87.6 33.2 96.4 43.2 0 200 600 1000 1400 0 0.2 0.4 0.6 0.8 1 Beech 1 Beech 2 Spruce 1 Fir 1 Fir 2 Cumulative ratio Area (µm2)
Figure 3: Cumulative percentage of distribution of lumen size for vessels in beech and tracheids in softwood.
Initial Step 1 Step 2 Step 3 Step 4 Step 5 Step 6 Step 7 Step 8 0.2 0.4 0.6 0.8 0 500 1500 0 500 1500
Slice 0 500 1500Slice Slice 0.2 0.4 0.6 0.8 1 RT RT LT LT LR LR 500 1500 0 500 1500 0 500 1500 Pixel-density 0 4 8 12 Pixelcount 0 4 8
Slice Slice Slice
0.2 0.4 0.6 0.8 0.2 0.4 0.6 0.8 0.2 0.4 0.6 0.2 0 4 8 12 0 4 8 Area (m m 2) Area (m m 2) ×105 ×105 Pixelcount Pixel-density 0.4 0.6 0.8 a Beech 1 b Fir 2 c Beech 4 d Spruce 2
Figure 4: Area, pixel count, and pixel density (pixel count per area) of beech 1-RT slices and fir 2-RT slices; pixel-density of beech 4 and spruce 2 for sections of the sample in the RT (left row), LT (middle), and LR (right) planes.
the deformed region. This can be identified through image processing. The disadvantages of this method are that only the part below or above the failure line is identified. Additionally, due to faulty image cleaning tracheids may be closed prematurely and may therefore interrupt the failure line. This procedure was applied to all tomogra-phies of fir 2 and beech 1, resulting in Figure 5. A main
a Fir 2 b Beech 1 (1) (2) (3) (4) (5) (6) (7) (8) (9) L R T L R T (1) (2) (3) (4) c Spruce 3
Figure 5: Identification of failure lines through the isolation of the tissue surrounding the vessels or tracheids running from top to bottom for fir 2 (a) and beech 1 (b).
1, initial tomography; 2–9, tomographies after the first to eighth loading steps, with increasing compressive load. (c) Deformation during compression in an LT slice of a softwood sample (spruce 3) with a resin canal and growth ring.
L T (1) (5) (6) a Beech 4 b Fir 2 L T L R e Spruce 1 d Fir 3 (1) (2) (3) (4) L T L R c Beech 2
Figure 6: (a and b) Deformation due to compression and the pos-sible origin shown for the last tomography (top) without vipos-sible deformation and the first one (bottom) showing deformation (beech 4 and fir 2). (c) Deformation of beech 2. (1) is the initial tomography, the following the tomographies after the fourth and fifth loading steps. (d and e) Examples of the deformation of singular wood rays in softwoods: fir 3 LW and spruce 1 EW. (1) Initial tomography, (2) last tomography before visible deformation, (3) first deformation, and (4) subsequent tomography.
influencing factor in the vessel deformation is the behavior of the thick-walled fibers. Those fibers buckle and deform the vessel structure. Due to the large lumen, the vessels of the hardwood sample stay open for a long time despite deformation. The failure starts to develop relatively late, between the 7th picture and the 8th picture. Overall, the
failure area has an inclination of about 20°–40° in the T direction and no inclination in the R direction. In con-trast, no consistent inclination can be identified in soft-wood. Rather, a slightly stepwise orientation of the failure is visible starting with Figure 5a.
Longitudinally oriented structures and
failure origin
The behavior of cells depicted in Figure 1 is shown in Figure 6b for fir 2, where multiple failure lines develop. Dif-ferences between LW (left side) and earlywood (EW; right side) are found. The failure areas are clearly connected to
not influenced. Wood ray cells buckle and are com-pressed, which indicates that this element does not have a strengthening effect in the L direction. After increasing the load, already deformed cells are further compressed and dislocated. If the failure line crosses the wood ray in the center, the upper and lower parts translate against each other and only adjacent cells are deformed (Figure 6d and e, 4). Only the L-oriented walls buckle. The behav-ior of wood rays in beech is similar (see Figure 6b). In both LW in softwoods and beech, a uniform failure line with an angle of 20°–40° of LW is found.
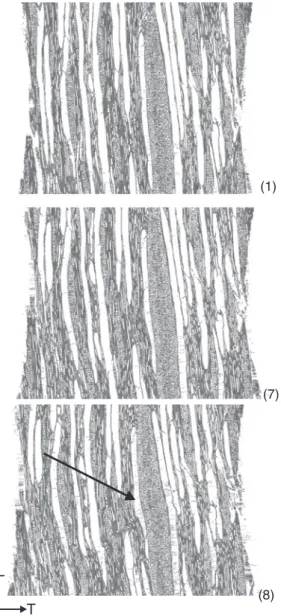
Broad rays seem to significantly dampen the failure lines. This is illustrated through Figure 7. In the time between Figure 7 (7 and 8), the tissue buckles and the the surface and originate in regions with cut tracheids (e.g.,
on the right side). The number and magnitude of deforma-tion of failure lines decrease from the surface to the center of the sample. Similarly, the failure area in beech (left side) is connected to the surface. Due to reconstruction inaccu-racies, artifacts are found especially close to the surfaces. The indicated vessel, a thin-walled element, is forced into buckling by the thick-walled fibers surrounding it.
The circles in Figure 5c indicate where EW tracheids are deformed by the connected LW tracheids. The resin canals behave as thin-walled elements (they are built by epithelial cells). The first singular failure line develops in the EW zone (c2) and does not cross the resin canal. During the next loading step, a second failure line, likely con-nected to the growth-ring border, develops and spans over the resin canal (the upper circle) into the LW region. The resin canal is deformed similar to telescopic shortening. The initial failure line does not develop further, whereas the second failure line further increases in strength, espe-cially surrounding the resin canal. One side of the resin canal shows a stronger deformation probably due to the lower resistance of the thinner cell walls in that region.
Another detail is also illustrated in Figure 5c. The initial failure area connected to the damaged surface is often not the dominating one when the sample reaches the compressive strength. Instead, a secondary failure area develops later on, especially in structures with a non-uniform distribution of cellular material. With increasing deformations, the originally separated failure lines finally fuse, resulting in a stronger deformation of the areas between them.
Figure 6c shows the deformation of vessels in beech. The arrow indicates a vessel that is deformed during increasing load. In the initial tomography, the cell walls between two vessels are wrinkling. Shortly before the fibers buckle (in state 6), the already existing wrinkles increase in magnitude and the cell material between breaks. Further increasing the load leads to a more pro-nounced manifestation of this observation.
Wood rays
Thin wood rays with a thickness of one cell are found in all tested species. The behavior of the rays in softwood is exemplarily shown for EW spruce 1 and LW fir 3 in Figure 6d and e. The original structure is depicted in the initial tomography (1), and the last tomography before visible deformations is illustrated in (2). No visible defor-mations or cracking were found. After further loading, the wood rays are deformed (3), but the failure line is
L T
(1)
(7)
(8)
Figure 7: Deformation of broad wood rays in beech 1: (1) initial tomography, (7) after the sixth loading step, and (8) after the seventh loading step.
broad wood ray is deformed. Only the vessel adjacent to the ray on the opposing side of the original failure line shows slight buckling. Due to the low quality of the tomo-graphic reconstruction of the broad wood rays and there-fore missing information about the cell walls, no detailed interpretation is possible.
Bordered pits found along the tracheids in softwoods are both deformed by crossing failure lines or circum-vented by the failure line. An example is presented in Figure 8. After loading the sample, some pits are deformed where a failure line has crossed them.
Conclusion
In the case of SRμCT of softwoods, the height of the failure area and an estimation of the shape can be determined through an automated approach of material identifica-tion. This results in good estimates, especially for mixed EW and LW structures. Due to the different failure mecha-nisms encountered in beech and LW in the two softwoods, this approach is not optimal for those structures. An approach of displaying the vessel structure or tracheids leads to a better estimate of the failure line.
Often, a secondary failure line develops, whereas the original failure does not further magnify. The failure line for LW in the softwoods and beech is relatively constant with an angle of 20°–40° to the horizontal and does not show deviating tendencies. In contrast, other structures in softwood did not show a continuous failure line. Sin-gular wood rays do not contribute to the strength but are equally deformed with the surrounding tissue. Bordered pits are not exclusively circumvented as was observed in previous tensile load experiments but may be deformed in the failure areas.
Figure 8: Deformation of bordered pits of spruce 2.
Acknowledgments: The main author wants to thank
the staff at the TOMCAT beamline (PSI) for their help-ful support and the technical and mechanical assistance during beam times. Additionally, the main author wants to thank all colleagues who helped with the measure-ments during beamtimes. This work was supported by the European Cooperation in the field of scientific and technical research (COST, Action FP0802).
References
Besag, J. (1986) On the statistical-analysis of dirty pictures. J. R. Stat. Soc. B Methodol. 48:259–302.
Butterfield, B.G., Meylan, B.A. Three-Dimensional Structure of Wood. Chapman and Hall, London, 1980.
Cote, W.A., Hanna, R.B. (1983) Ultrastructural characteristics of wood fracture surfaces. Wood Fiber Sci. 15:135–163.
Demirkaya, O., Hakan Asyali, M., Sahoo, P.K. Image Processing with Matlab. CRC Press, Florida, USA, 2009.
Derome, D., Griffa, M., Koebel, M., Carmeliet, J. (2011) Hysteretic swelling of wood at cellular scale probed by phase-contrast X-ray tomography. J. Struct. Biol. 173:180–190.
Dill-Langer, G., Lutze, S., Aicher, S. (2002) Microfracture in wood monitored by confocal laser scanning microscopy. Wood Sci. Technol. 36:487–499.
Eder, M., Stanzl-Tschegg, S., Burgert, I. (2008) The fracture behav-iour of single wood fibres is governed by geometrical con-straints: in situ ESEM studies on three fibre types. Wood Sci. Technol. 42:679–689.
Farruggia, F., Perre, P. (2000) Microscopic tensile tests in the trans-verse plane of earlywood and latewood parts of spruce. Wood Sci. Technol. 34:65–82.
Forsberg, F., Mooser, R., Arnold, M., Hack, E., Wyss, P. (2008) 3D micro-scale deformations of wood in bending: synchrotron radiation μCT data analyzed with digital volume correlation. J. Struct. Biol. 164:255–262.
Fruhmann, K., Burgert, I., Stanzl-Tschegg, S.E. (2003) Detection of the fracture path under tensile loads through in situ tests in an ESEM chamber. Holzforschung 57:326–332.
Futo, L.P. (1969) Qualitative and quantitative evaluation of microten-sile strength of wood. Holz Roh Werkst. 27:192.
Hass, P., Wittel, F.K., McDonald, S.A., Marone, F., Stampanoni, M., Herrmann, H.J., Niemz, P. (2010) Pore space analysis of beech wood: the vessel network. Holzforschung 64:639–644. Kucera, L.J., Bariska, M. (1982) On the fracture morphology in wood.
1. A SEM-study of deformations in wood of spruce and aspen upon ultimate axial-compression load. Wood Sci. Technol. 16:241–259.
Mannes, D., Marone, F., Lehmann, E., Stampanoni, M., Niemz, P. (2010) Application areas of synchrotron radiation tomographic microscopy for wood research. Wood Sci. Technol. 44:67–84. Marone, F., Stampanoni, M. (2012) Regridding reconstruction algo-rithm for real-time tomographic imaging. J. Synchrotron Radiat. 19:1029–1037.
Mattheck, C., Kubler, H. Wood – The Internal Optimization of Trees. Springer-Verlag, Germany, 1995.
Muller, U., Gindl, W., Teischinger, A. (2003) Effects of cell anatomy on the plastic and elastic behaviour of different wood species loaded perpendicular to grain. IAWA J. 24:117–128.
Otsu, N. (1979) A threshold selection method from gray-level histo-grams. IEEE Trans. Syst. Man Cyber. 9:62–66.
Patera, A., Derome, D., Griffa, M., Carmeliet, J. (2013) Hysteresis in swelling and in sorption of wood tissue. J. Struct. Biol. 182:226–234.
Peng, G.Y., Jiang, Z.H., Liu, X.E., Fei, B.H., Yang, S.M., Qin, D.C., Ren, H.Q., Yu, Y., Xie, H.L. (2014) Detection of complex vascular system in bamboo node by X-ray μCT imaging technique. Holzforschung 68:223–227.
Rafsanjani, A., Derome, D., Carmeliet, J. (2013) Micromechanics investigation of hygro-elastic behavior of cellular materials with multi-layered cell walls. Compos. Struct. 95:607–611. Reiterer, A., Stanzl-Tschegg, S.E. (2001) Compressive behaviour of
softwood under uniaxial loading at different orientations to the grain. Mech. Mater. 33:705–715.
Scholz, G., Zauer, M., Van den Bulcke, J., Van Loo, D., Pfriem, A., Van Acker, J., Militz, H. (2010) Investigation on wax-impreg-nated wood. Part 2: study of void spaces filled with air by He pycnometry, Hg intrusion porosimetry, and 3D X-ray imaging. Holzforschung 64:587–593.
Sippola, M., Fruhmann, K. (2002) In situ longitudinal tensile tests of pine wood in an environmental scanning electron microscope. Holzforschung 56:669–675.
Stampanoni, M., Groso, A., Isenegger, A., Mikuljan, G., Chen, Q., Meister, D., Lange, M., Betemps, R., Henein, S., Abela, R. (2006) TOMCAT: a beamline for tomographic microscopy
and coherent radiology experiments. In: 9th International Conference on Synchrotron Radiation Instrumentation (SRI 2006). Eds. Choi, J.Y., Rah, S. Daegu, South Korea. Vol. 879. pp. 848–851.
Tabarsa, T., Chui, Y.H. (2000) Stress-strain response of wood under radial compression. Part I. Test method and influences of cel-lular properties. Wood Fiber Sci. 32:144–152.
Taylor, A., Plank, B., Standfest, G., Petutschnigg, A. (2013) Beech wood shrinkage observed at the micro-scale by a time series of X-ray computed tomographs (μXCT). Holzforschung 67:201–205.
Trtik, P., Dual, J., Keunecke, D., Mannes, D., Niemz, P., Stahli, P., Kaestner, A., Groso, A., Stampanoni, M. (2007) 3D imaging of microstructure of spruce wood. J. Struct. Biol. 159:46–55. Vasic, S., Stanzi-Tschegg, S. (2006) Experimental and numerical
investigation of wood fracture mechanisms at different humid-ity levels. In: 7th World Congress on Computational Mechanics. Los Angeles, CA. Vol. 61. pp. 367–374.
Walther, T., Thoemen, H. (2009) Synchrotron X-ray microtomography and 3D image analysis of medium density fiberboard (MDF). Holzforschung 63:581–587.
Zauner, M., Keunecke, D., Mokso, R., Stampanoni, M., Niemz, P. (2012) Synchrotron-based tomographic microscopy (SbTM) of wood: development of a testing device and observation of plastic deformation of uniaxially compressed Norway spruce samples. Holzforschung 66:973–979.
Zink, A.G., Pellicane, P.J., Shuler, C.E. (1994) Ultrastructural analysis of softwood fracture surfaces. Wood Sci. Technol. 28:329–338.