SCIENTIFIC ARTICLE
Asymmetry of the multifidus muscle in lumbar radicular
nerve compression
Mazda Farshad&Christian Gerber&
Nadja A. Farshad-Amacker&Tobias J. Dietrich&
Viviane Laufer-Molnar&Kan Min
Received: 4 July 2013 / Revised: 14 September 2013 / Accepted: 22 September 2013 / Published online: 30 October 2013 # ISS 2013
Abstract
Objective The multifidus muscle is the only paraspinal lumbar muscle that is innervated by a single nerve root. This study aimes to evaluate if the asymmetry of the multifidus muscle is related to the severity of compression of the nerve root or the duration of radiculopathy.
Methods MRI scans of 79 patients with symptomatic single level, unilateral, lumbar radiculopathy were reviewed for this retrospective case series with a nested case–control study. The cross-sectional area (CSA) of the multifidus muscle and the perpendicular distance of the multifidus to the lamina (MLD) were measured bilaterally by two radiologists and set into relation to the severity of nerve compression, duration of radiculopathy and probability of an indication for surgical decompression.
Results In 67 recessal and 12 foraminal symptomatic nerve root compressions, neither the MLD ratio (severe 1.19±0.55 vs less severe nerve compression: 1.12±0.30, p =0.664) nor the CSA ratio (severe 1±0.16 vs less severe 0.98±0.13, p =0.577) nor the duration of symptoms significantly correlated with the degree of nerve compression. MR measurements of multifidus were not different in patients with (n =20) and those without (n =59) clinical muscle weakness in the extremity caused by nerve root compression. A MLD >1.5 was, however, associated with the probability of an indication for surgical decompression (OR 3, specificity 92 %, PPV 73 %). Conclusions Asymmetry of the multifidus muscle correlates with neither the severity nor the duration of nerve root compression in the lumbar spine. Severe asymmetry with substantial multifidus atrophy seems associated with the probability of an indication of surgical decompression.
Keywords Multifidus muscle . Radicular compression . MRI . Asymmetry
Introduction
The multifidus muscle is a paraspinal, lumbar muscle that is innervated by a single nerve root [1] in contrast to the polysegmental innervations of the adjacent muscles. The asymmetric and atrophic appearance of the multifidus muscle has been associated with lower back pain and debatably with radiculopathy. However, the current evidence on latter is not concordant and the mechanisms are not understood. Changes in the paraspinal muscles have been identified to be associated with nerve root compression [2] with unilateral lumbosacral radiculopathy and lumbosacral disc herniation. It has been postulated that denervation of the multifidus muscle could cause asymmetry as a result of atrophy at the site of nerve compression [2]. This observation is in agreement with histological investigations, which show that disc protrusion is associated with a decrease in both type I and II muscle fibre diameters of the multifidus muscle [3,4]. A study involving 78 semiquantitative MRIs of patients with low back pain who either had or did not have additional leg pain, however, found no relationship between muscle atrophy and radicular compression [5]. In another recent study involving 100 patients with back pain, or unilateral or bilateral radiculopathy, a significant multifidus atrophy was observed in those with radiculopathy versus those without, but no differences between bilateral and unilateral radiculopathies were documented. Others found multifidus asymmetry on MRI not to be a reliable marker of unilateral symptoms of radiculopathy and concordant posterolateral disc herniation in patients with acute symptoms. Therefore, although anatomically plausible, the current evidence is not conclusive to suggest that nerve compression leads to atrophy of the
M. Farshad (*)
:
C. Gerber:
N. A. Farshad-Amacker:
T. J. Dietrich
:
V. Laufer-Molnar:
K. MinBalgrist University Hospital, University of Zürich, Forchstrasse 340, 8008 Zürich, Switzerland
multifidus muscle at the respective levels. In daily clinical use, asymmetry of the multifidus is observed, but not yet understood and often neglected because of the complexity of the suggested measurement methods for the atrophy of the multifidus muscle using cross-sectional area (CSA) or even CSA ratios [2] rather than a simple and clinically applicable tool for the assessment of muscle atrophy. It was therefore the goal of this study to establish a simple, reliable method of measuring multifidus asymmetry on MRI scans and to determine whether multifidus asymmetry is related to nerve compression at the respective levels and if so, whether it is related to the severity of compression or the duration of symptoms attributed to nerve root compression. Further, we attempted to determine whether the probability of an indication for surgical nerve root decompression, as an indirect measure of clinical relevance, would be reflected in the amount of multifidus atrophy.
Materials and methods
The clinical database was screened to find 995 records of patients diagnosed with radiculopathy in the spine clinic during the search period of 2000–2005 following the Declaration of Helsinki principles. Their clinical records were screened to find 95 subjects with unilateral radiculopathy with a radiological record of nerve root compression and no previous spine surgery. Of those, 16 patients were excluded owing to a lack of lumbar MRI performed in our institution, and finally 79 consecutive patients (mean age ± SD: 48± 13 years (range 22–80 years), male:female 53:26) with unilateral single level symptomatic radiculopathy treated either conservatively (n =39) or surgically (n =40) in our Institution were used for further analysis. Patient records served for documentation of the duration of symptoms and presence of muscle weakness (motor deficit) in the extremity. The duration of symptoms up to the MRI was documented for each patient. Patients with chronic symptoms with no exact time of onset of symptoms were categorized into the group of >90 days of symptoms.
Two independent radiologists, blinded to the clinical information, assessed the lumbar MRIs (T2 slice thickness of 4 mm for both the transverse and sagittal MR images) with regard to side, location (recessal vs foraminal) and degree of nerve root compression according to the Pfirrmann classification [6]. There were 67 recessal and 12 foraminal symptomatic nerve compressions at levels L1/L2 (n =1 recessal and n = 1 foraminal), L2/L3 (n =1 foraminal), L3/L4 (n =2 recessal and 4n = foraminal), L4/L5 (n =25 recessal and n = 5 foraminal), L5/S1 (n =39 recessal and n = 1 foraminal). Further, on axial MRI T2-weitghted images, the cross-sectional area (CSA) of the multifidus muscle at the level of nerve compression and the level below were measured on the
side of compression and on the contralateral side (Figs.1,2). The distance between the multifidus muscle and the corresponding lamina (MLD), measured at the middle of the lamina on a perpendicular line to the lamina (Fig.2), was also measured for each level of compression and each level below the level of compression. If the nerve root compression was in the recess, the measurements at the level below were used and if the nerve root compression was foraminal, the measurements at the same level were used. A ratio was calculated between the affected and contralateral side for both CSA and MLD.
The statistical analysis was performed with use of commercial software (PRISM Version 5 for Mac OSX; Graphpad). If a sufficient interobserver correlation was present (r > 0.6 as by Pearson or Spearman correlation depending on the distribution of data), the mean was calculated, however, only for ratios, but not for total values of MLD and CSA. For comparison of MLD and CSA ratios for different degrees of nerve compression, groups were formed according to the degree of nerve compression and statistical intergroup comparison was made either by two-tailed unpaired Student’s t test or a Mann–Whitney test for normal or not-normally distributed data, respectively. Either an ANOVA or a Kruskal–Wallis test was employed for normally or not-normally distributed data for comparison of groups with different durations of symptoms. Values are reported as mean and standard deviations and ranges where plausible. The significance level was set at p <0.05.
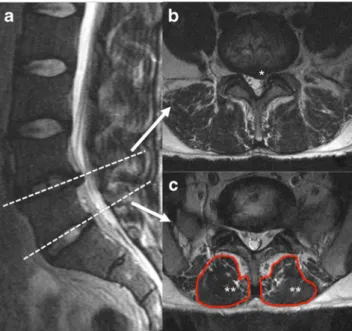
Fig. 1 MRI of the lumbar spine with a recessal disc herniation at L4/L5. a Sagittal T2-weighted image of the lumbar spine shows a disc herniation at the level of L4/L5 (upper dotted line) and a normal disc at the level of L5/S1. b Axial T2-weighted image at the level of L4/L5 shows a recessal disc herniation (asterisk ) deviating the L5 nerve root. c Axial T2-weighted image at L5/S1, below the level of disc herniation shows the multifidus muscles (asterisks) that are innervated by the dorsal branch of the fifth nerve roots
Results
Degree of nerve compression and results of MRI
Nerve compression was rated according to Pfirrmann [6] and the mean value of the two reads showed a severity of 1 or 1.5 in 3 cases, 2 or 2.5 in 17 cases and 3 in 59 cases. Pfirrmann grade (mean of two readouts) of more than 2.5 was defined as severe compression. The overall CSA ratio of the multifidus on the pathological nerve side over the contralateral side (Fig.2) was 0.997±0.152 for reader one and 0.994±0.152 for reader two with a moderate interobserver correlation (r =0.612, p <0.001). The CSA ratio was not different in the cases of severe (>2.5) nerve compression (CSA: 1±0.16) if compared with those with less severe nerve compression (CSA: 0.98±0.13; p =0.577).
The interobserver correlation of the MLD (Fig.2) was also moderate (r =0.61, p <0.001). The MLD was higher for both readers on the side of nerve compression (7.2±3.6 mm and 7.0±3.6 mm by readers one and two respectively) compared with the contralateral side (6.6±3.1 mm and 6.5±3.4 mm by readers one and two respectively; p =0.04 and p =0.09). This resulted in a mean MLD ratio of the affected side over the contralateral side of >1 (reader one: 1.19±0.58, reader two: 1.15±0.54). However, a MLD ratio of >1 identified the side of nerve root compression in only 58 % of cases. The mean MLD ratio (average of the two readers) was not significantly different in patients with severe nerve root compression (1.19±0.55) compared with those with less severe nerve root compression (1.12±0.30, p =0.664).
Duration of symptoms and results of MRI
The severity of nerve compression was higher in those patients with a shorter time (≤30 days) from the onset of the symptoms to MR imaging if compared with those with more delayed MRI (≥90 days); however, this difference did not reach statistical significance (Table1). There was no relation between MLD or CSA ratio and duration of symptoms (Table1).
Motor deficit and MRI findings of lumbar spine
Twenty of the 79 patients had presented with a decreased muscle strength (motor deficit: M4 ± 0.48) on clinical examination caused by nerve root compression. Of those, 10 were treated by surgical decompression and 10 were treated conservatively. The MLD ratio in the patients with a motor deficit (n =20) was not significantly different from those without a motor deficit (n =59; motor deficit 1.18±0.55 vs no motor deficit 1.20±0.6 (reader one, p =0.649) and 1.16± 0.58 vs 1.15±0.54 (reader two, p =0.655). No difference was seen with regard to the CSA ratio (motor deficit: 0.98±0.12 vs no motor deficit: 1.00±0.14 [reader one, p =0.584] and 0.98± 0.21 vs 0.99±0.13 [reader two, p =0.568]). No differences were found with regard to severity of nerve compression in patients with a motor deficit (2.88±0.26) versus those without (2.76±0.46; p =0.450).
MRI findings and probability of surgical decompression
The parameters of patients who were treated surgically (n =40, median 12 days; range 0–208 between MRI and surgery) with a nerve root decompression were similar to those of the patients who were treated non-operatively with regard to age (surgery: 48 ± 13 years, conservative: 48 ± 14 years, p =0.996) and duration of symptoms until MRI (surgery: 72±32 days, conservative: 71±32 days, p =0.990). Patients who underwent surgery had a slightly higher degree of severity of nerve compression (surgery: 2.9 ± 0.27, conservative: 2.7±0.5, p =0.100). Overall, neither the mean CSA ratio (surgery: 0.97 ± 0.12, conservative: 1.0 ± 0.12, p = 0.226), nor the MLD ratio (surgery: 1.26 ± 0.77, conservative: 1.15±0.35, p =0.377) was different. However, in the group of patients with a high MLD ratio (>1.5; n =11), significantly more patients were ultimately treated operatively (n =8) than conservatively (n =3) if compared with the group with a lower MLD ratio (surgery [n = 32] vs conservative [n =36]). The odds of undergoing surgical decompression was 3 (95 % CI 0.733 to 12.285) if the MLD ratio was over 1.5 with a high specificity of 92 % and low
Fig. 2 Axial T2-weighted MRI at L5/S1, one level below a left-sided recessal nerve
compression (see also Fig.1). a
The cross-sectional area (CSA) of the multifidus muscle on the compressed nerve side (asterisk) and the contralateral side (asterisks) are outlined. b The perpendicular distances of the multifidus muscles to the laminae (MLD) are outlined
sensitivity of 20 % with a positive predictive value of 73 %. The mean CSA ratio of those with an MLD ratio >1.5 was significantly lower (0.9±0.2) than that of those with a lower MLD ratio (1±0.1; p =0.013), indicating that asymmetry was caused by atrophy (Fig.3). Motor deficit in the extremity was not more common (27 %) in the high MLD ratio group than in the group with a lower MLD ratio (25 %).
Discussion
The purpose of this study was to investigate the effect of nerve compression on the multifidus muscle at the corresponding level of the lumbar spine. A simple method of MR assessment of asymmetry of the multifidus muscle by use of the MLD (Fig. 2) was introduced and measured for each patient in
addition to the established CSA measurements [2]. The hypothesis was that the multifidus might be affected by the duration and severity of nerve root compression and that these muscle changes might indirectly reflect the clinical relevance of nerve root compression, quantified with the probability of a patient undergoing surgical decompression. Although absolute values of MLD were higher on the side of nerve compression if compared with the contralateral side, the MLD ratio was not significantly different in the whole series. Neither the CSA nor the MLD ratio could be associated with the severity or duration of nerve root compression. Interestingly, a slight motor weakness (mean M4) was not related to changes in the multifidus muscle either. In this study, we found that severe multifidus asymmetry was associated with a higher probability of the patient to subsequently undergo surgical decompression. In asymmetry with an MLD ratio of greater than 1.5, the odds were in-creased 3-fold of the patient undergoing operative nerve decompression. Such asymmetry was mainly caused by atrophy since the mean CSA ratio was 10 % lower. However, the lower 95 % CI value of the OR is <1 and therefore the statistical strength of the odds ratio becomes diminished. The decision for treatment of radiculopathy is multifactorial and includes patient and physician subjective factors. It could therefore be debated whether surgical decompression would always directly be related with clinical severity of radiculopathy. Anecdotally, however, patients who undergo surgical decompression do have more severe symptoms. Therefore, although not proven with this study, it seems plausible that severe atrophy of the multifidus could reflect the patho-physiological consequence of the amount of nerve root compression that would also present with pain. Further research is needed to investigate this hypothesis.
While this study included MRIs of 79 patients with symptomatic unilateral single level root compressions to reduce biases of contributing causes such as contralateral or multilevel nerve compressions, the results can only be interpreted with attention to the limitations. First, the measurements of the CSA and the MLD are dependent on the assessment of definitions of boundaries of the multifidus muscle (Fig.2). While the dorsal boundaries of the muscle are well defined, the ventral boundaries are often more difficult to determine. This may be the reason for the only moderately strong inter-reader agreements of the two radiologists and also for the relatively wide deviations of the respective values causing difficulties for statistically significant discriminations. The difficulty of definition of the boundaries of the multifidus is valuable information regarding limitation of daily clinical use of these measurements. Second, the categorization of duration of symptoms with 1 to 30 days, 31–89 days and over 90 days (Table1) was done arbitrarily. Patients with chronic symptoms who could not exactly define the onset of the symptoms were allocated to the group with >90 days of
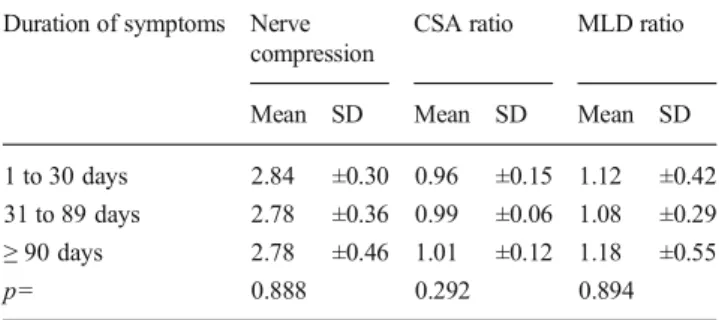
Table 1 Duration of radiculopathic symptoms up to the MRI and amount
of nerve compression according to the Pfirrmann classification [6], CSA
ratio (nerve compression side over contralateral side) and MLD ratio (nerve compression side over contralateral side)
Duration of symptoms Nerve
compression
CSA ratio MLD ratio
Mean SD Mean SD Mean SD
1 to 30 days 2.84 ±0.30 0.96 ±0.15 1.12 ±0.42
31 to 89 days 2.78 ±0.36 0.99 ±0.06 1.08 ±0.29
≥ 90 days 2.78 ±0.46 1.01 ±0.12 1.18 ±0.55
p= 0.888 0.292 0.894
Fig. 3 Axial T2-weighted MRI of the lumbar spine with asymmetry of the multifidus muscle (asterisk: affected side, asterisks: unaffected side) with a high perpendicular distance of the muscle to the lamina on the side of nerve compression (asterisk) resulting in an MLD (arrow) ratio of >1.5 on the affected side (asterisk)
symptoms. This study could therefore not answer whether MRI of patients with symptoms for years would be different from those around 90 days. However, it seems unlikely, since changes of the multifidus muscle are expected to take place rather early [7]. Third, this study focused on the MRI of the patients and did not include a symptom-free control group. We did not include a control group since the focus was on a method of MR assessment that would be able to identify the significance of nerve compression by quantitative measurement of the multifidus muscle. For these measurements, the comparison with the clinically and MRI-unaffected contralateral side is more helpful in our opinion. Other potential factors that have been associated with degeneration of the multifidus muscle, such as advanced age [8], were not considered in the present study because we used the contralateral side of the same individual for comparison.
It was not the main goal to associate MR measurements with clinical or electrophysiological data as done by others [2]. Hyun et al. [2] quantified the total CSA and the purely muscular CSA of the multifidus and built a ratio of their quotient to compare the involved with the uninvolved side. In agreement with our results, overall, no differences were found between the total values of involved and the uninvolved sides, but the ratio of muscle area of the involved to the uninvolved muscle was lower in those patients with radiculopathy compared with the control group [2].
Another limitation of this study is its retrospective nature. Standardized assessment of the severity of pain was not available for the patients treated non-operatively. We were unable to correlate the level of pain with the MRI measurements of the multifidus muscle. As the MLD ratio of more than 1.5 correlated with the probability of surgical decompression, we can only presume that the measurement could correlate with the intensity of radicular pain too. This will be examined in future prospective studies.
In conclusion, neither the severity of compression nor the duration of symptoms correlated with the degree of asymmetry
of the multifidus muscle on the affected side at the respective level. The MLD ratio was not always more than 1 on the side of nerve compression, but a MLD ratio>1.5 was predictive for the indication of surgical nerve decompression. The mechanism of this observation is not yet understood. Potential confounders might have caused this observation and further research is needed.
Conflict of interests The authors declare that they have no conflicts of
interest.
Source of financial support Internal institutional financing.
References
1. Campbell WW, Vasconcelos O, Laine FJ. Focal atrophy of the multifidus
muscle in lumbosacral radiculopathy. Muscle Nerve. 1998;21(10):1350–3.
2. Hyun JK, Lee JY, Lee SJ, Jeon JY. Asymmetric atrophy of multifidus muscle in patients with unilateral lumbosacral radiculopathy. Spine
(Phila Pa 1976). 2007;32(21):E598–602.
3. Zhao WP, Kawaguchi Y, Matsui H, Kanamori M, Kimura T. Histochemistry and morphology of the multifidus muscle in lumbar disc herniation: comparative study between diseased and normal sides.
Spine (Phila Pa 1976). 2000;25(17):2191–9.
4. Yoshihara K, Shirai Y, Nakayama Y, Uesaka S. Histochemical changes in the multifidus muscle in patients with lumbar intervertebral disc
herniation. Spine (Phila Pa 1976). 2001;26(6):622–6.
5. Kader DF, Wardlaw D, Smith FW. Correlation between the MRI changes in the lumbar multifidus muscles and leg pain. Clin Radiol.
2000;55(2):145–9.
6. Pfirrmann CW, Dora C, Schmid MR, Zanetti M, Hodler J, Boos N. MR image-based grading of lumbar nerve root compromise due to disk herniation: reliability study with surgical correlation. Radiology.
2004;230(2):583–8.
7. Hodges P, Holm AK, Hansson T, Holm S. Rapid atrophy of the lumbar multifidus follows experimental disc or nerve root injury. Spine (Phila
Pa 1976). 2006;31(25):2926–33.
8. Kitajima Y, Eguchi Y, Ishibashi E, Nakashita S, Aoki S, Toda S, et al. Age-related fat deposition in multifidus muscle could be a marker for