HAL Id: insu-01627449
https://hal-insu.archives-ouvertes.fr/insu-01627449
Submitted on 2 Mar 2021
HAL is a multi-disciplinary open access
archive for the deposit and dissemination of
sci-entific research documents, whether they are
pub-lished or not. The documents may come from
teaching and research institutions in France or
abroad, or from public or private research centers.
L’archive ouverte pluridisciplinaire HAL, est
destinée au dépôt et à la diffusion de documents
scientifiques de niveau recherche, publiés ou non,
émanant des établissements d’enseignement et de
recherche français ou étrangers, des laboratoires
publics ou privés.
Comparison of OGO 6 measured thermospheric
temperatures with the MSIS-86 empirical model
A.E. Hedin, Gérard Thuillier
To cite this version:
A.E. Hedin, Gérard Thuillier. Comparison of OGO 6 measured thermospheric temperatures with the
MSIS-86 empirical model. Journal of Geophysical Research Space Physics, American Geophysical
Union/Wiley, 1988, 93 (A6), pp.5965-5971. �10.1029/JA093iA06p05965�. �insu-01627449�
Comparison of OGO 6 Measured Thermospheric Temperatures With
the MSIS-86 Empirical Model
A. E. HEDIN
Laboratory for Atmospheres, NASA Goddard Space Fli•tht Center, Greenbelt, Maryland G. THUILLIER
Service d'A•ronomie du Centre National de la Recherche Scientifique, Verridres-le-Buisson, France The thermospheric temperatures measured by the Fabry-Perod interferometer on the OGO 6 satellite are found to be reasonably represented by the mass spectrometer/incoherent scatter 1986 (MSIS-86) empirical model except for two anomalies, one in the South Atlantic and the other near noon local time. These anomalies are likely due to measurement problems. The OGO 6 temperature data were not used in the generation of the MSIS models, so this is an independent comparison of measured and model temperatures. The measurements were made primarily during daytime at mid to low latitudes and throughout the day at high latitudes. On average, the measured temperatures are 16 K below the MSIS-86 model temperatures. Latitude gradients during solstices as well as for the yearly average are well represented by the model, as are high-latitude longitudinal and magnetic activity variations.
INTRODUCTION
Measurements of thermospheric temperatures from ground stations and satellites provide valuable complementary infor- mation needed to understand the variability and physics of the thermosphere. Ground stations can provide a long time series of measurements to study solar activity and seasonal vari- ations which complement the global coverage provided by occasional satellites. The major methods of taking ground- based temperature measurements use optical (Fabry-Perot in- terferometer [Shepherd, 1972; Hernandez, 1986]) and radio (incoherent scatter [Evans, 1969]) techniques. The methods of determining temperature from a satellite have included the baffle-modulated mass spectrometer technique [Spencer et al., 1973, 1981], use of the Fabry-Perot interferometer [Blarnont and Luton, 1972; Hays et al., 1981], inference from N 2 den- sities [Hedin et al., 1974], and inference from total densities [Jacchia, 1965, 1971, 1977].
The first global models of the thermosphere were based on total densities determined from satellite drag, and temperature variations were inferred from density variations [Jacchia, 1965]. Early measurements of temperature by the incoherent scatter technique [Carru et al., 1967; Nisbet, 1967], however, showed significant differences in the diurnal and seasonal vari- ation as compared to satellite drag models. Temperatures in- ferred from N 2 densities [Hedin et al., 1974] were found to be similar to temperatures measured by incoherent scatter and led to the mass spectrometer/incoherent scatter (MSIS) series of models [Hedin et al., 1977; Hedin, 1983, 1987], which based temperature on N 2 density, incoherent scatter, and later also the baffle-modulated mass spectrometer technique.
Initial comparisons of nighttime thermospheric temper- atures measured by ground-based Fabry-Perot interferometers with temperatures determined using empirical models and in- coherent scatter showed reasonable agreement [Biondi and Feibelman, 1968; Hays et al., 1970; Cogger et al., 1970; Hernan- dez et al., 1975]. Examination of line shapes and theoretical
Copyright 1988 by the American Geophysical Union. Paper number 7A9443.
0148-0227/88/007A-9443502.00
estimates indicated that O(XD) should be in thermal equilibri-
um with the neutral
atmosphere
before
emission
of the 6300-,&
red line [Biondi and Feibelman, 1968]. However, a systematic comparison by Hernandez [1982] of data from Fritz Peak with predictions of several models, including the MSIS-77 model [Hedin et al., 1977], showed that the measured temper- atures were generally higher than those of the models by about 100 K, particularly at low solar activity. The MSIS-77 temperatures at mid-latitudes are somewhat higher than the MSIS-86 temperatures [Hedin, 1987] on average and are within 50 K of MSIS-86 temperatures under a wide variety of conditions. Measured temperatures that are higher than model temperatures have also been found for more limited data samples at other observation sites [Feibelman et al., 1972; Siplet et al., 1983; Biondi and Meriwether, 1985; Ya•Ti and Dyson, 1985]. Thus there may be a systematic difference between the optical technique and the other methods of tem- perature measurement under certain conditions. Recently, Yee [1988] has calculated the nonthermal distribution of the O(tD) atoms at night and concludes that the measured tem- perature of the red line emission would be higher than the ambient temperature by about 100 K, but this same con- clusion does not necessarily apply to daytime, when the sources of O(•D) are different, In addition, temperature gradi- ents near the emission peak may bias the altitude assigned to the measured temperature [McCormac et al., 1987].
The OGO 6 satellite was launched in an elliptical (400-1100 km) polar orbit in June 1969. It carried a spherical Fabry- Perot interferometer, which provided data until a spacecraft problem occurred in August 1970, for determining thermo-
spheric
temperatures
from the 6300-,1,
emission
at F region
heights [Blamont and Luton, 1972; Blamont et al., 1974]. Data were generally obtained during daytime at all lati- tudes and also during nighttime at high latitudes because of the line intensity increase in these regions. The typical statis- tical error of a single data point is 50 K. Data are generally obtained every 2 ø of latitude, but as the atmosphere is ob- served tangentially, an integration along the line of view is
made over 1500-2000 km. The altitude resolution, which
varies with spacecraft altitude, is 20 km at perigee.
5966 HEDIN AND THUILLIER.' BRIEF REPORT 8.00 4.50 3.00 -- _ I 0.00 -800 ' I ' i -300 I [ I o 300 800 TEMPERATURE DIFFERENCE (K)
Fig. 1. Histogram showing percent occurrence of OGO 6 measured minus MSIS-86 model temperature data for quiet magnetic conditions (Ap < 10). The solid curve shows the normal distribution based on the average difference of -16 K
and the standard deviation of 126 K.
400.00 200.00
0.00
el., -2oo.oo -400.00 200 O0 - 0,00 -200.00 -400.00 -90 i I , I , i I -45 45 80 I o LATITUDEFig. 2. (a) Measured minus MSIS-86 model temperatures averaged in 10 ø latitude bins versus latitude for quiet magnetic activity conditions. Bars show standard deviation of the scatter within each bin, with 250-1000 points per bin. (b)
Measured minus MSIS-86 model temperatures without time independent terms averaged in 10 ø latitude bins versus latitude and corresponding model prediction averages for the measurement conditions connected by straight lines. Stan- dard deviation is as described for Figure 2a.
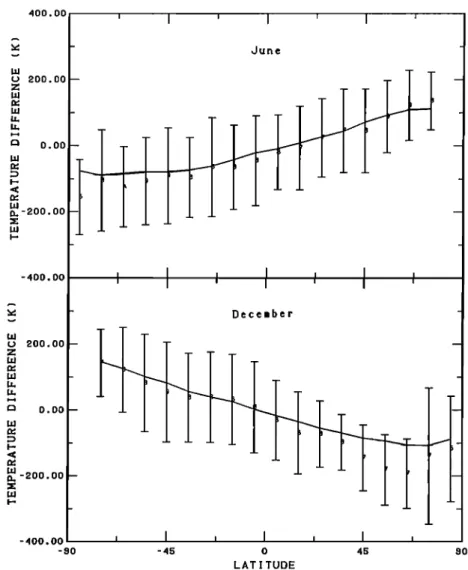
400.
oo
t ' i , i
June 200. O0•
o.oo
•-200 O0
-400.00 , _ December - • 200.00 • o.oo • _ • -2oo.oo -- _ -400,00 , I , , I , I , -80 -45 0 45 80 LATITUDEFig. 3. Measured minus MSIS-86 model temperatures without time independent and yearly variation terms averaged in 10 ø latitude bins versus latitude •r quiet magnetic activity conditions and corresponding model predictions (connected by straight lines) •r June solstice (upper panel) and December solstice (lower panel).
Early comparisons with Jacchia drag models showed that measured temperatures increased toward the poles and had larger seasonal variations and a later diurnal maximum than temperatures given by the drag models. There were originally 238,000 data points. Their behavior has been studied as a
function of the measurement conditions, such as minimum
altitude of the line of view, line and background intensities, threshold of the detector, and South Atlantic magnetic anom- aly. There was no normalization to ground-based or other
data. Selection criteria based on these considerations reduced
the original number of measurements to 47,331, which were suitably distributed as a function of latitude, day, and local time for the purpose of modeling. They have been incorpor- ated in three empirical models [Thuillier et al., 1977a, b, 1980]. More severe selection criteria would have provided a poor data distribution, for the purposes of the original mod- eling work, with respect to latitude, day, and local time, but they may be needed, as the comparisons with the model in this
paper suggest.
The OGO 6 temperature data were not incorporated in the MSIS models. This paper presents the results of a comparison of the OGO 6 optical Fabry-Perot temperatures with the MSIS-86 model temperatures in order to provide additional insight into the question of absolute thermospheric temper-
atures and variations.
COMPARISON AND DISCUSSION
The overall comparison of measured to model temperatures is shown in Figure 1 in terms of a histogram of the deviations from the MSIS-86 temperatures [Hedin, 1987]. The measured temperatures are on average only 16 K below the model tem- peratures but have a large standard deviation of 126 K. The data minus model residuals have a long tail toward positive
values. Further examination of the residuals, described below,
indicates that gross geophysical variations are very similar for the measured and model temperatures except for two obvious anomalies. However, there remains an inherent scatter in the residuals of the order of 100 K which may be due, in part, to waves and local heating not resolved by the limited spatial and temporal resolution of the model. The existence of large point to point variations, particularly at high latitudes, was noted by Blamont and Luton [1972].
The measured minus MSIS-86 model temperature differ- ences are shown as a function of latitude in Figure 2a using 10 ø averages. While the scatter within each bin is over 100 K, the scatter between bin averages is only 15 K. In order to emphasize the average variation of temperature with latitude, Figure 2b shows the differences between the measured and the model temperatures with the time independent terms (i.e., de- pendent on latitude, but not on day of year or time of day) of
5968 HEDIN AND THUILLIER' BRIEF REPORT 80.00
'•0
• -
ß • ß • O 0/
oo•
b _
4S.00 'o.oo
.o
-45
O0
•0 ß
O0
•
'
0
00•
ß
oO.
- •0 O0 - O0 • - 4S.00 -- -- L • - - • 0.00 -- L _ - --4B'00--
•eO• L
o
o
/
_%o
ß 0
oo --
•
_
-so.oo
,
I
,
I
,
I
- •0 -s0 0 s0 •0 LONGITUDEFi•. 4. (•) Contours of measured minus •S[S-86 model temperatures in lon•tude/lafitude coordinates usinS 30 ø longitude b• 15 • latitude bins for quiet magnetic acfivh• conditions. (b) Same as in FiSurc 4• but without lon•tude terms of the model. (c) •odcl prediction of longitude variations.
the model omitted. The similar comparison of the full model
calculated for the data conditions to the model without the
time independent terms provides the corresponding model predictions of the average latitude variation for the OGO 6 data. The data on average agree quite well with the ,--40-K increase from equator to poles predicted by the model.
The agreement between data and model for the seasonal temperature variations is shown in Figure 3, where model predictions of the latitudinal variation during the June and
December solstices are compared with data minus model pre- dictions with the time independent and yearly variation terms
omitted from the model. The most serious disagreement is at
moderately high latitudes during northern winter. The data here are largely from local times around noon and probably reflect a data anomaly around noon to be discussed later.
Thuillier et al. [1977al showed that there was general agree-
ment with incoherent scatter for the seasonal variations in
$0.00 I I I I I I 45.00 -- -- •' 0 00-- -- O. L
0
ß o0•
• Oo•
0 o0
-s0.00
,
I
,
0 • I• 18 •4 LOCAL TIME (hrs)Fig. 5. Contours of measured minus MSIS-86 model temperatures in local time/latitude coordinates using 2-hour local
time by 15 ø latitude bins for quiet magnetic activity conditions.
are much larger than in early drag models [dacchia 1965, 1971] and lead to a global maximum at much higher summer latitudes [Blarnont et al., 1974] than the sub-solar point lo- cation predicted by drag models.
The data minus model differences are shown in Figure 4 as
a function of latitude and longitude. Also shown are the model predictions for the longitudinal variations, originally esti- mated from N 2 density variations [Hedin et al., 1979], and the
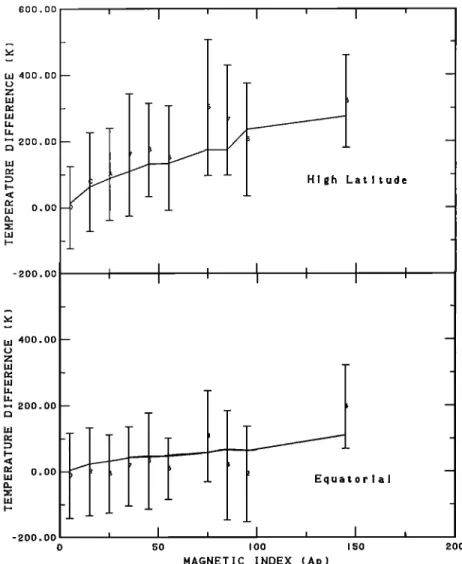
600.00 400.00 200.00 ld 0.00 -200.00 400.00 200.00 o.oo -200.00 atltude
Fig. 6. Measured minus MSIS-86 model temperatures, with model magnetic activity terms omitted, versus magnetic activity (Ap) averaged in 10-unit intervals and corresponding model predictions (connected by straight lines) for latitudes poleward of 60 ø (upper panel) and equatorward of 30 ø (lower panel).
0 SO I00 ISO 200
MAGNETIC INDEX (Ap)
-
T
orlal
5970 HEDIN AND THUILLIER' BRIEF REPORT 400.00 200.00 o.oo 200 oo . South Po ! e -400.00 200.00 o.oo -200.00 North Po ! e -400.00 0 21000 43200 04800 80400 UT ( sec )
Fig. 7. Measured minus MSIS-86 model temperatures, with model universal time terms omitted, versus universal time averaged in 2-hour intervals and corresponding model predictions (connected by straight lines) during quiet magnetic conditions for latitudes greater than 70 ø (lower panel) and less than -70ø(upper panel).
corresponding data minus model predictions without the lon- gitude terms of the model. At high latitudes the temperature enhancements near the magnetic poles are well represented by the model, including the larger effect at the south pole. OGO 6 temperature results near the magnetic poles at low and high magnetic activity were discussed by Thuillier et al. [1980].
In addition, however, the data (Figure 4) show a marked enhancement over the South Atlantic region. There are actu- ally relatively few data points here because data had been previously eliminated [Thuillier et al., 1977a] for high instru- ment background caused by the hard radiation encountered at high altitudes over the South Atlantic magnetic field anomaly. While it is possible that neutral temperatures may actually be enhanced in this region, an examination of Dynamics Ex- plorer neutral wind and temperature spectrometer (WATS) data [Spencer et al., 1981] which had good coverage over the South Atlantic did not show any evidence of this anomaly in the 300- to 400-km altitude range. In addition, the OGO 6 optical temperature increases sharply with altitude of the sat-
ellite to over 200 K above the model temperature near 800
km. Although restriction to lower satellite altitudes does not completely eliminate this anomaly, such a marked dependence
on satellite altitude is not observed outside the South Atlantic
region. Thus this effect is likely an OGO 6 measurement prob-
lem.
The data minus model differences are shown as a function
of latitude and local time in Figure 5. While differences are generally of the order of 20 K, there is a significant area of low measured temperatures around local noon. As noted by Thuil- lier et al. [1977a] and Blarnont et al. [1974], this anomaly was so severe in the original data that the apparent diurnal maxi- mum was at night, and even after refinement these data still
differ from the incoherent scatter data. Measurements in this
area are difficult because of low signal levels and high back- ground light levels, and so this noon depression may not be a real feature of the ambient atmosphere.
The data minus model differences, without the magnetic activity terms of the model, as a function of magnetic activity (Ap) averaged in 10 unit bins are shown in Figure 6. Also shown are the model predictions for the magnetic activity variations averaged for the data conditions. The general trends at low and high latitudes are fairly well represented by
the MSIS-86 model. The observed increase in magnetic ac-
tivity effects on thermospheric temperature toward high lati- tude, in contrast to little or no latitude dependence in drag models, was reported by Blarnont and Luton [1972] and mod-
eled by Thuillier et al. [1977a].
There is a significant temperature variation with universal time at high southern latitudes consistent with the model, as seen in Figure 7. At northern latitudes the universal time vari-
ation is weak and out of phase with the southern polar vari- ation, as predicted by the model and originally estimated from N 2 data [Hedin et al., 1979].
C•NCLUSION
The thermospheric temperatures measured by the Fabry- Perot interferometer on the OGO 6 satellite are reasonably represented by the MSIS-86 empirical model except for two anomalies, one in the South Atlantic and the other near local time noon, which are likely due to measurement problems. The OGO 6 temperature data were not used in the generation of the MSIS models, so this is an independent comparison of measured and model temperatures. Latitude gradients during solstices as well as for the yearly average are well represented by the model, as are magnetic activity and high-latitude longi-
tudinal and universal time variations. On average, the mea-
sured temperatures are 16 K below the MSIS-86 model tem- peratures. This agreement between temperatures measured by the satellite-borne Fabry-Periot interferometer and predicted by an empirical model is in contrast to differences of the order of 100 K found with ground-based optical measurements. However, outside the polar regions the satellite measurements were largely made during daytime, and the ground-based measurements during nighttime. Further detailed comparisons with ground-based measurements should shed more light on these temperature differences.
Acknowledgments. The Editor thanks F. Barlier and T. L. Killeen for their assistance in evaluating this paper.
REFERENCES
Biondi, M. A., and W. A. Feibelman, Twilight and nightglow spectral line shapes of oxygen 26300 and 25577 radiation, Planet. Space Sci., 16, 431-443, 1968.
Biondi, M. A., and J. W. Meriwether, Measured response of the equa- torial thermospheric temperature to geomagnetic activity and solar flux changes, Geophys. Res. Lett., 12, 267-270, 1985.
Blamont, J. E., and J. M. Luton, Geomagnetic effect on the neutral temperature of the F region during the magnetic storm of Septem- ber 1969, J. Geophys. Res., 77, 3534-3556, 1972.
Blamont, J. E., J. M. Luton, and J. S. Nisbet, Global temperature
distributions from the OGO 6 6300-A airglow measurements,
Radio $ci., 9, 247-251, 1974.
Carru, H., M. Petit, and P. Waldteufel, On the diurnal variation of the thermopause temperature, Planet. Space $ci., 15, 944-945, 1967. Cogger, L. L., (3. J. Nelson, M. A. Biondi, R. D. Hake, Jr., and D. P. Sipler, Coincident F region temperature determinations from inco-
herent backscatter and Doppler broadening of [O I] 6300 A, J.
Geophys. Res., 75, 4887-4889, 1970.
Evans, J. V., Theory and practice of ionosphere study by Thomson scatter radar, Proc. IEEE, 57, 496-530, 1969.
Feibelman, W. A., R. D. Hake, Jr., D. P. Sipler, and M. A. Biondi, Twilight and nighttime ionospheric temperatures from oxygen 26300 and 25577 spectral line profiles, J. Geophys. Res., 77, 1869- 1877, 1972.
Hays, P. B., A. F. Nagy. and K. D. McWatters. Comparison of radar and optical temperature measurements in the F region, J. Geophys. Res., 75, 4881-4882, 1970.
Hays, P. B., T. L. Killeen, and B.C. Kennedy, The Fabry-Perot interferometer on Dynamics Explorer, Space Sci. Instrum., 5, 395-
416, 1981.
Hedin, A. E., A revised thermospheric model based on mass spec- trometer and incoherent scatter data: MSIS-83, J. Geophys. Res., 88, 10,170-10,188, 1983.
Hedin, A. E., MSIS-86 thermospheric model, J. Geophys. Res., 92, 4649-4662, 1987.
Hedin, A. E., H. (3. Mayr, C. A. Reber, N. W. Spencer, and (3. R.
Carignan, Empirical model of global thermospheric temperature and composition based on data from the OGO 6 quadrupole mass spectrometer, .I. Geophys. Res., 79, 215-225, 1974.
Hedin, A. E., et al., A global thermospheric model based on mass spectrometer and incoherent scatter data, MSIS 1, N 2 density and temperature, J. Geophys. Res., 82, 2139-2147, 1977.
Hedin, A. E., C. A. Reber, N. W. Spencer, H. C. Brinton, and D.C. Kayser, Global model of longitude/UT variations in thermospheric composition and temperature based on mass spectrometer data, J. Geophys. Res., 84, 1-9, 1979.
Hernandez, G., Mid-latitude thermospheric neutral kinetic temper- atures, 1, Solar, geomagnetic, and long-term effects, J. Geophys.
Res., 87, 1623-1632, 1982.
Hernandez, G., Fabry-Perot Interferometers, Cambridge University
Press, New York, 1986.
Hernandez, G., T. E. VanZandt, V. L. Peterson, and J.P. Turtle, Comparison of optical and incoherent scatter measurements of nighttime exospheric temperature at the magnetic equator, J. Geoo phys. Res., 80, 3271-3274, 1975.
Jacchia, L. G., Static diffusion models of the upper atmosphere with empirical temperature profiles, Smithson. Contrib. Astrophys., 8,
215-222, 1965.
Jacchia, L. G., Revised static models of the thermosphere and exo- sphere with empirical temperature profiles, Spec. Rep. 332, Smith- son. Astrophys. Obs., Cambridge, Mass., 1971.
Jacchia, L. G., Thermospheric temperature, density, and composition: New models, Spec. Rep. 375, Smithson. Astrophys. Obs., Cam- bridge, Mass., 1977.
McCormac, F. G., T. L. Killeen, B. Nardi, and R. W. Smith, How close are ground-based Fabry-Perot thermospheric wind and tem- perature measurements to exospheric values? A simulation study, Planet. Space $ci., 35, 1255-1265, 1987.
Nisbet, J. S., Neutral atmospheric temperature from incoherent scat- ter observations, J. Atmos. Terr. Phys., 24, 586-593, 1967.
Shepherd, G. G., Spectroscopic measurement of upper atmosphere temperature, in Temperature: Its Measurement and Control in Sci- ence and Industry, vol. 4, edited by H. H. Plumb, part 3, pp. 2313- 2327, Instrument Society of America, Pittsburgh, Pa., 1972. Sipler, D. P., M. A. Biondi, and R. G. Roble, F-region neutral winds
and temperatures at equatorial latitudes: Measured and predicted behavior during geomagnetically quiet conditions, Planet. Space
$ci., 31, 53-66, 1983.
Spencer, N. W., H. B. Niemann, and (3. R. Carignan, The neutral- atmosphere temperature instrument, Radio Sci., 8, 287-296, 1973. Spencer, N. W., L. E. Wharton, H. B. Niemann, A. E. Hedin, (3. R.
Carignan, and J. C. Maurer, The Dynamics Explorer wind and temperature spectrometer, Space $ci. Instrum., 5, 417-428, 1981. Thuillier, G., J. L. Falin, and C. Wachtel, Experimental global model
of the exospheric temperature based on measurements from the Fabry-Perot interferometer on board the OGO-6 satellite, J. Atmos. Terr. Phys., 39, 399-414, 1977a.
Thuillier, (3, J. L. Falin, and F. Barlier, Global experimental model of the exospheric temperature using optical and incoherent scatter measurements, J. Atmos. Terr. Phys., 39, 1195-1202, 1977b. Thuillier, G., J. L. Falin, and F. Barlier, Magnetic activity effects on
the exospheric temperatures at high latitudes, J. Atmos. Terr. Phys., 42, 653-660, 1980.
Yagi, T., and P. L. Dyson, Measurements of thermospheric temper- atures at a mid-latitude station, Planet. Space $ci., 33, 203-206,
1985.
Yee, J., Non-thermal distribution of O(XD) atoms in the nighttime thermosphere, Planet. Space $ci., 36, 89-97, 1988.
A. E. Hedin, NASA Goddard Space Flight Center, Code 614, Greenbelt, MD 20771.
G. Thuillier, Service d'A6ronomie du Centre National de la Re- cherche Scientifique, 91371 Verri•res-le-Buisson, France.
{Received December 17, 1987; revised February 26, 1988; accepted March 17, 1988.)