DOI 10.1007/s00122-013-2202-x ORIGINAL PAPER
Grapevine powdery mildew resistance and susceptibility loci
identified on a high‑resolution SNP map
Paola Barba · Lance Cadle‑Davidson · James Harriman · Jeffrey C. Glaubitz · Siraprapa Brooks · Katie Hyma · Bruce Reisch
Received: 27 November 2012 / Accepted: 10 September 2013 / Published online: 27 September 2013 © Springer-Verlag Berlin Heidelberg (outside the USA) 2013
resistance locus from V. rupestris B38 and ten SNPs on chromosome 9 associated with a locus for susceptibility from ‘Chardonnay’ using single marker association and linkage disequilibrium analysis. Linkage maps for V. rup-estris B38 (1,146 SNPs) and ‘Chardonnay’ (1,215 SNPs) were constructed and used to corroborate the ‘Chardonnay’ locus named Sen1 (Susceptibility to Erysiphe necator 1), providing the first insight into the genetics of susceptibility to powdery mildew from V. vinifera. The identification of markers associated with a susceptibility locus in a V. vinif-era background can be used for negative selection among breeding progenies. This work improves our understand-ing of the nature of powdery mildew resistance in V. rup-estris B38 and ‘Chardonnay’, while applying next-genera-tion sequencing tools to advance grapevine genomics and breeding.
Introduction
Powdery mildew (PM) resistance differs among and within Vitis species (Cadle-Davidson et al. 2011). While most European V. vinifera cultivars are susceptible to the PM fun-gus Erysiphe necator, North American species such as V. Abstract Improved efficacy and durability of powdery
mildew resistance can be enhanced via knowledge of the genetics of resistance and susceptibility coupled with the development of high-resolution maps to facilitate the stack-ing of multiple resistance genes and other desirable traits. We studied the inheritance of powdery mildew (Erysiphe necator) resistance and susceptibility of wild Vitis rupestris B38 and cultivated V. vinifera ‘Chardonnay’, finding evi-dence for quantitative variation. Molecular markers were identified using genotyping-by-sequencing, resulting in 16,833 single nucleotide polymorphisms (SNPs) based on alignment to the V. vinifera ‘PN40024’ reference genome sequence. With an average density of 36 SNPs/Mbp and uniform coverage of the genome, this 17K set was used to identify 11 SNPs on chromosome 7 associated with a
Mention of trade names or commercial products is solely for the purpose of providing specific information and does not imply recommendation or endorsement by the U.S. Department of Agriculture.
Communicated by R. Töpfer.
Electronic supplementary material The online version of this article (doi:10.1007/s00122-013-2202-x) contains supplementary material, which is available to authorized users.
P. Barba
Department of Plant Breeding, Cornell University, Ithaca, NY 14853, USA
L. Cadle-Davidson · S. Brooks
USDA/ARS Grape Genetics Research Unit, Geneva, NY 14456, USA
J. Harriman · J. C. Glaubitz
Institute for Genomic Diversity, Cornell University, Ithaca, NY 14853, USA
K. Hyma
Computational Biology Service Unit, Cornell University, Ithaca, NY 14853, USA
B. Reisch (*)
Department of Horticulture, New York State Agricultural Experiment Station, Cornell University, Geneva, NY 14456, USA e-mail: [email protected]
rupestris, V. riparia, V. aestivalis, V. cinerea and V. rotundi-folia are generally considered to be resistant (Alleweldt et al. 1991; Pearson 1988). The nature of PM resistance in V. rup-estris or susceptibility in ‘Chardonnay’ are not completely understood, but early studies of the inheritance of PM resist-ance in V. rupestris suggested that the trait was controlled by a polygenic system (Boubals 1961), while a recent study of the mechanism of resistance classified one V. rupestris geno-type as having partial resistance with a low incidence of pro-grammed cell death (PCD) (Feechan et al. 2010).
Dominant single loci and quantitative trait loci (QTL) may control different mechanisms of plant-pathogen inter-actions. In grapevine PM, dominant single locus resistance is typically thought to be related to a gene-for-gene interac-tion (Jones and Dangl 2006; Feechan et al. 2010; Coleman et al. 2009). In most cases, this type of resistance confers complete protection against specific races of the pathogen but also induces strong selective pressure over pathogen populations, which could potentially overcome resist-ance, as has been observed in grapevines (Cadle-Davidson et al. 2011; Peressotti et al. 2010). However, quantitative resistance is described as less likely to be overcome as it is due to the cumulative effect of several loci that might play a role at different stages of the plant immune response (Poland et al. 2009). For a vineyard that is expected to be productive for 15–20 years, durable resistance is desired.
Wild species harbor an assortment of undesirable flavors and viticultural traits, and thus introgression of PM resist-ance alleles is usually accompanied by off-flavors and traits that are not desired by consumers and growers. Moreover, the genetic nature of the resistance mechanism adds com-plexity, as quantitative traits may require introgression of several minor loci to reach the desired level of resistance. Marker assisted selection (MAS) helps to overcome these constraints. Molecular markers can be used to select resist-ant genotypes, avoid susceptibility alleles, combine traits, reduce linkage drag and stack several loci, while markers distributed along the genome may help to recover the cul-tivated background (Dalbó et al. 2001; Eibach et al. 2007; Mahanil et al. 2011; Di Gaspero and Cattonaro 2009). However, as more traits are tracked and combined, greater marker resolution and accuracy are needed to identify desirable recombination events.
The relevance of molecular markers to grapevine genet-ics has driven the development of a common set of mark-ers and genetic maps (Riaz et al. 2004; Adam-Blondon et al. 2004; Doligez et al. 2006). Nowadays, the International Grape Genome Program refers to an integrated map con-taining more than 400 SSR markers (http://www.vitaceae. org/index.php/Maps_and_Markers) in addition to a dense genetic linkage map anchored to the ‘Pinot noir’ genome with 1,006 markers (Troggio et al. 2007). Physical maps have also been developed, such as the V. vinifera grapevine
reference genome for a nearly homozygous selection, PN40024 (Jaillon et al. 2007), ‘Cabernet Sauvignon’ (Mor-oldo et al. 2008) and ‘Pinot noir’ (Velasco et al. 2007). Next-generation sequencing (NGS) has been employed recently for the construction of a genetic map with 1,643 SNPs derived from a cross of Z180 (V. monticola × V.riparia) and Beihong (V. vinifera × V. amurensis) (Wang et al. 2012) and to develop a SNP chip with an array of nearly 9,000 SNPs based on the sequence of 10 cultivated V. vinifera varieties and 7 wild species (Myles et al. 2010, 2011). This genotyp-ing microarray has been used successfully to identify V. vin-ifera markers flanking the introgressed PM resistance locus Ren4 (Mahanil et al. 2011).
Whole genome sequencing and NGS have boosted genomic research in several plant species (Deulvot et al. 2010; Poland et al. 2012; Xie et al. 2010; Morrell et al. 2012). Single nucleotide polymorphism (SNP) markers can be identified from short reads generated by NGS, either by aligning to a reference genome or by de novo assembly (Nielsen et al. 2011). The adoption of techniques, such as reduced representation libraries (RRLs) to lower genome complexity (Van Tassell et al. 2008; Wiedmann et al. 2008; Barbazuk et al. 2005), and barcoded adapters to allow pool-ing hundreds of samples in a spool-ingle sequencpool-ing lane has significantly reduced the cost per marker and per sample (Elshire et al. 2011).
Nowadays, genotyping-by-sequencing (GBS) provides a simple and robust procedure for simultaneous SNP dis-covery and genotyping through pooled barcoded RRLs, Illumina sequencing and SNP calling based on alignment of short reads. As a result, thousands of markers with low coverage are obtained (Elshire et al. 2011), which should be sufficient to infer linkage in biparental populations and for QTL mapping (Davey et al. 2011). Due to its speed, low cost, and reduced ascertainment bias, GBS is a good strategy for simultaneous discovery and assay of SNPs suit-able for rapid development of dense maps in segregating populations.
In this study, we present the discovery of a dense set of SNPs using the GBS procedure with an F1 grapevine fam-ily. SNPs were positioned in the 12× V. vinifera ‘PN40024’ reference genome (Jaillon et al. 2007) and tested for asso-ciation with PM severity. Linkage maps were constructed using a subset of SNPs. QTL interval mapping confirmed the discovery of a susceptibility QTL from ‘Chardonnay’. Materials and methods
Plant material
Seeds from the cross of V. rupestris B38 (resistant) with V. vinifera ‘Chardonnay’ (susceptible) were obtained in
2008, then stratified, germinated in a greenhouse, and planted to a field nursery (Geneva, NY, USA) 0.46 m apart within rows and 1.52 m between rows in 2009. At the end of the growing season, vines were pruned and stored at 4 °C in the dark over the winter. All 85 vines were planted 1.2 m apart within a single vineyard row in Geneva. A control block was placed at the head of the row with: V. vinifera ‘Chardonnay’, V. hybrid ‘Chancellor’ (Seibel 5163 × Seibel 880), V. rupestris B38, V. hybrid ‘Hori-zon’ (‘Seyval’ × ‘Schuyler’) and the PM resistant selec-tion, NY88.0514.04. A susceptible control (‘Chardonnay’) was placed after every 15 seedling vines. Downy mildew was controlled in 2010 and 2011 using the fungicide Cap-tan 80WPG, which is not registered for control of PM, and does not provide commercially acceptable PM control in the field.
Quantification of powdery mildew severity
Powdery mildew infection was evaluated on parents and progeny by visual evaluation of field-grown vines over 3 years. Disease was allowed to progress naturally, and foliage of each vine was evaluated as follows: in 2009 a visual scale from 0 to 3 was used near the end of the grow-ing season (0: absent, 1: less than 5 small spots, 2: five to twenty spots, growing, 3: widespread, dense sporulation); In 2010, on August 9, August 20, August 30, September 7, and September 20 using the IPGRI scale established by the Organisation Internationale de la Vigne et du Vin (IPGRI et al. 1997); and in 2011 on July 7 and August 18, again using the IPGRI scale.
DNA extraction, library preparation, and sequencing DNA was extracted from two unexpanded leaves (less than 1 cm2) from each parent and progeny vine using either the DNeasy® 96 Plant Kit (Qiagen) or the DNeasy® Plant Mini Kit (Qiagen) and quantified using Quant-iT™ PicoGreen ® dsDNA Kit (Invitrogen). Whole genome amplification was performed using 10 ng of DNA and the Illustra™ Genomi-Phi™ V2 DNA Amplification Kit (GE Healthcare). Ampli-fied DNA (1.0 μg) was plated and dried using a vacuum centrifuge.
Dried DNA was resuspended and digested at 75 °C for 2 h using a 10 μl mix containing 4 units of ApeKI restriction endonuclease (New England Biolabs, Ipswich, MA, USA) and 1 μl of 10× NEBuffer 3, then cooled on ice. Forty-eight unique barcode adapters were used to track individual DNA samples (Elshire et al. 2011). Dried barcode adapters were resuspended by pipeting 40 μl of a ligation mix con-taining 4 units of T4 DNA Ligase (Promega) in 2× rapid ligation buffer (Promega). Resuspended barcode adapt-ers were mixed with cooled digested DNA. Ligation was
performed at room temperature for 60 min, followed by incubation at 65 °C for 30 min to inactivate the enzyme and then cooling on ice until to the next step. Ligation products were purified using 90 μl of Agencourt AMPure (Beck-man Coulter) beads per the (Beck-manufacturer’s instructions and eluted in 35 μl of EB Buffer (Qiagen). PCR was performed by adding the following to 10 μl of the eluted ligation product: 22.5 μl of water, 2 μl of dNTPs (10 mM), 5 μl of Primer mix (5′ AATGATACGGCGACCACCGAGATCAC
TCTTTCCCTACACGACGCTCTTCCGATCT 3′ and 5′
AAGCAGAAGACGGCATACGAGATCGGTCTCGGCAT TCCTGCTGAACCGCTCTTCCGATCT 3′, 5 μM each),
10 μl of 5× buffer and 0.5 μl of Phusion DNA polymer-ase (Finnzymes). Amplifications were performed by ini-tial denaturation at 98 °C for 30 s; 18 cycles of 10 s at 98 °C, 30 s at 65 °C and 30 s at 72 °C; and a final step of 72 °C for 5 min. PCR products were purified using Agen-court AMPure beads and EB Buffer as described above. The result was a sequencing library for each DNA sam-ple, which were individually quantified using Quant-iT™ PicoGreen® dsDNA Kit (Invitrogen). Libraries with con-centrations lower than 10 ng/μl were repeated either from re-extracted DNA or by repeating the PCR step in tripli-cate and pooling 3 PCR products during the last AMPure elution step. For 20 arbitrarily selected libraries across the range of concentrations, size distribution and proportion of adapter dimers were quality checked using an Experion™ Automated Electrophoresis System (Bio-Rad).
The barcoded libraries were normalized and two pools of up to 48 samples were prepared with a final concentra-tion of 0.5 ng/μl each. Each pool was sequenced on a sin-gle flow cell lane using Illumina instruments at the Cornell University Life Sciences Core Laboratories Center: the first pool on an Illumina Genome Analyzer III (GA3) and the second on an Illumina HiSeq 2000. In both cases, sin-gle end sequencing was performed with a read length of 100 bp.
SNP calling, localization and distribution on the reference genome
The raw sequence data were processed into SNP genotype files in HapMap format using the TASSEL 3.0 GBS pipe-line (Glaubitz et al. 2012). First, all of the 100 bp reads that contained a known barcode along with the expected ApeKI cut site remnant were converted into 64 base sequence tags (where, barring sequencing errors, each tag represented an allele) by trimming off the barcode along with excess 3′ nucleotides. Reads containing N’s
within the first 64 bases after the barcode were rejected. Reads that contained either the beginning of the common (non-barcoded) adapter (from short restriction fragments) or a full ApeKI site (from incomplete digest or chimera
formation) within the first 64 bases after the barcode were truncated accordingly. A master tag list was constructed comprising all tags that were observed at least 10 times across all of the samples. These tags were then aligned to the 12× V. vinifera ‘PN40024’ reference genome (Jaillon et al. 2007) using a Burrows–Wheeler Aligner (BWA) (Li and Durbin 2009) with default parameters. Tags located at the same, unique position on the grapevine reference genome and containing no more than two SNPs relative to the reference were then aligned against each other, which, along with information from the barcodes indicating which samples each tag was observed in, allowed SNP genotypes to be called. SNPs were output only if 40 % or more of the samples were covered by at least one of the tags at the corresponding locus and if the minor allele frequency (MAF) was at least 0.1. Indel polymorphisms were ignored as were any additional rare alleles beyond the major and minor alleles. Subsequently, additional fil-tering was applied so that only SNPs with a MAF between 0.15 and 0.35 were retained, according to the expected MAF of 0.25 for markers in an AB:AA configuration in the parents.
Marker density and single marker association analyses More stringent filters were used for the marker density and trait association analyses. Only sites with less than 20 % missing data were retained. Out of the remaining geno-types, there were 4 % for which only the minor allele was sequenced; these were imputed as heterozygotes. The SNPs were then further filtered to retain only SNPs with MAF 0.25 ± 0.05. These filters and minimal imputation resulted in a data set consisting of 16,833 SNPs (17K SNP set). Pearson’s correlation (r) was used to determine correspond-ence between the number of SNPs per chromosome and its physical size. A bin analysis was used to estimate SNP density across the V. vinifera ‘PN40024’ reference genome, by counting the number of SNPs in contiguous windows of 500 kb.
To find associations of single SNPs with PM severity, a general linear model (GLM) was used (TASSEL 3.0, Bradbury et al. 2007). The false discovery rate was con-trolled according to the Benjamini–Hochberg procedure implemented in the multtest package in R (Pollard et al. 2004). For site by all linkage disequilibrium (LD) analy-sis, markers were assigned to either ‘Chardonnay’ (9,187 SNPs) or V. rupestris B38 (6,213 SNPs) according to the sequence information of the parents for a given site. Markers with missing data in both parents were not con-sidered in this analysis (1,433 SNPs). Linkage disequilib-rium (D′) between individual markers and parental SNPs
was determined using the “site by all” option in TASSEL 4.1.18.
Linkage maps
To construct linkage maps with JoinMap 4.1 (Van Ooijen 2006), the 17K SNP set was filtered down to 2,543 SNPs, a number below the 3,000 marker threshold of the current ver-sion of the software. Prior to the filtering process, four indi-viduals (43, 68, 69 and 71) were discarded due to their high proportion of missing data. Filtering was based on parental information, physical distance, physical location, LD and missing data. First, we selected markers based on parental information: markers that were homozygous, had missing data or were heterozygous in both parents were discarded, as well as markers located on non-aligned chromosomes, obtaining a set of 5,592 and 7,197 markers for V. rupes-tris B38 and ‘Chardonnay’. We further discarded markers located within 64 bp of each other, obtaining two parental SNP sets of 3,502 and 4,631 markers for V. rupestris B38 and ‘Chardonnay’, respectively. These parental SNP sets were used for whole genome LD analysis in TASSEL 4.1.18; markers that were not in LD with their physical chromosome (378 and 1,003) were discarded. Finally, we filtered out markers that were positively correlated within 500 bp and sites with more than 10 % missing data. Significant hits from the single marker association test were included, as well as markers located in the random portion of chromosome 7. We obtained a set of 1,222 and 1,321 markers for the V. rupestris B38 and ‘Chardonnay’ maps, respectively.
Linkage groups (LG) were determined by JoinMap 4.1 using a minimum LOD score of 6.0, and numbered accord-ing the physical chromosome numbers. While ‘Chardon-nay’ SNPs resulted in 19 LG, V. rupestris B38 SNPs were clustered in 20 LG. Maps and the order of markers were generated using the regression mapping algorithm with the Haldane function and default parameters. Two LG with SNPs from both ends of chromosome 1 were joined after each map was ordered and oriented.
Maps resulting from JoinMap were further analyzed by R/QTL software (Broman et al. 2003) using a 4 way cross format with missing information. First, we analyzed the number of crossovers per individuals as a function of miss-ing data to identify possible outliers (Supplementary material S1). Individuals 2, 36, 45, 50, 55, 62, 66, 70, 74, and 76 were discarded due to higher proportion of crossing over, which may indicate pollen contamination or sample mix-up during DNA manipulation stages. Genotyping errors were identified by visual inspection of plot.geno maps according to Ward et al. (2013), and replaced with missing data. Distances were recalculated by est.map using Kosambi function. Problem-atic markers were determined with the droponemarker com-mand; a few markers with higher LOD scores, that increased the map size and whose genetic and physical positions were in conflict were removed. Finally, distances were recalcu-lated using the est.map function as described above.
QTL analysis
Quantitative trait loci mapping was performed with the one-dimension scan function, scanone, of R/QTL software using a normal model, Haley–Knott regression method and default parameters. Multipoint genotype probabili-ties were calculated beforehand using calc.genoprob with step = 1 and default parameters. LOD significance scores were determined by permutation tests (10,000). Position was refined using the refineqtl function, and the presence of supplementary QTLs was corroborated with the addqtl command.
Results
Field evaluation of PM severity
Disease progression varied from year to year. In 2009, the population mean score was 2.1 (of 3 max) on October 8. In 2010, disease progression was evaluated 5 times with the IPGRI scale (1–9); with population mean scores of 4.7 on August 9, 6.7 on August 20, 7.8 on August 30 and Sep-tember 7, and 7.6 on SepSep-tember 20. In 2011 the disease progressed earlier, with population disease severity mean scores of 3.7 on July 12 and 8.0 on August 18 (Fig. 1). Genotyping: Sequencing, SNP calling and SNP selection Averages of 712,400 reads per vine (n = 46) and 2,787,000 reads per vine (n = 42) were obtained per sequencing
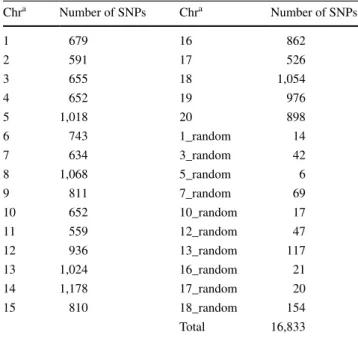
batch, for the Illumina GA3 and HiSeq machines, respec-tively. The distribution of the number of reads obtained per vine sample is shown in Fig. 2. The TASSEL SNP call con-taining 42,172 SNPs had a correlation (r) of 0.9 between SNPs per chromosome and chromosome physical size in bp. Further filtering and minimal imputation lead to a less redundant set of 16,833 SNPs (17K SNP set) with r = 0.82 (Table 1).
Distribution and density of 17K SNP set on the grapevine reference genome
The 17K SNP set showed similar marker densities among chromosomes, ranging from a mean value of one SNP every 36 kb on chromosome 4 to one SNP every 21 kb on chromosome 8. To identify local increases or decreases in marker density, the V. vinifera ‘PN40024’ reference genome was divided into 863 bins of 500 kb and the num-ber of SNPs within each bin was determined.
Within chromosomes, SNP density varied. While 606 (70 %) of the 500 kb bins had a moderate number (10–50) of SNPs, there were 240 bins (28 %) with fewer than 10 SNPs, 7 bins with zero SNPs and 10 bins with a SNP den-sity from 51 to 106 (Fig. 3). The 17K SNP set had a mean value of 18 SNPs per 500 kb bin.
Single marker association test and LD analysis
Among all dates scored, 22 markers were significantly associated with PM severity at α = 0.05 after multiple test correction. The strongest association was found between SNP S8_19258484 from ‘Chardonnay’ and PM severity evaluated on August 18, 2011, with a corrected p value
Fig. 1 Distribution of powdery mildew scores among the progeny for July 12, 2011 (grey) and August 18, 2011 (black). Scores for parents
Vitis rupestris B38 (star) and ‘Chardonnay’ (circle) are shown on the
x axis for both dates
Fig. 2 The number of reads obtained per vine. Numbers of reads obtained for parents Vitis rupestris B38 (R) and Vitis vinifera ‘Char-donnay’ (Ch) are indicated with asterisks. Sample average values for each pooled library are indicated by horizontal lines
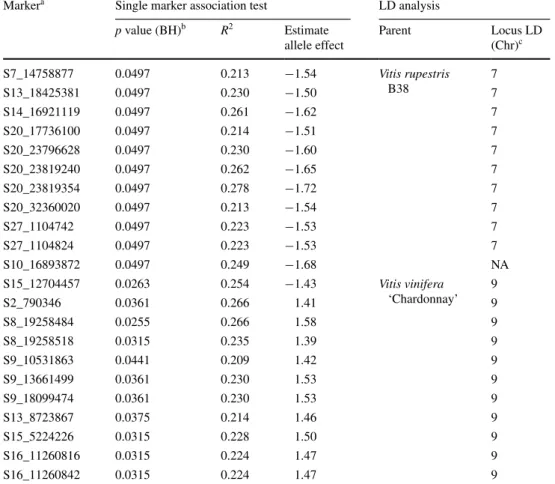
of 0.0255. The proportion of the phenotypic variance explained by each significant marker ranged from 0.209 to 0.278 (Table 2). A subset of 10 alleles from ‘Chardonnay’
all led to increased PM severity, with estimated effects between 1.39 and 1.58. One minor allele from ‘Chardon-nay’ in repulsion with the other 10 significant minor alleles (Supplementary material S2) reduced PM severity with an estimated effect of −1.43. V. rupestris B38 alleles always reduced PM severity by 1.50–1.72.
The associated markers appeared to represent at least 10 different chromosomes based on the physical PN40024 reference sequence (Table 2). To quickly test whether they genetically map to fewer loci, LD analy-sis was conducted. SNPs were genetically assigned to a chromosome if they were in significant LD with other markers on that chromosome (e.g., Fig. 4). For 11 of the 22 markers significantly associated with PM severity, the chromosomal placement from this LD analysis conflicted with the physical chromosomal assigned by alignment to the V. vinifera ‘PN40024’ reference genome (Table 2). Markers that aligned to chromosome 20 were not con-sidered to be conflicting, as this “chromosome” is a col-lection of sequence contigs that have not yet been placed on any of the 19 chromosomes in the reference genome. All 11 significant SNPs coming from ‘Chardonnay’ were found to be in LD with other markers on chromosome 9. For V. rupestris B38, 10 out of 11 SNPs were found to be in LD with chromosome 7 (Fig. 4); SNP S10_16893872 was not in LD with any chromosome (Supplementary material S3).
To test whether discrepancies between genetic position and alignment to the reference genome correspond to major
Table 1 Number of SNPs per chromosome of the reference genome PN40024 in the 17K SNP set. SNPs were selected based upon maxi-mum missing data of 20 %, minor allele frequency of 0.25 ± 0.05, and inferring that rare allele homozygotes are actually heterozygous
a Chr indicates chromosome location, Chr20 contigs have not been assigned to a chromosome, and suffix ‘_random’ corresponds with unassembled portions of the indicated reference chromosome Chra Number of SNPs Chra Number of SNPs 1 679 16 862 2 591 17 526 3 655 18 1,054 4 652 19 976 5 1,018 20 898 6 743 1_random 14 7 634 3_random 42 8 1,068 5_random 6 9 811 7_random 69 10 652 10_random 17 11 559 12_random 47 12 936 13_random 117 13 1,024 16_random 21 14 1,178 17_random 20 15 810 18_random 154 Total 16,833
Fig. 3 SNP density across the
Vitis vinifera 12× grapevine
reference genome PN40024 (Jaillon et al. 2007). Each block represents a 500 kb bin of the
Vitis vinifera 12× grapevine
reference genome. The color scale on the right represents the number of SNPs located within each 500 kb bin. Bins with no markers are framed with grey
color. From the 17K SNP set, 95 % of markers were distrib-uted among assembled chromo-somes 1–19, with a mean value of 18 SNPs/500 kb. Correlation (r) between chromosome size and number of markers per chromosome was 0.82
genome reorganization, a whole genome LD (D′) analysis
was completed within parental SNP sets (Supplementary material S4). The vast majority of markers were in LD with markers on the same chromosome. No major blocks of rearrangements were observed either in QTL regions (link-age groups 7 and 9) or among other chromosomes for V. rupestris B38 or ‘Chardonnay’, but on every chromosome individual markers or small groups of markers were in LD with other chromosomes.
Linkage maps
Maps were constructed for V. rupestris B38 and ‘Char-donnay’ with 1,146 and 1,215 SNPs each, covering 1,645 and 1,967 cM, respectively. The size and number of mark-ers for each LG are described in Table 3. All significant markers (Table 2) were included in Joinmap 4.1 for link-age map construction, but five of 11 markers in V. rupes-tris B9 (S7_14758877, S20_17736100, S27_1104742,
Table 2 Summary statistics for markers significantly associated with powdery mildew severity, at α = 0.05
A general linear model was used to test for single marker associations with powdery mildew reactions using TASSEL 3.0
a Marker name corresponds with chromosome location in the PN40024 reference genome. S20 markers have not been assigned to a chromosome, and S27 corresponds to unassembled portions of chromosome 7
b The false discovery rate was controlled according to the Benjamini–Hochberg (BH) procedure
c Locus LD reports the refer-ence chromosome to which the marker was in linkage disequi-librium. S10_16893872 was not in LD with any PN40024 refer-ence chromosome (NA)
Markera Single marker association test LD analysis
p value (BH)b R2 Estimate allele effect Parent Locus LD (Chr)c S7_14758877 0.0497 0.213 −1.54 Vitis rupestris B38 7 S13_18425381 0.0497 0.230 −1.50 7 S14_16921119 0.0497 0.261 −1.62 7 S20_17736100 0.0497 0.214 −1.51 7 S20_23796628 0.0497 0.230 −1.60 7 S20_23819240 0.0497 0.262 −1.65 7 S20_23819354 0.0497 0.278 −1.72 7 S20_32360020 0.0497 0.213 −1.54 7 S27_1104742 0.0497 0.223 −1.53 7 S27_1104824 0.0497 0.223 −1.53 7 S10_16893872 0.0497 0.249 −1.68 NA S15_12704457 0.0263 0.254 −1.43 Vitis vinifera ‘Chardonnay’ 9 S2_790346 0.0361 0.266 1.41 9 S8_19258484 0.0255 0.266 1.58 9 S8_19258518 0.0315 0.235 1.39 9 S9_10531863 0.0441 0.209 1.42 9 S9_13661499 0.0361 0.230 1.53 9 S9_18099474 0.0361 0.230 1.53 9 S13_8723867 0.0375 0.214 1.46 9 S15_5224226 0.0315 0.228 1.50 9 S16_11260816 0.0315 0.224 1.47 9 S16_11260842 0.0315 0.224 1.47 9
Fig. 4 Linkage disequilibrium of a single SNP with whole genome SNPs from the corresponding parent, measured as D′. SNP S16_11260816 (a) is shown as a representative example of linkage to chromosome 9 in ‘Chardonnay’. SNP S20_32360020 (b) is shown as
a representative example of linkage to chromosome 7 in Vitis
rupes-tris B38. X axis indicates SNP positions based on alignment to physi-cal map (PN40024). All significant markers from Table 2 are shown in Supplementary material S3
S27_1104824 and S10_16893872) and two of 11 markers in ‘Chardonnay’ (S9_10531863 and S15_5224226) were discarded by the regression mapping algorithm. Mark-ers S20_23819240 and S16_11260842 were discarded due to duplication with markers S20_23819354 and S16_11260816, respectively.
QTL analysis
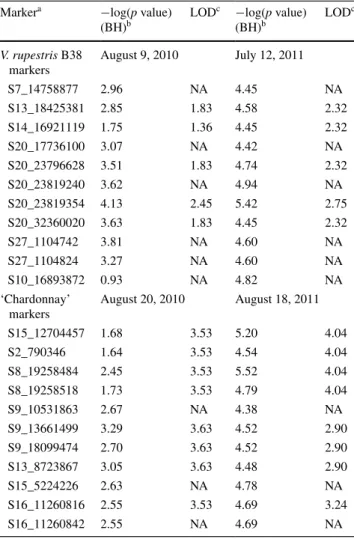
Using interval mapping, the susceptibility QTL from ‘Chardonnay’ was confirmed for two seasons (Fig. 5). For V. rupestris B38, markers with significant scores from the single marker association test also had the highest LOD scores in interval mapping, but did not exceed the signifi-cance threshold. A summary of p values and LOD scores for markers associated with the significant loci at each time point is shown in Table 4.
Discussion
In this work, we present the first application of GBS in a F1 family from two highly heterozygous grapevines. QTL analysis was performed in two stages: First, SNPs gener-ated by GBS were filtered based on their segregation ratio among the offspring and the percentage of missing data to develop a stringent set of 16,833 high quality SNPs dis-tributed evenly across the genome for which single marker
Table 3 Number of SNPs and total genetic distance (cM) of linkage groups (LG) in Vitis rupestris B38 and Vitis vinifera ‘Chardonnay’ maps
Linkage maps were constructed using Joinmap 4.1
LGa Vitis rupestris B38 Vitis vinifera ‘Chardonnay’
Number of SNPs Total genetic distance (cM) Number of SNPs Total genetic distance (cM) 1 44 116.5 49 95.3 2 39 89.2 48 89.9 3 41 64.7 52 80.9 4 64 74.1 14 62.5 5 65 70.9 79 118.4 6 60 76.8 61 92.8 7 70 84.3 67 154.4 8 73 84.5 96 135.5 9 72 91.0 77 94.3 10 47 60.1 55 109.9 11 51 71.6 37 135.0 12 68 96.3 79 124.1 13 96 94.0 88 108.9 14 70 114.0 91 97.4 15 54 112.6 62 76.6 16 68 77.9 71 101.5 17 44 65.6 31 54.7 18 53 109.3 88 158.2 19 67 91.9 70 76.8 Total 1,146 1,645.3 1,215 1,967.4
Fig. 5 Interval mapping of a QTL for powdery mildew susceptibil-ity on chromosome 9 in ‘Chardonnay’ on August 20, 2010 (a) and August 18, 2011 (b). Significance was calculated by permutation tests (10,000). X axis indicates SNP positions based on the link-age map. Significant markers S15_12704457, S2_790346, and
S8_19258518 are genetically redundant and map with significant marker S8_19258484 and marker S13_8723867 was genetically redundant and map with significant marker S9_13661499. Redundant markers do not appear in this figure
associations with PM severity could be tested. Later, link-age maps with 1,146 and 1,215 SNPs were generated for V. rupestris B38 and ‘Chardonnay’, respectively, and inter-val mapping was performed to corroborate association test results. Use of the single marker association test and interval mapping led to the identification of the first QTL for PM susceptibility in V. vinifera ‘Chardonnay’, located on chromosome 9. While single marker tests identified
SNPs associated with PM resistance from V. rupestris B38, interval mapping LOD scores were below the significance threshold. The results presented here justify naming the novel QTL from ‘Chardonnay’ Sen1 (Susceptibility to Ery-siphe necator 1).
SNP discovery, distribution and localization
One strategy to select SNPs that are useful molecular mark-ers is to determine the parental genotypes based on deep sequencing of their libraries (Davey et al. 2011) and then use this information to select SNPs that segregate at the expected ratio. As an alternative approach, we conducted shallow sequencing of parents and progeny and followed a strategy of selecting SNPs based on the segregation ratio among the progeny. In this work, we analyzed only biallelic SNPs with MAF of 0.25 (±0.05), as a strategy for a simple and rapid selection of reliable markers. As a consequence, several potentially informative SNPs were not considered, including biallelic SNPs with segregation distortion or that are heterozygous in both parents, and tri-allelic or quadra-allelic SNPs. The selection of the reference genome-based approach also limited the nature of the SNPs detected, as sequences from V. rupestris B38 with more than two poly-morphisms from the reference genome were discarded at the alignment step. We favored the use of the reference-based pipeline to include all progeny in the analysis, as the non-reference pipeline (Lu et al. 2013) requires deeper reads to obtain similar results. Moreover, because LD extends for long blocks of the genome in a F1 family, SNPs located in diverse regions that were excluded at the SNP calling stage could still be in linkage with nearby common regions.
Despite these constraints, the conservative selection strategy used here proved to be sufficient to give a robust set of 17K markers with good coverage of the V. vinifera ‘PN40024’ reference genome. The 17K SNP set was dis-tributed across the grapevine reference genome, covering the entire length of each chromosome, with an average density of 36 SNPs/Mbp (Fig. 3). Distribution analysis of the number of SNP markers located within 500 kb bins showed a pattern of continuous variation with some out-lier 500 kb bins with high numbers of SNPs and some 500 kb bins with few or no SNPs. Continuous distribu-tion of the counts indicated that the RRL created with the enzyme ApeKI succeeded in reducing the complexity of the genome without introducing a significant positional bias of the SNPs. Outlier 500 kb bins could be a minimal source of error and may be explained by several factors, includ-ing: errors in the physical map of the grapevine reference genome; differences between the reference genome and parental genomes; and local enrichment of repetitive DNA for which reads would have been discarded (Fig. 3).
Table 4 Summary statistics for selected markers at the four most sig-nificant field evaluation dates
A general lineal model was used to test for single marker associations with powdery mildew phenotype (−log(p value)) and interval QTL mapping was performed using the scanone function in R/QTL (LOD) a Marker name corresponds with chromosome location in the PN40024 reference genome. S20 markers have not been assigned to a chromosome, and S27 corresponds to unassembled portions of chro-mosome 7
b For single marker associations, the false discovery rate was con-trolled according to the Benjamini–Hochberg (BH) procedure c For interval QTL mapping, LOD was calculated using the Halley– Knott regression method. Significance thresholds (α = 0.05) were obtained by permutation tests (10,000) and correspond to 3.06, 3.04, 3.09 and 3.19 for PM evaluation on August 9 (2010), July 12 (2011), August 20 (2010) and August 18 (2011), respectively
Markera −log(p value)
(BH)b LOD c −log(p value) (BH)b LOD c V. rupestris B38 markers August 9, 2010 July 12, 2011 S7_14758877 2.96 NA 4.45 NA S13_18425381 2.85 1.83 4.58 2.32 S14_16921119 1.75 1.36 4.45 2.32 S20_17736100 3.07 NA 4.42 NA S20_23796628 3.51 1.83 4.74 2.32 S20_23819240 3.62 NA 4.94 NA S20_23819354 4.13 2.45 5.42 2.75 S20_32360020 3.63 1.83 4.45 2.32 S27_1104742 3.81 NA 4.60 NA S27_1104824 3.27 NA 4.60 NA S10_16893872 0.93 NA 4.82 NA ‘Chardonnay’ markers August 20, 2010 August 18, 2011 S15_12704457 1.68 3.53 5.20 4.04 S2_790346 1.64 3.53 4.54 4.04 S8_19258484 2.45 3.53 5.52 4.04 S8_19258518 1.73 3.53 4.79 4.04 S9_10531863 2.67 NA 4.38 NA S9_13661499 3.29 3.63 4.52 2.90 S9_18099474 2.70 3.63 4.52 2.90 S13_8723867 3.05 3.63 4.48 2.90 S15_5224226 2.63 NA 4.78 NA S16_11260816 2.55 3.53 4.69 3.24 S16_11260842 2.55 NA 4.69 NA
In this study, SNPs derived from NGS data were prone to errors associated with the complexity of the grape genome, reference genome errors or lack of representa-tion, the sequencing technology, and the characteristics of the GBS protocol. Thus, reliable markers had to be filtered from among the initial collection of SNPs. Pooling sam-ples in one sequencing lane lowers the read coverage for each SNP marker when compared with other genotyping strategies that use a single lane of NGS per sample (Myles et al. 2010), leading to an increase in the amount of miss-ing data. Successful application of GBS has been reported in homozygous lines of maize and barley (Elshire et al. 2011; Poland et al. 2012) but the implementation of this technique in the F1 progeny of two heterozygous parents required new approaches, as the error rate increases when heterozygous markers are miscalled as homozygous if only one allele has been sequenced.
Construction of linkage maps
Due to Joinmap 4.1 restrictions on the maximum number of markers that can be analyzed, the 17K SNP set was filtered using a selection criterion of MAF between 0.2 and 0.3. As a result, markers with segregation distortion were discarded from linkage analysis; hence, it is not possible to distinguish if regions with low numbers of markers were due to genomic diversity or segregation distortion. Despite the presence of a 32 cM gap in LG 1 of the V. rupestris B38 map, these maps represent an improvement over current grapevine link-age maps (Adam-Blondon et al. 2004; Doligez et al. 2006; Di Gaspero et al. 2007; Mahanil et al. 2011; Wang et al. 2012), with an average spacing between markers of 1.52 and 1.87 cM and average maximum spacing (per chromosome) of 11.0 and 12.2 cM for V. rupestris B38 and ‘Chardonnay’ maps, respectively. These results suggest possible chromo-some locations for contigs of the random chromochromo-some (here called 20) and unaligned portions of chromosome 7.
Single nucleotide polymorphisms obtained via the GBS approach showed the potential for high-throughput marker discovery and highlight the need for improvements in the creation of linkage maps, such as use of larger populations to resolve dense marker sets as well as better computational and statistical algorithms to phase, impute, order and genet-ically map larger sets of markers.
QTL for powdery mildew resistance
Quantitative trait loci were analyzed using two methods: Single marker association tests followed by LD analysis using the 17K SNP set, and interval mapping using parental linkage maps. In both methods, we found two loci associ-ated with PM resistance or susceptibility, but with differ-ent levels of significance (Table 4). The QTL Sen1, from
‘Chardonnay’, associated with susceptibility to PM, was confirmed by both methods.
For V. rupestris B38, the single marker association test resulted in 11 significant alleles (p value 0.047) associated with reduced PM severity. In interval mapping, LOD scores for this locus were below threshold (Table 4), which is not surprising since the corrected (BH) p values from the single marker association test were already just marginally lower than α = 0.05. It is possible that either the elimination of 10 individuals reduced the statistical power of the test, or removed spurious associations. No major genes for resist-ance were found in either of the analyses, consistent with the quantitative segregation patterns observed (Fig. 1). As a consequence, we hypothesize that V. rupestris B38 has a quantitative resistance to PM due the action of minor QTLs. The association of these minor loci with PM resist-ance needs to be confirmed with greater power and reso-lution. To this end, we are characterizing V. rupestris B38 resistance in additional F1 families.
In ‘Chardonnay’, the single marker association test revealed 10 markers linked to increased PM severity dur-ing one evaluation period (August 18, 2011) with estimated allele effects between 1.39 and 1.58. Only one minor allele in repulsion with the other 10 significant minor alleles from ‘Chardonnay’ (S15_12704457, Supplementary material S2) was associated with reduced PM severity, with an estimated effect of −1.43 evaluated early in the season, on July 12, 2011. Interval mapping confirmed this susceptibility QTL but now on two evaluation dates: August 20, 2010 and August 18, 2011.
The use of a GLM for single marker association tests allowed for rapid screening of a dense SNP dataset, without a requirement for linkage maps. This GLM approach is par-ticularly valuable as it can accommodate a larger number of markers than standard software used for linkage mapping. In the current study, many of the markers that significantly predicted powdery mildew severity would have been dis-carded by the filters we used to develop the genetic linkage map. Since we had already identified associated markers by GLM, we could add these back to the genetic linkage map to saturate the QTL regions. However, GLM should not be used alone, as it does not take into account popula-tion structure, or spurious individuals (e.g., pollen contam-ination or sample mix-up) that can have a large effect on the results. Therefore, interval mapping or a Mixed Linear Model needs to be used to confirm results.
Conflicts between reference genome alignment and genetic positions
Based on homology with the V. vinifera ‘PN40024’ ref-erence genome, significant markers obtained with a GLM were initially assigned to locations on different
chromosomes (Table 2). We used LD (D′) to resolve this
conflict and to assess the occurrence of major genome rear-rangements. Analysis of LD of each individual marker against the whole set of SNPs from their parents revealed linkage to chromosome 7 for 10 of 11 significant SNPs from V. rupestris B38, and to chromosome 9 for all sig-nificant SNPs from ‘Chardonnay’ (Fig. 4, Supplementary material S3). The genetic position of SNP S10_16893872 from V. rupestris B38 was not possible to establish due to lack of LD with any other marker. Whole genome LD anal-ysis for 3,502 SNPs from V. rupestris B38 and 4,631 SNPs from ‘Chardonnay’ confirmed overall linkage of mark-ers within chromosomes, with no major rearragments in their genomes. A few markers in conflict with their physi-cal alignment were observed in all chromosomes, indicat-ing that this phenomenon is not specific to QTL regions. This suggests either rare errors in the V. vinifera ‘PN40024’ genome, genetic diversity between Vitis cultivars or spe-cies, or errors at the alignment step. Misalignment within the grapevine reference genome has also been found in other mapping populations (Wang et al. 2012) and differ-ences within varieties of the same species has also been reported for other crops such as maize (Ganal et al. 2011).
In this work, we present a high-resolution SNP map for a biparental family derived from the cross of V. rupestris B38 and ‘Chardonnay’. Based on trait distribution, single marker association tests, and interval mapping, we found no evidence for qualitative inheritance of PM resistance, but we identified one moderate QTL for PM susceptibil-ity, Sen1 from ‘Chardonnay’, which constitutes a novel source of PM susceptibility as it is located on a chromo-some where no grapevine—PM interaction loci have been described previously. Higher statistical power would be needed to identify remaining QTLs with small effects.
These results present new tools for grapevine MAS. A high-resolution SNP set and dense linkage maps across the entire grapevine genome could be useful for retaining the V. vinifera background during the introgression of traits from non-cultivated relatives. In addition, GBS proved to be a useful method for high-throughput genotyping in het-erozygous hybrid crosses, and its application in MAS could allow simultaneously genotyping of major, moderate or minor effect QTLs, such as Sen1 presented here, to develop long-lasting PM tolerance.
Acknowledgments We thank Edward Buckler and Qi Sun for sup-port with GBS procedures and genetic analysis; Alex Lipka for statis-tical advice; and Laura Shannon for her help in R/QTL use and link-age map construction. This research was supported by BecasChile, the USDA Viticulture Consortium—East, the New York Wine & Grape Foundation, and the Lake Erie Regional Grape Processors Fund. Par-tial funding was also provided by a USDA-National Institute of Food and Agriculture—Specialty Crop Research Initiative Competitive Grant, Award No. 2011-51181-30635.
References
Adam-Blondon AF, Roux C, Claux D, Butterlin G, Merdinoglu D, This P (2004) Mapping 245 SSR markers on the Vitis
vin-ifera genome: a tool for grape genetics. Theor Appl Genet 109(5):1017–1027
Alleweldt G, Spiegel-Roy P, Reisch B (1991) Grapes (Vitis). In: vol 290. Acta Hort (ISHS), pp 291–330
Barbazuk WB, Bedell JA, Rabinowicz PD (2005) Reduced represen-tation sequencing: a success in maize and a promise for other plant genomes. Bioessays 27(8):839–848
Boubals D (1961) Étude des causes de la résistance des Vitacées à l’Oïdium de la vigne (Uncinula necator (Schw.) Burr.) et de leur mode de transmission héréditaire. Ann Amélior Plant 11:401–500 Bradbury PJ, Zhang Z, Kroon DE, Casstevens TM, Ramdoss Y, Buck-ler ES (2007) TASSEL: software for association mapping of com-plex traits in diverse samples. Bioinformatics 23(19):2633–2635 Broman KW, Wu H, Sen S, Churchill GA (2003) R/qtl: QTL mapping
in experimental crosses. Bioinformatics 19:889–890
Cadle-Davidson L, Mahanil S, Gadoury DM, Kozma P, Reisch BI (2011) Natural infection of Run1-positive vines by naïve geno-types of Erysiphe necator. Vitis 50:173–175
Coleman C, Copetti D, Cipriani G, Hoffman S, Kozman P, Kovacs L, Morgante M, Testolin R, Di Gaspero G (2009) The powdery mildew resistance gene REN1 co-segregates with an NBS-LRR gene cluster in two Central Asian grapevines. BMC Genet. 10. doi:10.1186/1471-2156-10-89
Dalbó MA, Ye GN, Weeden NF, Wilcox WF, Reisch BI (2001) Marker-assisted selection for powdery mildew resistance in grapes. J Am Soc Hortic Sci 126(1):83–89
Davey JW, Hohenlohe PA, Etter PD, Boone JQ, Catchen JM, Blax-ter ML (2011) Genome-wide genetic marker discovery and genotyping using next-generation sequencing. Nat Rev Genet 12(7):499–510
Deulvot C, Charrel H, Marty A, Jacquin F, Donnadieu C, Lejeune-Henaut I, Burstin J, Aubert G (2010) Highly-multiplexed SNP genotyping for genetic mapping and germplasm diversity studies in pea. BMC Genomics 11:468
Di Gaspero G, Cattonaro F (2009) Application of genomics to grape-vine improvement. Aust J Grape Wine Res 16:122–130
Di Gaspero G, Cipriani G, Adam-Blondon AF, Testolin R (2007) Linkage maps of grapevine displaying the chromosomal locations of 420 microsatellite markers and 82 markers for R-gene candi-dates. Theor Appl Genet 114(7):1249–1263
Doligez A, Adam-Blondon A, Cipriani G, Di Gaspero G, Laucou V, Merdinoglu D, Meredith C, Riaz S, Roux C, This P (2006) An integrated SSR map of grapevine based on five mapping popula-tions. Theor Appl Genet 113(3):369–382
Eibach R, Zyprian E, Welter LJ, Topfer R (2007) The use of molecu-lar markers for pyramiding resistance genes in grapevine breed-ing. Vitis 46(3):120–125
Elshire R, Glaubitz J, Sun Q, Poland J, Kawamoto K, Buckler E, Mitchell S (2011) A robust, simple genotyping-by-sequenc-ing (GBS) approach for high diversity species. PLoS ONE. doi:10.1371/journal.pone.0019379
Feechan A, Kabbara S, Dry IB (2010) Mechanisms of powdery mildew resistance in the Vitaceae family. Mol Plant Path doi. doi:10.1111/j.1364-3703.2010.00668.x
Ganal MW, Durstewitz G, Polley A, Bérard A, Buckler ES, Char-cosset A, Clarke JD, Graner E-M, Hansen M, Joets J, Le Paslier M-C, McMullen MD, Montalent P, Rose M, Schön C-C, Sun Q, Walter H, Martin OC, Falque M (2011) A large maize (Zea mays L.) SNP genotyping array: Development and germplasm geno-typing, and genetic mapping to compare with the B73 reference genome. PLoS ONE. doi:10.1371/journal.pone.0028334
Glaubitz J, Casstevens T, Elshire R, Harriman J, Casstevens T (2012) TASSEL 3.0 genotyping by sequencing (GBS) pipeline docu-mentation. http://www.maizegenetics.net/tassel/docs/TasselPipeli neGBS.pdf. Accessed 23 November 2012
IPGRI, UPOV, OIV (1997) Descriptors for grapevine (Vitis spp.). International Union for the Protection of New Varieties of Plants, Geneva, Switzerland/Office International de la Vigne et du Vin, Paris, France/International Plant Genetic Resources Institute, Rome, Italy
Jaillon O, Aury J-M, Noel B, Policriti A, Clepet C, Casagrande A, Choisne N, Aubourg S, Vitulo N, Jubin C, Vezzi A, Legeai F, Hugueney P, Dasilva C, Horner D, Mica E, Jublot D, Poulain J, Bruyère C, Billault A, Segurens B, Gouyvenoux M, Ugarte E, Cattonaro F, Anthouard V, Vico V, Fabbro CD, Alaux M, Gasp-ero GD, Dumas V, Felice N, Paillard S, Juman I, Moroldo M, Scalabrin S, Canaguier A, Clainche IL, Malacrida G, Durand E, Pesole G, Laucou V, Chatelet P, Merdinoglu D, Delledonne M, Pezzotti M, Lecharny A, Scarpelli C, Artiguenave F, Pè ME, Valle G, Morgante M, Caboche M, Adam-Blondon A-F, Weissenbach J, Quétier F, Wincker P (2007) The grapevine genome sequence suggests ancestral hexaploidization in major angiosperm phyla. Nature 449(7161):463–467
Jones JDG, Dangl JL (2006) The plant immune system. Nature 444(7117):323–329
Li H, Durbin R (2009) Fast and accurate short read alignment with Burrows–Wheeler transform. Bioinformatics 25(14):1754–1760 Lu F, Lipka AE, Glaubitz J, Elshire R, Cherney JH, Casler MD,
Buck-ler ES, Costish DE (2013) Switchgrass genomic diversity, ploidy, and evolution: novel insights from a network-based SNP discov-ery protocol. PLoS Genet 9(1):e1003215
Mahanil S, Ramming DW, Cadle-Davidson M, Owens CL, Garris A, Myles S, Cadle-Davidson L (2011) Development of marker sets useful in the early selection of Ren4 powdery mildew resistance and seedlessness for table and raisin grape breeding. Theor Appl Genet. doi:10.1007/s00122-011-1684-7
Moroldo M, Paillard S, Marconi R, Fabrice L, Canaguier A, Cru-aud C, De Berardinis V, Guichard C, BrunCru-aud V, Le Clainche I, Scalabrin S, Testolin R, Di Gaspero G, Morgante M, Adam-Blondon A (2008) A physical map of the heterozygous grapevine ‘Cabernet Sauvignon’ allows mapping candidate genes for dis-ease resistance. BMC Plant Biol. doi:10.1186/1471-2229-8-66
Morrell PL, Buckler ES, Ross-Ibarra J (2012) Crop genomics: advances and applications. Nat Rev Genet 13(2):85–96
Myles S, Chia J-M, Hurwitz B, Simon C, Zhong GY, Buckler E, Ware D (2010) Rapid genomic characterization of the genus Vitis. PLoS ONE. e8219. doi:10.1371/journal.pone.0008219
Myles S, Boyko AR, Owens CL, Brown PJ, Grassi F, Aradhya MK, Prins B, Reynolds A, Chia J-M, Ware D, Bustamante CD, Buck-ler ES (2011) Genetic structure and domestication history of the grape. Proc Natl Acad Sci USA 108(9):3530–3535
Nielsen R, Paul JS, Albrechtsen A, Song YS (2011) Genotype and SNP calling from next-generation sequencing data. Nat Rev Genet 12(6):443–451
Pearson R (1988) Compendium of grape diseases. American Phyto-pathological Society (APS), Minnesota
Peressotti E, Wiedemann-Merdinoglu S, Delmotte F, Bellin D, Di Gaspero G, Testolin R, Merdinoglu D, Mestre P (2010) Breakdown of resistance to grapevine downy mildew upon
limited deployment of a resistant variety. BMC Plant Biol. doi:10.1186/1471-2229-10-147
Poland JA, Balint-Kurti PJ, Wisser RJ, Pratt RC, Nelson RJ (2009) Shades of gray: the world of quantitative disease resistance. Trends Plant Sci 14(1):21–29
Poland JA, Brown PJ, Sorrells ME, Jannink J-L (2012) Development of high-density genetic maps for barley and wheat using a novel two-enzyme genotyping-by-sequencing approach. PLoS ONE. doi:10.1371/journal.pone.0032253
Pollard KS, Gilbert HN, Ge Y, Taylor S, Dudoit (2004) S multtest: resampling-based multiple hypothesis testing. R package version 2.12.0
Riaz S, Dangl GS, Edwards KJ, Meredith CP (2004) A microsatellite marker based framework linkage map of Vitis vinifera L. Theor Appl Genet 108(5):864–872
Troggio M, Malacarne G, Coppola G, Segala C, Cartwright DA, Pindo M, Stefanini M, Mank R, Moroldo M, Morgante M, Grando MS, Velasco R (2007) A dense single-nucleotide poly-morphism-based genetic linkage map of grapevine (Vitis vinifera L.) anchoring Pinot Noir Bacterial Artificial Chromosome con-tigs. Genetics 176(4):2637–2650
Van Ooijen JW (2006). JoinMap® 4, Software for the calculation of genetic linkage maps in experimental populations. Kyazma, Wageningen, The Netherlands
Van Tassell CP, Smith TPL, Matukumalli LK, Taylor JF, Schnabel RD, Lawley CT, Haudenschild CD, Moore SS, Warren WC, Son-stegard TS (2008) SNP discovery and allele frequency estimation by deep sequencing of reduced representation libraries. Nat Meth 5(3):247–252
Velasco R, Zharkikh A, Troggio M, Cartwright DA, Cestaro A, Pruss D, Pindo M, FitzGerald LM, Vezzulli S, Reid J, Malacarne G, Iliev D, Coppola G, Wardell B, Micheletti D, Macalma T, Facci M, Mitchell JT, Perazzolli M, Eldredge G, Gatto P, Oyzerski R, Moretto M, Gutin N, Stefanini M, Chen Y, Segala C, Davenport C, Demattè L, Mraz A, Battilana J, Stormo K, Costa F, Tao Q, Si-Ammour A, Harkins T, Lackey A, Perbost C, Taillon B, Stella A, Solovyev V, Fawcett JA, Sterck L, Vandepoele K, Grando SM, Toppo S, Moser C, Lanchbury J, Bogden R, Skolnick M, Sgara-mella V, Bhatnagar SK, Fontana P, Gutin A, Van de Peer Y, Sala-mini F, Viola R (2007) A high quality draft consensus sequence of the genome of a heterozygous grapevine variety. PLoS ONE. doi:10.1371/journal.pone.0001326
Wang N, Fang L, Xin H, Wang L, Li S (2012) Construction of a high-density genetic map for grape using next generation restriction-site associated DNA sequencing. BMC Plant Biol. doi:10.1186/1471-2229-12-148
Ward JA, Bhangoo J, Fernández-Fernández F, Moore P, Swanson JD, Viola R., Velasco R, Bassil N, Weber CA, Sargent DJ (2013) Saturated linkage map construction in Rubus idaeus using geno-typing by sequencing and genome-independent imputation. BMC Genomics. doi:10.1186/1471-2164-14-2
Wiedmann R, Smith T, Nonneman D (2008) SNP discovery in swine by reduced representation and high throughput pyrosequencing. BMC Genet. doi:10.1186/1471-2156-9-81
Xie W, Feng Q, Yu H, Huang X, Zhao Q, Xing Y, Yu S, Han B, Zhang Q (2010) Parent-independent genotyping for constructing an ultrahigh-density linkage map based on population sequencing. Proc Natl Acad Sci USA. doi:10.1073/pnas.1005931107