HAL Id: hal-02911976
https://hal.archives-ouvertes.fr/hal-02911976
Submitted on 5 Aug 2020HAL is a multi-disciplinary open access
archive for the deposit and dissemination of sci-entific research documents, whether they are pub-lished or not. The documents may come from teaching and research institutions in France or abroad, or from public or private research centers.
L’archive ouverte pluridisciplinaire HAL, est destinée au dépôt et à la diffusion de documents scientifiques de niveau recherche, publiés ou non, émanant des établissements d’enseignement et de recherche français ou étrangers, des laboratoires publics ou privés.
Seismic coupling quantified on inferred décollements
beneath the western syntaxis of the Himalaya
Jouanne François, Naveed Munawar, Jean-Louis Mugnier, Awais Ahmed,
Adnan Awan, Pascale Bascou, Riccardo Vassallo
To cite this version:
Jouanne François, Naveed Munawar, Jean-Louis Mugnier, Awais Ahmed, Adnan Awan, et al.. Seismic coupling quantified on inferred décollements beneath the western syntaxis of the Himalaya. Tectonics, American Geophysical Union (AGU), In press. �hal-02911976�
Seismic coupling quantified on inferred décollements beneath the
1
western syntaxis of the Himalaya
2 3
François Jouanne (1), Naveed Munawar (2), Jean-Louis Mugnier (1), Awais Ahmed (2), Adnan 4
Alam Awan (2), Pascale Bascou (1), Riccardo Vassallo (1). 5
6 7
(1) Université Grenoble Alpes, Université de Savoie-Mont-Blanc, CNRS, IRD, IFFSTAR, 8
ISTerre F- 8 38041 Grenoble, France. 9
(2) Geoscience Advance Research Laboratories, Geological Survey of Pakistan, National 10
Park Road, Chak Shahzad, Islamabad, Pakistan. 11
12
François Jouanne, Université Grenoble Alpes, Université de Savoie-Mont-Blanc, CNRS, IRD, 13
IFFSTAR, ISTerre F- 8 38041 Grenoble, France. [email protected] 14
15
Naveed Munawar, Geoscience Advance Research Laboratories, Geological Survey of 16
Pakistan, National Park Road, Chak Shahzad, Islamabad, Pakistan. [email protected] 17
18
Jean-Louis Mugnier, Université Grenoble Alpes, Université de Savoie-Mont-Blanc, CNRS, 19
IRD, IFFSTAR, ISTerre F- 8 38041 Grenoble, France. [email protected] 20
21
Awais Ahmed Geoscience Advance Research Laboratories, Geological Survey of Pakistan, 22
National Park Road, Chak Shahzad, Islamabad, [email protected] 23
24
Adnan Alam Awan, Geological Survey of Pakistan, Sariab Road, Quetta, 25
Pakistan. [email protected] 26
27
Pascale Bascou, Université Grenoble Alpes, Université de Savoie-Mont-Blanc, CNRS, IRD, 28
IFFSTAR, ISTerre F- 8 38041 Grenoble, [email protected] 29
30
Riccardo Vassallo, Université Grenoble Alpes, Université de Savoie-Mont-Blanc, CNRS, IRD, 31
IFFSTAR, ISTerre F- 8 38041 Grenoble, France. [email protected] 32
33
Key points : interseismic deformation, Main Himalayen Thrust, GNSS
34 35
Abstract 36
We used episodic GNSS measurements to quantify the present-day velocity field in the 37
northwestern Himalaya from the Himalayan foreland to the Karakoram Range. We report a 38
progressive N-S compressional velocity gradient with two noticeable exceptions: in the Salt 39
Range, where important southward velocities are recorded, and in Nanga Parbat, where an 40
asymmetrical E-W velocity gradient is recorded. A review of Quaternary slip along active 41
thrusts both in and out of sequence allows us to propose a 14 mm/year shortening rate. This 42
constraint, together with a geometrical model of the MHT, allows us to propose estimations of 43
the slip distributions along the active faults. The lower flat of the MHT is characterized by 44
ductile slip, whereas the coupling increases along the crustal ramp and along the upper flat of 45
the MHT. The basal thrust of the Potwar Plateau and Salt Range presents weak coupling, which 46
is interpreted as the existence of a massive salt layer forming an excellent décollement. In the 47
central part of the frontal Salt Range, the velocities suggest the existence of a southward 48
horizontal flux in the massive salt layer. The simulations also suggest that the velocities 49
recorded in Nanga Parbat can be explained by active westward thrusting along the fault that 50
borders the massif to the west. Simulations suggest that the slip along this fault evolves with 51
depth from 5 mm/year ductile slip near the MHT to no slip along the upper part of the fault. 52
1. Introduction 53
The current deformation of the northwestern Himalaya appears distinctive compared to the 54
deformation of the central Himalayas in several aspects: (1) the presence of the Potwar Plateau 55
and the Salt Range, which are controlled by an excellent detachment level, (2) significant out-56
of-sequence deformation along the Balakot-Bagh or Riasi faults, and (3) the existence of the 57
Nanga Parbat massif, interpreted as a crustal anticline and a crustal diapir (Khan et al., 2000; 58
Sana, and Nath, 2016). To study the ongoing deformation in the northwestern Himalaya, we 59
deployed a GPS network in northern Pakistan from the stable foreland south of the Salt Range 60
to the Pakistan-China border. This network, measured in 2005, 2006, 2007, 2009, 2011-2012 61
and 2018-2019, made it possible to measure the velocity field and illustrate the interseismic and 62
local postseismic deformation following the Balakot-Bagh earthquake in 2005. In this paper, 63
we will go beyond the postseismic deformation to study, in detail, the interseismic deformation 64
and coupling along the Main Himalayan Thrust. In this study, in addition to the velocities 65
obtained from our network, we reanalyzed the available GPS data and included the published 66
velocities for the Pir Panjal Range, Kashmir Valley and Ladakh. 67
68
Geological setting: geometry and quaternary slip rates of active faults in the 69
northwestern Himalaya. 70
71
The present-day structure of the Himalayas is characterized by the underthrusting of the 72
Indian lithosphere beneath the mountain chain along the Main Himalayan Thrust (MHT) (Zhao 73
et al. 1993). This mountain chain absorbs approximately 14 to 21 mm yr−1 convergence, which 74
is half of the convergence between India and Eurasia estimated by DeMets et al. (1994), 75
depending on the location along the Himalayan arc. Large earthquakes of magnitude >8 affect 76
the MHT and have episodically ruptured segments several hundred kilometers long. In the 77
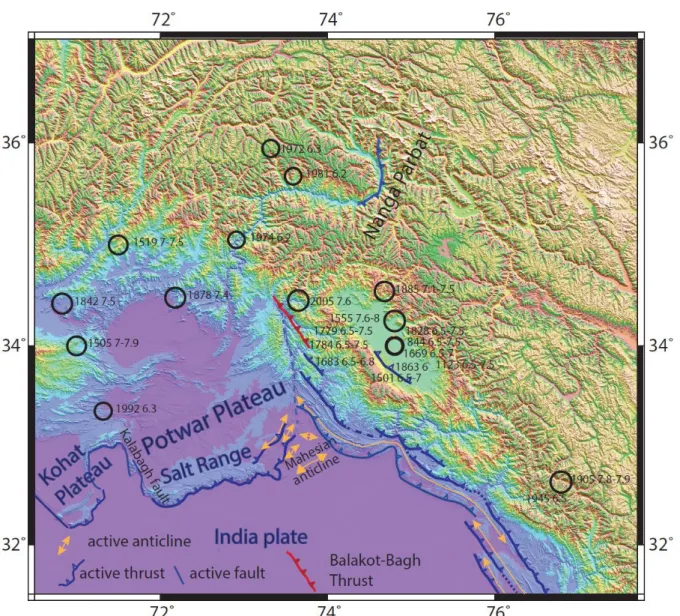
western Himalaya, historical earthquakes (Bilham, 2019) and instrumental seismicity (Figs. 1 78
& 2) highlight the existence of a major seismic gap between the 2005 Balakot-Bagh earthquake 79
and the 1905 Kangra earthquake (Fig. 1) and imply the existence of out-of-sequence 80
deformation (the 2005 Mw 7.6 Balakot-Bagh earthquake), given that the thrust activated during 81
this earthquake is located 100 km north of the MFT. 82
The structure of the western Himalaya also presents some particularities: (1) a frontal thrust 83
(MFT) localized further south than in the rest of the Himalayas (Potwar Plateau and Salt Range), 84
conditioned by the existence of a massive salt layer forming a particularly effective detachment 85
plane, (2) a marked change in the structural direction from N80°W to N160-170°E (Figs. 1, 2, 86
& 3), and (3) a crustal fold or diapir, the Nanga Parbat (Seeber and Armbruster., 1981; Seeber 87
and Pêcher, 1998; Butler, 2018). 88
89
Potwar Plateau and Salt Range décollement
90 91
The northwestern Himalaya (Fig. 1) is characterized by regional-scale plateaus that mainly slip 92
aseismically, as suggested by the lack of historical high-magnitude earthquakes (Fig. 2) in this 93
area (Bilham et al., 2019). The largest of these plateaus is the Potwar Plateau, currently moving 94
southwards above a late Precambrian-Early Cambrian salt layer that locally defines the MHT. 95
Since 2 Ma, the propagation to the south of the MHT has reached this salt layer, which has 96
enabled the Potwar Plateau to slip without frictional deformation. As a consequence, the 97
emergence of the MHT along the Salt Range Thrust, the local expression of the Main Frontal 98
Thrust, occurs to the south of this position in the Kashmir Himalaya, just east of the Potwar 99
Plateau. On a geological time scale, the Potwar Plateau moves without internal deformation at 100
6 to 10.2 mm/year (Pennock et al., 1989; McDougall and Khan, 1990; McDougall et al., 1993; 101
Grelaud et al., 2002; Mugnier et al., 2008, Cortes et al., 2017). 102
103
Main Frontal Thrust
104
To the east of the Salt Range, the frontal thrust is blind but marked by a well-expressed 105
frontal anticline. The analysis of seismic profiles through this structure shows that the Main 106
Frontal Thrust connects to the MHT at depths of 8-10 km. A thrust slip rate of 9+/- 3 mm/year 107
has been estimated from an analysis of the deformed terraces carried by this frontal anticline 108
(Vassallo et al., 2015). 109
110
Sinistral Jhelum strike-slip fault
111
The sinistral Jhelum strike-slip fault divides the region to the east with a structural 112
orientation of N130° from the region to the west characterized by east-west-trending structures 113
(Fig. 1). The continuity of this fault to the south means that it also forms the eastern boundary 114
of the Potwar Plateau and Salt Range. This strike-slip fault delineates a domain characterized 115
by an important deposit of salt during the Precambrian that led to the development of the Potwar 116
Plateau and Salt Range and hence can be interpreted as a transfer fault between two domains 117
with different distributions of deformation and tectonic styles. 118
Balakot–Bagh thrust and out-of-sequence thrusts
119
The Balakot–Bagh thrust is an active out-of-sequence thrust located 100 km north of the 120
MFT, as shown by the occurrence of the Mw 7.6 8 October 2005 earthquake and its aftershocks 121
(Bendick et al., 2007) (Fig. 3). The rupture of the 2005 earthquake affected a crustal ramp from 122
its junction with the MHT at depth to the surface, as shown by studies of pixel displacements 123
(Avouac et al., 2006; Yann et al., 2013). The postseismic deformation induced by this 124
earthquake has been characterized bymoderate afterslip occurring along the crustal ramp 125
extending downdip from the rupture (Jouanne et al., 2011; Wang and Fialko, 2014). Trenching 126
through the Balakot-Bagh thrust (Kondo et al., 2008) has documented the existence of large 127
earthquakes along this fault. The coseismic slip of the 8 October 2005 earthquake and the dating 128
of the previous event suggest that the Balakot-Bagh thrust absorbs ~3 mm/year of shortening. 129
This out-of-sequence thrust system continues eastward as the Medlicott-Wadia Thrust 130
(MWT) (Thakur et al., 2010), located 20 km north of the frontal thrust. Morphotectonic analyses 131
of the terraces deformed by thrusting (Vassallo et al., 2015; Vignon et al., 2016; Mugnier et al., 132
2017) have allowed the mean slip to be estimated at the Quaternary scale. Previous studies 133
estimate that the MWT experiences localized deformation of 10 mm/year, while the frontal 134
thrust absorbs shortening of 9+/- 3 mm/year (Vassallo et al., 2015). 135
136
Liachar brittle-ductile shear zone or Raikot-Liachar fault
137
The Liachar brittle-ductile shear zone (Butler & Prior, 1988; Butler, 2018), also known as the 138
Raikot-Liachar fault (Madin et al., 1989), bounds the Nanga Parbat massif to the west with 139
right-lateral strike and thrust components. The microseismicity associated with this fault makes 140
it possible to determine a dip of 60° to the east. However, the lack of seismicity below 5 km 141
suggests that the brittle-ductile boundary is situated at this depth (Meltzer et al. 2001). 142
Mukhopadhyay et al. 2011 proposed right-lateral focal mechanisms along the western boundary 143
of the Nanga Parbat Massif and normal faulting in the central part of the massif. 144
145
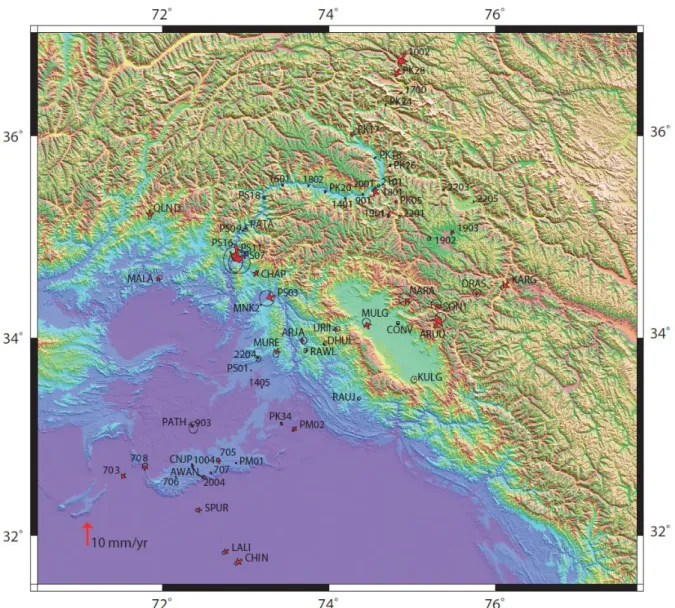
2. Data acquisition and analysis 146
After the installation of a GNSS network dedicated to the quantification of postseismic 147
deformation following the 8 October 2005 Kashmir earthquake (Jouanne et al., 2011), our 148
preliminary GPS network was supplemented with points from the Karakoram Range to the 149
Himalayan foreland south of the Salt Range and with points on either side of Nanga Parbat (Fig. 150
3). The remaining points of this large network were measured from October 2011 to February 151
2012 and again from October 2018 to February 2019 (Fig. 3 & Table 1). To complete this data 152
set, available GPS data from UNAVCO measured between 2001 and 2010 (Khan et al., 2008; 153
Ischuk et al. 2013) were also analyzed. 154
We analyzed data from episodic and permanent GNSS stations together with continuous 155
GNSS network data from the GNSS sites defined in the ITRF2014 reference frame (ARTU, 156
BADG, BAKU, BJFS, BJNM, CHUM, CUSV, GUAO, HYDE, IISC, IRKJ, IRKM, KIT3, 157
KUWT, LHAZ, MDVJ, POL2, SGOC, SHAO, TALA, TASH, TCMS, TEHN, TNML, URUM, 158
ZECK). Data were analyzed using Bernese 5.2 software (Dach et al., 2015) with absolute 159
antenna phase center offset models in conjunction with precise orbits, Earth rotation parameters, 160
and ocean tidal loading and atmospheric tidal loading estimates. Velocities and time series were 161
estimated in the ITRF2014 reference frame (Altamimi et al., 2016) with discontinuities 162
associate with this reference frame and expressed in terms of India
-
fixed reference frame (Fig. 1633) by using the ITRF2014/India plate rotation pole proposed by Altamimi et al., 2017 (Table 164
2). To complete the data set in the Jammu-Kashmir area, we included data published by Kundu 165
et al. 2014. 166
167
3. Results: Interseismic displacements at the surface 168
169
Throughout the rest of the Himalayas, during an interseismic period, the decollement is 170
clearly locked to the Indian plate for 80% of its width along the Himalaya (Ader et al., 2012; Berger 171
et al., 2003; Bettinelli et al., 2006; Jouanne et al., 1999; Jouanne et al., 2004; Kundu et al., 2014; 172
Marechal et al. 2016, Stevens & Avouac, 2015; Jouanne et al., 2017, Dumka, 2018) whereas the 173
Potwar and Kohat plateaus (Figs. 3 & 4) are creeping above a lubricated decollement to within 5 km 174
of their frontal thrusts (Kahn et al 2011, Satyabala et al 2012). 175
By expressing the velocity field in the Nanga Parbat region with respect to a point to the 176
west in the Kohistan Plateau (Fig. 5), the points located in Nanga Parbat have westward 177
velocities reaching several millimeters per year with a very pronounced gradient. These 178
observations suggest the existence of an active thrust within the Nanga Parbat Massif on the 179
Kohistan Plateau along an inverted fault plunging eastward with a rather superficial locking 180
depth. This inference is consistent with the distribution of microseismicity, few events of which 181
occur at depth larger than 10 km; in addition, microseismicity tends to swarm along the Raikot-182
Liachar fault, an active fault that borders Nanga Parbat to the west (Meltzer et al. 2001). The 183
velocity field is clearly not compatible with a symmetrical crustal diapir being deformed but 184
corresponds instead to deformation along an inverted fault that would allow such a crustal diapir 185
to flow westward. 186
187
2. Modeling interseismic displacements 188
189
Modeling the slip distributions along active faults requires knowledge of their geometries and, 190
if possible, estimates of their maximum slip rates to add constraints during the inversion. The 191
geometries of these faults can be known from geological sections; in the case of the MHT, its 192
geometry can be inferred from the existence of a low-velocity zone that seems to be associated 193
with this fault throughout the Himalayan arc. The maximum slip can be estimated from 194
Quaternary slip rates along active faults while assuming that these slip rates reflect ductile slip 195
rates along the deep parts of the faults. 196
197
Main Himalayan Thrust Geometry and Quaternary slip along the MHT.
198
The geometry of the Main Himalayan Thrust is, in conjunction with GNSS velocity 199
measurements, key to estimating the locking of slip along the MHT and the detection of possible 200
asperities. The MHT seems to be associated throughout the Himalayan arc with an area of low 201
seismic wave velocities as revealed by receiver function analysis (Duputel et al., 2016). 202
Recently published velocity profiles in the western Himalaya therefore make it possible to 203
specify the major characteristics of this geometry. For northwestern Pakistan, Priestley et al, 204
2018 show a geometry for the MHT characterized by a long flat to the south with a northward 205
dip of 3° at a depth of 10-12 km followed by a crustal ramp with a dip of approximately 15° 206
below the greater Himalayas (Fig. 6). These characteristics of thick-skinned tectonism are also 207
identified in the Jammu-Kashmir Himalaya, where the low-velocity zone associated with the 208
MHT is found at depths of 12-16 km (Mir et al., 2017) below the Kashmir Valley, which is in 209
accordance with cross sections constructed for this area (Vassallo et al., 2015). The MHT would 210
present as a crustal ramp to the north of the Kashmir Basin, where the Greater Himalaya region 211
begins. East of the Kashmir Basin, microseismicity and source mechanisms (Paul et al., 2018) 212
confirm this geometry with an MHT plunging northward by a few degrees to depths of 10-15 213
km.North of this crustal ramp, the MHT is probably flat with a plunge of a few degrees to the 214
north (Fig. 6), as has been proposed for the Garhwal Himalaya (Pristley et al., 2018) or 215
determined for the Nepal Himalaya (Berger et al., 2003; Jouanne et al., 2017). We suppose that 216
the active out-of-sequence thrusts, the Balakot-Bagh thrust affected by the 8 October 2005 217
earthquake (Avouac et al., 2006; Pathier et al., 2006; Yan et al., 2013) and the Riasi fault or 218
active Main Wadia Thrust (Vassallo et al., 2015; Vignon et al., 2016) are connected along the 219
southern and upper flat of the MHT. 220
In the western extent of the study area, below the Potwar Plateau and Salt Range, the MHT is 221
a decollement plane formed by a massive Precambrian salt layer (Butler et al., 1987; Jaume & 222
Lillie, 1988). Seismic profiles and balanced cross sections (Pennock et al., 1989; Grelaud et al., 223
2002) allow us to characterize this part of the MHT as a decollement plane with a northward 3-224
5° dip reaching the surface in the Salt Range. The dextral strike-slip Kalabagh fault forms the 225
western boundary of the Salt Range (Mcdougall & Khan, 1990; Chen & Khan, 2010; Khan et 226
al., 2012). 227
We propose that these data be taken into account to consider an MHT geometry characterized 228
by an upper flat with an upper boundary at a depth of 10 km, followed by a crustal ramp below 229
the Higher Himalaya that is connected to a lower flat. This flat thrust follows the structural 230
trend of the western Himalaya, as shown in Figure 1, which implies a drastic change in 231
structural orientation between the Salt Range, where the faults and folds are oriented N80°, and 232
the Jammu-Kashmir Himalaya, where the faults and folds are oriented N160-170° (Figs. 1, 2, 233
3 & 6). In the Salt Range and Potwar Plateau, the MHT extends southward; we have represented 234
this part of the MHT as a plane reaching the surface that is connected at a depth of 10 km with 235
the MHT north of the Potwar Plateau (Fig. 6). 236
237
Then, the slip along the MHT can be estimated as the sum of the slip along the Main Frontal 238
Thrust (MHT near the surface) and of the slips along the out-of-sequence thrusts. 239
In the western part of the study area, the geological slip rate along the Salt Range (Fig. 1) can 240
be estimated as being equal to the slip rate along the Kalabagh fault estimated at 7–10 mm/yr 241
since 2 Ma (McDougall and Khan, 1990). Nevertheless, the observation of normal faults above 242
the décollement may suggest that a part of the displacement along the décollement of the Salt 243
Range may be due to this N-S extension (Butler et al., 1987). At a distance of 170 km north of 244
the Salt Range Thrust, the out-of-sequence Balakot-Bagh Thrust experienced a Mw 7.6 245
earthquake on 8 October 2005 (Kaneda et al., 2008) with coseismic slip localized along a crustal 246
ramp dipping 30° between a depth of 15 km and the surface (Avouac et al., 2006; Pathier et al., 247
2006; Yan et al., 2013). Trenching through the Balakot-Bagh thrust (Kondo et al., 2008) has 248
documented the occurrence of past large-scale earthquakes along this thrust. The coseismic slip 249
of the 8 October 2005 earthquake and the dating of the previous event suggest that the Balakot-250
Bagh thrust absorbs ~3 mm/year of shortening. Accordingly, we can estimate the slip along the 251
MHT to be 10 to 13 mm/year in the western part of the study area. 252
In the central part of the study area, at the junction between the Salt Range and the Jammu-253
Kashmir Himalaya, the analysis of deformed Quaternary terraces above the Mahesian anticline 254
(Figs. 1, 2, & 3) and their dating results allow us to estimate a Quaternary uplift rate of 10.2+/-255
1.5 mm/year for the central part of this uplifted anticline (Cortés-Aranda et al., 2017). This 256
uplift rate and geometry enable us to propose a shortening rate exceeding 10 mm/year across 257
this fold for the Holocene. We can then estimate the Holocene slip rate along the MHT as the 258
sum of this shortening rate and of the 3 mm/year shortening rate along the Balakot-Bagh Thrust. 259
In the eastern part of the study area, in the Jammu-Kashmir Himalaya (Figs. 1 & 2), the recent 260
activity along the Medlicott-Wadia Thrust (MWT) has been investigated from geomorphic and 261
tectonic perspectives (Vassallo et al., 2015; Vignon et al., 2016; Mugnier et al, 2017) and 262
estimated at nearly 7.3 mm/yr (Mugnier et al, 2017). Accordingly, the analysis of the dated 263
deformed terraces located on the frontal anticline carried by a blind thrust allows us to estimate 264
a 9 +/- 3 mm/year shortening rate across this frontal fold (Vassallo et al. 2015). 265
If we consider these three estimations of the Quaternary slip rate along the MHT, we can adopt 266
a value of ~14 mm/year. We can further assume that the Quaternary slip rate along the MHT 267
and the ductile slip rate along the deeper part of the MHT are equivalent; we will then consider 268
this value, 14 mm/year, both as the maximal slip along the MHT during the velocity inversion 269
to determine the locking of slip and as the reference value to compute the coupling coefficient. 270
This maximum slip is also close to the estimate of 13 mm/year by Jouanne et al. in 2013 for 271
northern Pakistan and that of 13-14 mm/year from the GNSS network deployed in Jammu-272
Kashmir Himalaya and Ladakh (Kundu et al. 2014). 273
274
Jhelum strike-slip fault
We have considered that the Jhelum strike-slip fault (Fig. 1) is a vertical transfer fault separating 276
the domain in the west with east-west-trending faults and folds from the domain in the east 277
characterized by a NW-SE structural orientation. We suppose that this fault affects only the 278
upper part of the crust above the Main Himalayan Thrust. Unfortunately, the lack of neotectonic 279
investigations of the present-day slip along this fault means that we cannot constrain the 280
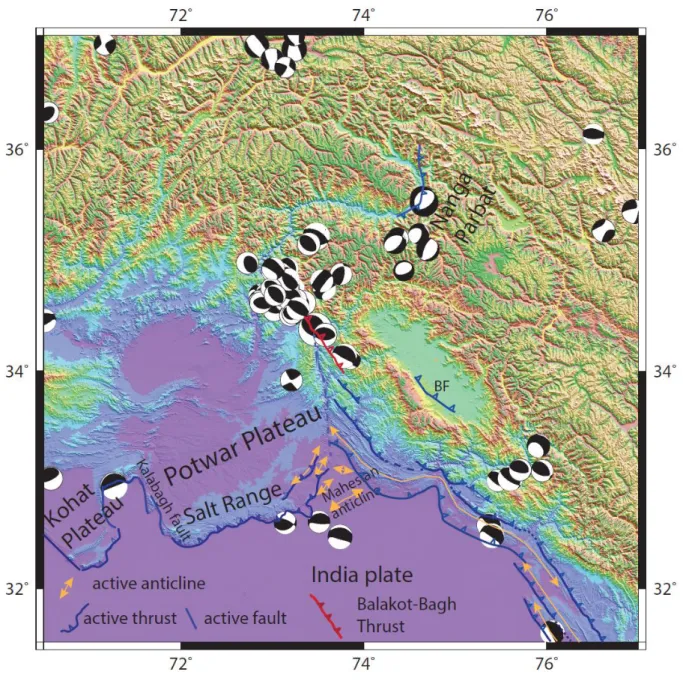
maximum slip rate. The area south of the Jhelum fault where the folds change direction is 281
affected by significant seismicity with earthquakes of magnitude greater than 5. Focal 282
mechanisms (Fig. 4) show the existence of north-south shortening in the vicinity of the 283
Mahesian anticline (Fig. 4), where neotectonic investigations (Cortes Aranda et al., 2017) have 284
quantified a long-term shortening rate reaching 10 mm/year for the last 6.5 ka. 285
286
Raikot–Liachar fault.
287
The Raikot-Liachar fault, which borders the Nanga Parbat massif to the west, can be 288
described as a nonrectilinear fault (Fig. 5) plunging 40° eastward according to the distribution 289
of microseismicity. This fault places the metamorphic gneiss of Nanga Parbat over Quaternary 290
sediments with a minimum displacement of 300 m (Owen, 1989); with the hypothesis that these 291
sediments are 65,000 years old, the minimum thrust rate would be 4 mm/yr. This slip rate is a 292
minimum, and we cannot use it to constrain the slip rate inversion using GNSS velocities; 293
however, after the inversion, we can check whether the slip rates along the Raikot-Liachar fault 294
are larger than or equal to 4 mm/year. 295
296
Slip distribution and coupling along the Main Himalayan Thrust, along the Nanga
297
Parbat Thrust and the Jhelum strike-slip fault.
298
In our study, we did not use the back-slip approach (Savage 1983), but we have directly 299
determined the slip on the fault using the SDM software (Wang et al., 2009, 2011, 2012). SDM 300
(Steepest Descent Method) is a based on an iterative algorithm used for the constrained least-301
squares optimization. This software allows the use of curved faults that may have variations in 302
dip, from which a set of rectangular segments is determined (~15*15 km in our study). This 303
software allows the determination of an offset between the different datasets. This software 304
requires a priori data such as the upper limit of the slip on the considered faults and the direction 305
of the slip between a minimum and a maximum value (Table 3). The smooth slip model is 306
realized through a smoothing term to be minimized with the misfit to data. In our study, the 307
smoothing has been applied to slip and not to stress-drop, as possible, with a smoothing factor 308
of 0.2. 309
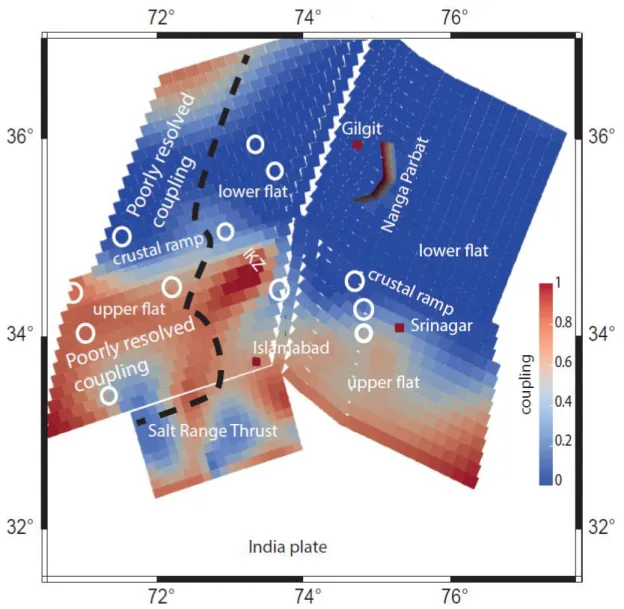
During the inversion with sdm2011 software, we allow the slip rate along the MHT to 310
reach up to 14 mm/year, which is supposed to be the maximum ductile slip rate at depth along 311
the MHT (Figs. 8 & 9). We also allow a strike-slip component with the rake varying from -120° 312
to -30° to take into account the obliquity of slip along the MHT due to the orientation of the 313
thrust relative to the general interseismic velocities directed N190° in northwestern Himalaya. 314
We use a low smoothing factor of 0.2 for the slip distribution to detect small-scale variations in 315
the slip and coupling variations that may reflect the existence of asperities along the MHT. We 316
also consider the decollement plane of the Potwar Plateau and Salt Range to be an active fault 317
with a dip of 5° and dislocations that reach the surface, and we assume that a thrust allows the 318
westward motion of Nanga Parbat above the Kohistan Plateau. For this last thrust, we use the 319
distribution of microseismicity, which is apparently restricted to the top 5 km of the crust 320
(Meltzer et al. 2001), to define a fault dipping 60° eastward. We suppose that this fault reaches 321
the MHT at depth with a relatively low dip angle of 40°. 322
Our points in the area affected by postseismic deformation following the 8 October 2005 323
Balakot-Bagh earthquake (Jouanne et al., 2012) were destroyed before 2011, and thus, we were 324
not able to estimate the linear and interseismic velocities for a time span after the end of 325
postseismic deformation. We excluded the velocities during 2005-2007 within this zone from 326
the study and ignored the Balakot-Bagh fault in our analysis of interseismic deformation. We 327
also excluded the velocity at KERN published by Kundu et al., 2014, which was clearly affected 328
by postseismic deformation. The residuals between the observed and simulated velocities (Fig. 329
7) are generally not significant, except those at points PS03, PS07, PS11 and PS16. These points 330
are located in the Indus-Kohistan seismic zone within the geometrical extension of the Balakot-331
Bagh thrust (which was affected by the 8 October 2005 Mw 7.6 earthquake) in an area affected 332
by large aftershocks subsequent to the main shock. The velocities at these points were 333
determined with GNSS measurements (the first ones, which were recorded just after the 334
earthquake in November 2005). We can then suppose that these velocities reflect the partial 335
postseismic deformation following the Balakot-Bagh 2005 earthquake or its aftershocks. North 336
of the network, near the China-Pakistan border, the points show significant residuals that can 337
be interpreted as indicative of unmodeled velocities to the south. In this hypothesis, the residual 338
velocities at the two points located north of the Main Karakoram Thrust could reveal the activity 339
of this fault. 340
Our study uses data with a very disparate spatial distribution as shown in Figure 6. For 341
example, it can be assumed that spatial coupling variations cannot be determined along the 342
upper flat of the MHT in the western part of the study area, whereas such spatial variations can 343
probably be determined in the central and eastern part of the study area. To determine the impact 344
of this unequal spatial distribution of the data, we used the bootstrap method (Efron and 345
Tibshirani, 1986; Arnadottir and Segall, 1994, Hsu et al., 2003, Arnadottiret al., 2006; 346
Serpelloni et al., 2010), which consists of randomly removing part of the data, in this case 10%, 347
from the analysis, analysing the dataset thus constituted and repeating this a large number of 348
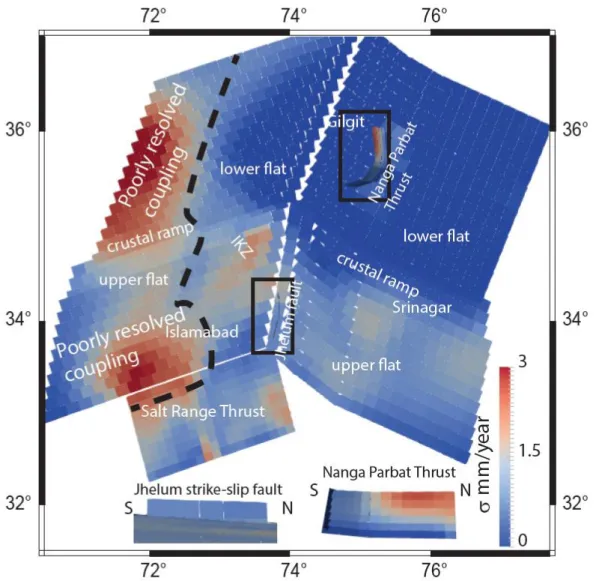
times (200 in our study) to determine which parts of the model could be biased. To characterize 349
the distribution of the solutions thus determined we estimated the standard deviation on the slip 350
value for each patch (Fig. 10). As could be assumed, the western part of the model shows strong 351
standard deviations (~ 3 mm/year) underlining that, in this region, the coupling is determined 352
poorly, possible spatial variations in coupling cannot be determined, one can simply say that 353
the upper flat of the MHT in the western part of the study area is probably locked. 354
The Salt Range thrust locally shows patches with standard deviations up to 2 mm/year (Fig. 355
10), we interpret these somewhat large standard deviations as reflecting insufficient data density 356
to fully account for spatial variations in coupling along this thrust. 357
Similarly, further north, the Nanga Parbat thrust has patches with large standard deviations of 358
up to 3 mm/year in its northern part, which underlines that the slip along the northern part of 359
this fault is only constrained by the velocity of the point PK26, to solve this problem new points 360
have been installed in 2019. The results of this study for the Jhelum Fault, on the contrary, show 361
that the slip along this fault is well documented by the data. 362
We can compare also our coupling model with that of Li et al. 2018, which covers the same 363
region as the region we are studying and which has considered some of the velocities previously 364
published (Jouanne et al. 2012). These two models agree to determine a large blocked zone 365
corresponding to the upper flat of the MHT, however the partial consideration of the published 366
velocities for the Potwar Plateau and the Salt Range does not allow Li et al. 2018 to determine 367
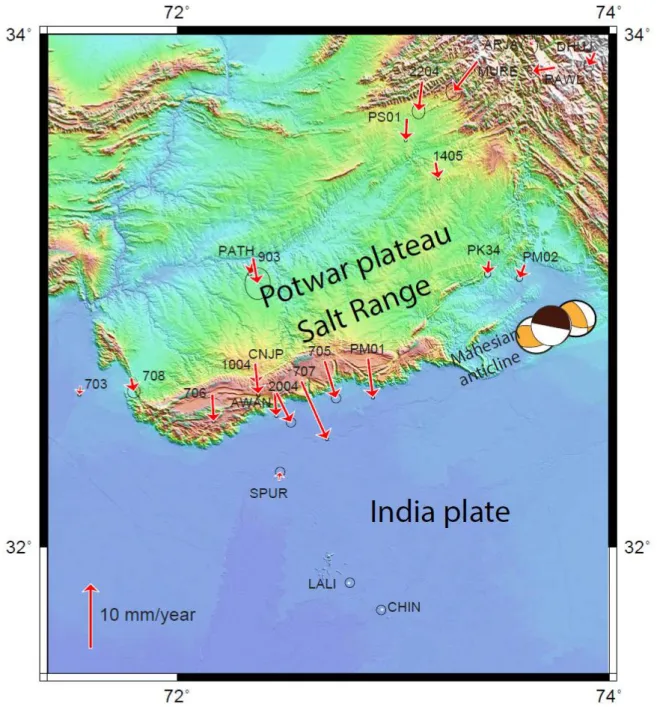
the coupling variations in this zone. Similarly, further north, the model of Li et al. 2018 presents 368
a region with strong coupling at the level of the Indus - Kohistan Seismic Zone which exists in 369
our model but in a less marked way. 370
371
6. Discussion 372
373
Main Himalayan Thrust
374 375
On the scale of the Potwar Plateau and the Salt Range (Fig. 4), the velocities show a 376
north-south gradient. In contrast, the modeling results for the coupling along the MHT below 377
the Potwar Plateau and Salt Range Thrust (Figs. 8 & 9) suggest local asperities and areas with 378
low coupling. Analysis of the robustness of the coupling determination by the bootstrap method 379
shows that at certain strong coupling variations (Fig. 8) patches with a high standard deviation 380
(2 mm/year) are observed (Fig. 10). However, it should be noted that 2 mm/year corresponds 381
to a standard deviation on the coupling of 0.14, a value which is much lower than the observed 382
coupling variations reaching 0.4. We therefore assume that these strong coupling variations 383
exist but that a higher measurement density would be needed to highlight them with more 384
robustness. 385
We hypothesize that the Eocambrian salt layer (Fig. 11) induced low-coupling areas. 386
We assume that the velocity field specific to this region (Fig. 4) reveals not only the tectonic 387
origin of the region in the strictest sense but also a horizontal salt flow that affected the thick 388
salt layers observed in the frontal and central parts of the Salt Range (points 0705, 0707, 1004, 389
2004, Awan, CNJP, and PM01). In the Salt Range, the present-day tectonism is therefore partly 390
controlled by the horizontal flow of salt (Fig. 11) and by vertical flow along the Kalabagh fault, 391
where diapirism is observed (Khan et al., 2012). We can therefore interpret the observation of 392
normal faults in the front part of the Salt Range to represent the result of the subtraction of 393
voluminous salt following this flow. Alternatively, could it be that fast slip in the past has 394
shifted potential energy to the Salt Range that is currently manifest as high SW velocities as 395
suggested by Cortés-Aranda et al., 2017. 396
To the north-west of the Potwar plateau the bootstrap method indicates that coupling 397
variations cannot be detected because of the lack of data in this area. On the contrary, to the 398
north-east of the Potwar Plateau, the coupling along the upper flat of the MHT presents a 399
significant lateral variation (Figs. 8, 9 and 10). The salt layer may explain the lateral coupling 400
variations along the upper flat of the MHT, to the northwest of the Potwar Plateau and in the 401
vicinity of the Jhelum fault in the transition area between the Potwar Plateau and Jammu-402
Kashmir Himalaya, as reflected by the drastic change in structural orientation (Figs. 1 & 6). On 403
the other hand, the coupling variations along the upper flat within the Kashmir Valley could 404
indicate local fluctuations in the depth of the brittle-ductile transition along this upper flat within 405
the depth range of 12-16 km (Vassallo et al., 2015; Mir et al., 2017). The spatial variation in 406
the coupling along the upper flat of the MHT at equivalent depths may reflect lithological or 407
thermal spatial variations. 408
The crustal ramp between the upper and lower flats of the MHT is affected by weak coupling 409
along its eastern part to the north of Srinagar, while along its western part, in the area where 410
coupling is well constrained, the ramp is in a coupled/uncoupled transition zone, i.e., the brittle-411
ductile transition zone. These variations may reflect lithological or thermal variations along the 412
MHT. 413
North of the crustal ramp, coupling along the lower flat is absent (Figs. 8 & 9), which suggests 414
the existence of ductile deformation along the lower flat, as observed, for example, in Nepal 415
(Ader et al., 2012; Berger et al., 2003; Bettinelli et al., 2006; Jouanne et al., 1999; Jouanne et 416
al., 2004; Jouanne et al., 2017; Stevens & Avouac, 2015). It must be underlined that the 417
coupling increase determined in the north-western part of our study area along the lower flat of 418
the MHT (Fig. 8) corresponds at an area where the bootstrap method indicates that the coupling 419
is poorly constrained (Fig. 10), we can then suppose that this coupling variation has not 420
necessary a geological meaning. 421
The approximate location of historical earthquakes indicates that they are generally located in 422
areas with strong coupling variations, either near the crustal ramp or at the upper flat of the 423
MHT. The presence of historic earthquakes at the lower ductile MHT flat could correspond to 424
extensional earthquakes as suggested by the focal mechanisms in this region (Fig. 2) indicating 425
an E-W extension. 426
427
Jhelum strike-slip fault
428 429
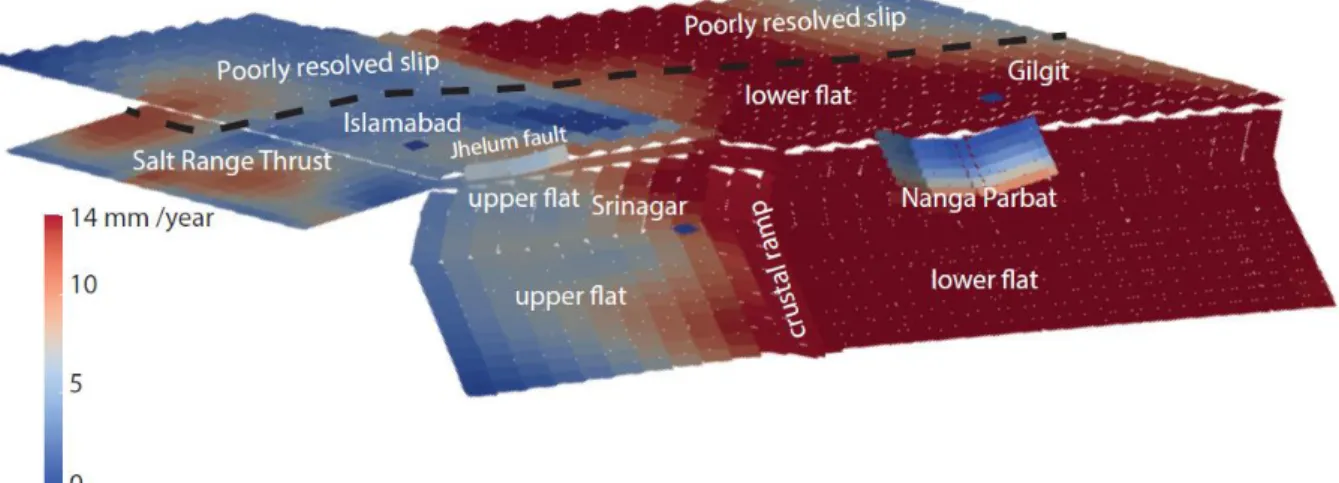
The role of the Jhelum strike-slip fault in the transition between the structural orientation 430
of the Salt Range (N80°) and that of the Jammu-Kashmir Himalaya (N150°) is unclear. If we 431
consider this fault in the numerical simulation of the current displacement field, assuming that 432
it extends from the surface to the MHT, then a dextral strike-slip rate of up to 6 mm/year is 433
determined from the surface to its connection with the MHT (Fig. 9). However, the numerical 434
simulation of the slip along the dextral Jhelum strike-slip fault does not show any variation with 435
depth. The upper part of the fault does not appear to be locked. This behavior could be related 436
to the observation of serpentine bodies along the fault zone that would allow the existence of 437
creep, even near the surface. Nevertheless, a denser GNSS network than that used herein would 438
be necessary to better constrain the distribution of slip over this fault although analysis of the 439
reliability of the slip on this fault by the bootstrap method shows that this estimate is robust 440
(Fig. 10). 441
Indus Kohistan Seismic Zone
443 444
Microseismicity, the Patan earthquake in 1974 and the aftershocks following the 445
Balakot Bagh earthquake (MonaLisa et al. 2009) help to define this zone characterized by a 446
seismicity swarm. This zone can be interpreted as the north-westward propagation of the 447
Balakot-Bagh fault, site of the 2005 earthquake (Jouanne et al., 2011). The location of this zone 448
on the coupling map shows that this zone also corresponds to a zone where strong coupling 449
variations exist. We can thus propose that the abrupt change of coupling induces a local increase 450
of deviation stress associated with this seismicity swarm. 451
452
Liachar brittle-ductile shear zone or Raikot-Liachar fault (Figs. 5, 9 & 12).
453 454
The velocity field expressed with respect to a point located in Kohistan shows 455
asymmetric velocities to the west in the Nanga Parbat massif (Fig. 5). The velocities were 456
numerically simulated considering the geometry of the reverse and strike-slip fault that borders 457
this massif to the west (Fig. 12). The simulated fault slips along the central part of this boundary 458
fault decrease from 5 mm/year at depth to a fraction of a millimeter per year near the surface. 459
We interpret this evolution as a reflection of the change in the deformation regime from ductile 460
deformation at depth to brittle deformation, marked by a swarm of microseismicity at relatively 461
shallow depth. We can notice good agreement between the distribution of microseismicity and 462
the upper part of the fault that is almost blocked, as shown by the numerical simulation of 463
velocities (Fig. 12), and good agreement is also observed with the Quaternary slip along the 464
fault estimated at ~4 mm/year. 465
466
Hazard implications.
467 468
The estimation of the seismic alea of the eastern part of the study area, Jammu and 469
Kashmir, can be based on fairly detailed historical seismicity (Bilham et al., 2019) and 470
paleoseismological studies along the Riasi out-of-sequence thrust, which is not possible along 471
the MFT, which is blind here. The last major earthquakes in Kashmir were the 1555 earthquake 472
(Mw 7.6 to 8) and the 2005 Mw 7.6 earthquake. We join by Schiffman et al. 2013 in pointing 473
out that the MHT in this region is largely locked (Fig. 8). As the last earthquake probably 474
affected this segment, at least partially dating from 1555, we can conclude like Bilham et al., 475
2017, 2019 that this segment of the Himalayan chain is sufficiently mature to be affected by a 476
strong earthquake of magnitude (Mw > 8) and that earthquakes of very strong magnitudes (Mw 477
~9) must occur from time to time to release the entire slip deficit. 478
The estimation of the seismic alea of northern Pakistan is difficult due to the absence of 479
a major historical reference earthquake, with the possible exception of the Taxila earthquake in 480
25 AD (Ambraseys et al., 1975), and the absence of a paleoseismological calendar. The 481
paleoseismological calendar is only known for the Balakot-Bagh thrust (Kondo et al. 2008) but 482
not for the MFT at the Salt Range. It can indeed be assumed that a very strong magnitude 483
earthquake along the MHT would not propagate in the salt level forming the detachment of the 484
Potwar Plateau and the Salt Range, but would induce a strong post-seismic deformation 485
controlled by the rheology of the salt. It can therefore be assumed that the postseismic 486
deformation would not be sufficiently localized to be studied by neotectonic methods, by 487
trenching the Salt Range Thrust - MFT for example. 488
On the other hand, with our study we can quantify the surface likely to be affected by a very 489
strong magnitude earthquake, this surface corresponds to the sum of the MHT patches 490
corresponding to northern Pakistan presenting a non-zero coupling. Assuming that the previous 491
large magnitude earthquake, the hypothetical Taxila AD 25 earthquake by example, released 492
all the previously accumulated slip deficit and that the future earthquake will release all the slip 493
deficit accumulated since the last very large earthquake, then assuming that the geodetic 494
coupling has not changed over time, we can use the sum of the seismic moments calculated 495
with our model to propose a Mw magnitude. We can then propose that in the area covered by 496
our study a Mw of 8.8 earthquake could occurred each 2000 years, a Mw 8.6 earthquake each 497
1000 years or a Mw 8.4 each 500 years if all the patches break during a single earthquake and 498
if we neglect the afterslip which could release part of the slip deficit probably in the deep part 499
of the MHT. 500
If we assume that the afterslip releases a seismic moment equivalent to 34.0% of the co-seismic 501
moment as proposed by Gualandi et al, 2017 for the 2015 Gorkha earthquake in Nepal, we can 502
correct the above estimates, with an earthquake of Mw 8.69 every 2000 years, an earthquake of 503
Mw 8.49 every 1000 years and an earthquake of Mw 8.28 every 500 years. 504
If now we consider that a single earthquake can affect not only Northern Pakistan but also 505
Kashmir we can propose with our slip distribution, if we assume that all the slip deficit 506
accumulated before the 1555 earthquake was released in that earthquake, a magnitude Mw 8.63 507
if Northern Pakistan is affected by an earthquake every 500 years, a magnitude Mw 8.74 if an 508
earthquake occurs every 1000 years in Northern Pakistan and a magnitude Mw 8.88 if it occurs 509
every 2000 years. If, as before, we assume the existence of an afterslip that releases 34% of the 510
seismic moment, we can correct the above estimates, with an earthquake of Mw 8.51 every 500 511
years, an earthquake of Mw 8.62 every 1000 years and an earthquake of Mw 8.76 every 2000 512
years. 513
We can reasonably assume that from the 16th century onwards, there are no major earthquakes 514
not reported in historical sources in northern Pakistan, we can therefore assume that this region 515
may be affected by a major earthquake with a moment magnitude Mw greater than 8.3 (or 8.63 516
if Kashmir is also affected) if all the slip deficit is released, which could reach Mw 8.7 if the 517
last very strong earthquake occurred 2000 years ago in northern Pakistan. Earthquakes of such 518
very strong magnitudes are reported in the Himalayas, we can thus note for example the 519
following earthquakes: 1100 ± 50 Mw 9 event which is not associated with historical sources 520
in the eastern Himalayas (Wesnousky et al. 2019), 1225 Mw 7.5- 8.5 Nepal (Pant 2002, Sapkota 521
et al. 2013), 1400 ± 50 Mw 8.0- 8.5 in Western Himalaya (Kumar et al. 2001, 2006), 1505 Mw 522
8.2 - 8.9 eastern Nepal and Kumaon (Jackson 2000; Ambraseys & Jackson 2003), the 1934 523
Bihar Nepal earthquake Mw 8.4 (Chen & Molnar 1977, 1983) and the 1950 Assam earthquake 524
Mw 8.7 (Chen & Molnar 1977). 525
Conclusion 526
527
Measurements of the velocity field in the northwestern Himalaya revealed coupling variations 528
along the basal overlap of the Potwar Plateau and Salt Range that could be related to variations 529
in the thickness of the salt layer forming the detachment plane. In the central part of the Salt 530
Range, the measured horizontal velocities suggest the existence of very significant horizontal 531
creep of the very thick salt layer at this location, while along the Kalabagh fault, salt diapirism 532
is observed. The Jhelum fault separating the Potwar Plateau, which is characterized by a thick 533
layer of salt, from the rest of the Himalayas is a dextral strike-slip fault affected by creep of 6 534
mm/year. Along the upper flat of the MHT, the coupling evolves from full to weak coupling, 535
which may or may not be weak at the level of the crustal ramp separating the upper flat from 536
the lower flat of the MHT. The lower flat of the MHT is characterized by no coupling, 537
suggesting the existence of ductile deformation along the MHT. The absence of recent 538
earthquakes of very high magnitude in the historical seismicity and coupling along the MHT 539
determined by our study suggests that earthquakes of very high magnitudes (Mw > 8) could 540
affect northern Pakistan. Finally, our simulation of the velocity field suggests that the current 541
deformation of Nanga Parbat is mainly controlled by its westward thrusting over the Kohistan 542
Plateau. The estimated slips along the Nanga Parbat Thrust show slips reaching 6 mm/year at 543
depth, and the slip gradually decreases until it is almost absent along the upper part of the fault, 544
which is probably brittle, as is indicated by a swarm of microseismicity. 545
546
Acknowledgments 547
The authors would like to thank R. Bilham, the Associate Editor L. Dal Zilio, and three 548
anonymous reviewers for their insightful remarks. The figures and maps were prepared using 549
Generic Mapping Tools software (Wessel and Smith, 1995) and Paraview software (Ahrens et 550
al., 2005; Ayachit, 2015). This material is partially based on data provided by UNAVCO with 551
support from the National Science Foundation (NSF) and the National Aeronautics and Space 552
Administration (NASA) under NSF Cooperative Agreement No. EAR-0735156, United States. 553
Funding was also provided by INSU-CNRS, France, and the AAP of Savoie Mont Blanc 554
University, France. After acceptance of this paper, data used in this study will be place in a 555 repository. 556 557 References 558
Ader, T., Avouac, J.P., Liu-Zeng, J., Lyon-Caen, H., Bollinger, L., Galetzka, J., 559
Genrich, J., Thomas, M., Chanard, K., Sapkota, S., Rajaure, S., Shrestha, P., Ding, L., Flouzat, 560
M., 2012. Convergence rate across the Nepal Himalaya and interseismic coupling on the Main 561
Himalayan Thrust: implications. J. Geophys. Res. 117, B04403. 562
http://dx.doi.org/10.1029/2011JB009071. 563
Ahrens, J., Geveci, B., Law, C., 2005. ParaView: An End-User Tool for Large Data 564
Visualization, Visualization Handbook. Elsevier ISBN-13: 978-0123875822. 565
Altamimi, Z., Rebischung, P., Métivier, L., Xavier, C., 2016. ITRF2014: A new release 566
of the International Terrestrial Reference Frame modeling nonlinear station motions, J. 567
Geophys. Res. Solid Earth, 121, doi:10.1002/2016JB013098.
568
Altamimi, Z., L. Métivier, P. Rebischung, H. Rouby and X. Collilieux (2017) 569
ITRF2014 Plate Motion Model, Geophysical Journal International, vol. 209, n. 3, pp. 1906--570
1912, doi:10.1093/gji/ggx136. 571
Ambraseys, N., Lensen, G., Moinfar, M., 1975. The Pattan Earthquake of 28 Dec., 1974. 572
Reconnaissance Report Prepared for the Government of Pakistan and UNESCO. Paris. 573
Ambraseys N. & Jackson, D. 2003. A note on early earthquakes in northern India and 574
southern Tibet. Current Science, 84, 570–582. 575
Arnadottir, T., and P. Segall (1994), The 1989 Loma Prieta earthquake imaged from 576
inversion of geodetic data, J. Geophys. Res., 99, 21,835–21,855. 577
Arnadottir, T., W. Jiang, K. L. Feigl, H. Geirsson, and E. Sturkell (2006), Kinematic 578
models of plate boundary deformation in southwest Iceland derived from GPS observations, J. 579
Geophys. Res., 111, B07402, doi:10.1029/2005JB003907. 580
Avouac, J.-P., Ayoub, F., Leprince, S., Konca, O., and Helmberger, D., 2006, The 2005 581
Mw 7.6 Kashmir earthquake: sub-pixel correlation of ASTER images and seismic waveform 582
analysis, Earth Planet. Sci. Lett. 249, 514-528. 583
Ayachit, U., 2015. The ParaView Guide: A Parallel Visualization Application. Kitware 584
ISBN 978-1930934306. 585
Baker, D.M., Lillie, R.J., Yeats, R.S., Johnson, G.D., Yousuf, M., Zamin, A.S.H., 1988. 586
Development of the Himalayan frontal thrust zone: salt Range, Pakistan. Geology 16, 3e7. 587
http://dx.doi.org/10.1130/0091-7613(1988)016<0003: DOTHFT>2.3.CO;2. 588
Bendick, R., R. Bilham, M. Asif Khan, and S. Faisal Khan (2007), Slip on an active 589
wedge thrust from geodetic observations of the 8 October 2005 Kashmir earthquake, Geology, 590
35, 267–270, doi:10.1130/G23158A.1. 591
Berger, A., Jouanne, F., Hassani, R., Mugnier, J.L., 2003. Modelling the spatial 592
distribution of present-day deformation in Nepal. How cyclindrical is the Main Himalayan 593
Thrust in Nepal? Geoph. J. Int. 156 (1), 94e112. 594
Bettinelli P., Avouac J.P., Flouzat M., Willis P., Jouanne F., Bollinger L., Chitrakar 595
G.R., (2006), Interseismic deformation in the Himalaya of Central Nepal from combined GPS 596
measurements and DORIS data, Journal of Geodesy. 597
Bilham, R., Mencin, D., Bendick, R. & Bürgmann, R., (2017). Implications for elastic 598
energy storage in the Himalaya from the Gorkha 2015 earthquake and other incomplete ruptures 599
of the Main Himalayan Thrust. Quaternary International, 462, 3–21, 600
https://doi.org/10.1016/j.quaint.2016.09.055. 601
Bilham, R. (2019), Past and future Himalayan earthquakes: a 2018 estimate of slip 602
potential based on the past five centuries of historical seismicity, in Treloar, P. J. & Searle, M. 603
P. (eds) Himalayan Tectonics: A Modern Synthesis.. Geological Society, London, Special 604
Publications Version: 1, doi: 483, 1-61.
Butler, R.W., Coward, M.P., Harwood, G.M., Knipe, R.J., 1987. Salt control on thrust 606
geometry, structural style and gravitational collapse along the Himalayan mountain front in the 607
Salt Range of northern Pakistan. Dyn. Geol. Salt Relat. Struct. 399e418. 608
Butler, R.W.H. & Prior, D.J. 1988. Tectonic controls on the uplift of Nanga Parbat, 609
Pakistan Himalayas. Nature, 333, 247–250. 610
Butler, R.W., 2018. Tectonic evolution of the Himalayan syntaxes: the view from Nanga 611
Parbat.Geological Society, London, Special Publications, 483, 30, August 2018, 612
htpps://doi.org/10.1144/SP483.5. 613
Chen, W., Molnar, P., 1977. Seismic moments of major earthquakes and the average 614
rate of slip in central Asia. J. Geophys. Res. 82, 2945–2969. 615
Chen, W.P. & Molnar, P. 1983. Focal depths of intracontinental and intraplate 616
earthquakes and their implications for the thermal and mechanical properties of the lithosphere. 617
J. Geophys. Res. Solid Earth, 88, 4183–4214. 618
Chen, L., Khan, S.D., 2010. InSAR observation of the strike-slip faults in the northwest 619
Himalayan frontal thrust system. Geosphere 6, 731e736. 620
http://dx.doi.org/10.1130/GES00518.1. 621
Cortés-Aranda J., Mugnier J.L., Jouanne F., Vassallo R., Carcaillet J., Alam A.A., 2017. 622
Holocene shortening rates and seismic hazard assessment for the frontal Potwar Plateau, NW 623
Himalaya of Pakistan : Insights from 10Be concentrations on fluvial terraces in the Mahesian 624
Anticline. Quaternary International, 462, 75-9. http://dx.doi.org/10.1016/j.quaint.2017.02.032. 625
Dach, R., S. Lutz, P. Walser, P. Fridez (Eds); 2015: Bernese GNSS Software Version 626
5.2. User manual, Astronomical Institute, University of Bern, Bern Open Publishing. 627
DOI: 10.7892/boris.72297; ISBN: 978-3-906813-05-9. 628
DeMets, C., Gordon, R.G., Argus D.F & Stein S., 1994. Effect of recent revisions to the 629
geomagnetic reversal time scale on estimates of current plate motions. Geophys. Res. Lett., 21, 630
2191–2194. 631
Dziewonski, A. M., T.-A. Chou and J. H. Woodhouse, Determination of earthquake 632
source parameters from waveform data for studies of global and regional seismicity, J. 633
Geophys. Res., 86, 2825-2852, 1981. doi:10.1029/JB086iB04p02825 634
Dumka R. K., Kotlia B., Kothyari G. Ch., Paikrey J. Dimri S., (2018), Detection of 635
high and moderate crustal strain zones in Uttarakhand Himalaya, India, Acta Geodaetica et 636
Geophysica 53(B11), DOI: 10.1007/s40328-018-0226-z. 637
Duputel, Z., Vergne, J., Rivera, L., Wittlinger, G., Farra, V., Hetényi, G., 2016. The 638
2015 Gorkha earthquake: a large event illuminating the Main Himalayan Thrust fault. Geophys. 639
Res. Lett. 43 (2517–2525), 2016G. http://dx.doi.org/10.1002/L068083. 640
Efron, B., and R. Tibshirani (1986), Bootstrap methods for standard errors, confidence 641
intervals, and other measures of statistical accuracy, Stat. Sci., 1, 54– 77. 642
Ekström, G., M. Nettles, and A. M. Dziewonski, The global CMT project 2004-2010: 643
Centroid-moment tensors for 13,017 earthquakes, Phys. Earth Planet. Inter., 200-201, 1-9, 644
2012. doi:10.1016/j.pepi.201204.002. 645
Gualandi, Adriano and Avouac, Jean-Philippe and Galetzka, John and Genrich, 646
Joachim F. and Blewitt, Geoffrey and Adhikari, Lok Bijaya and Koirala, Bharat 647
Prasad and Gupta, Ratnamani and Upreti, Bishal Nath and Pratt-Sitaula, Beth and Liu-Zeng, 648
Jing (2017) Pre- and post-seismic deformation related to the 2015, M_w 7.8 Gorkha 649
earthquake, Nepal. Tectonophysics, 714-715. pp. 90-106. ISSN 0040-1951.
650
Grelaud, S., Sassi, W., de Lamotte, D.F., Jaswal, T., Roure, F., 2002. Kinematics of 651
eastern salt Range and south Potwar basin (Pakistan): a new scenario. Mar. Pet. Geol. 19, 652
1127e1139. http://dx.doi.org/10.1016/S0264-8172(02)00121-6. 653
Hsu, Y.-J., M. Simons, S.-B. Yu, L.-C. Kuo, and H.-Y. Chen (2003), A two dimensional 654
dislocation model for interseismic deformation of the Taiwan mountain belt, Earth Planet. Sci. 655
Lett., 211, 287 – 294. 656
Ischuk, A., et al. (2013), Kinematics of the Pamir and Hindu Kush regions from GPS 657
geodesy, J. Geophys. Res. Solid Earth, 118, 2408–2416, doi:10.1002/jgrb.50185. 658
Jackson, D. 2000. The great Himalayan earthquake of 1505: Rupture of the Central 659
Himalayan Gap? In: BLEZER, H. (ed.) Tibet, Past and Present: Tibetan Studies 1. PIATS 2000: 660
Tibetan Studies : Proceedings of the Ninth Seminar of the International Association for Tibetan 661
Studies, Leiden 2000. Brill, Boston, MA, 147–153. 662
Jaume, S.C., Lillie, R., 1988. Mechanics of the Salt Range-Potwar Plateau, Pakistan: a 663
fold and thrust belt underlain by evaporates. Tectonics 7, 57e71. 664
Jouanne, F., Mugnier, J.L., Pandey, M.R., Gamond, J.F., Le Fort, P., Serrurier, L., 665
Vigny, C., Avouac, J.P. & IDYLHIM members (1999). - Oblique convergence in the Himalayas 666
of western Nepal deduced from preliminary results of GPS measurements. Geoph. Res. Lett. 667
N°13, V.26, p. 1933-1936. 668
Jouanne F., Mugnier J. L., Gamond J. F., Le Fort P., Pandey M.R., Bollinger L., Flouzat 669
M., Avouac J.P., (2004), Current shortening across the Himalayas of Nepal, Geophys. J. 670
Int.,157, 1-14. 671
Jouanne, F., Awan, A., P^echer, A., Kausar, A., Mugnier, J.L., Khan, I., Khan, N.A., 672
Van Melle, J., 2014. Present-day deformation of northern Pakistan from salt ranges to 673
Karakorum ranges. J. Geophys. Res. Solid Earth 119, 2487e2503. 674
http://dx.doi.org/10.1002/2013JB010776. 675
Jouanne, F., Awan, A., Madji, A., Pêcher, A., Latif, M., Kausar, A., Mugnier, J.L., 676
Khan, I., Khan, N.A., 2011. Postseismic deformation in Pakistan after the 8 October 2005 677
earthquake: evidence of afterslip along a flat north of the Balakot-Bagh Thrust. J. Geophys. 678
Res., 116, B07401, doi:10.1029/2010JB007903.
679
Jouanne F., Mugnier J.L., Sapkota S.N., Bascou B., Pecher A., 2017. Estimation of 680
coupling along the Main Himalayan Thrust in the central Himalaya. Journal of Asian Earth 681
Sciences, January 2017.
682
Kaneda, H., T. Nakata, H. Tsutsumi, H. Kondo, N. Sugito, Y. Awata, S. S. Akhtar, A. 683
Majid, W. Khattak, A. A. Awan, R. S. Yeats, A. Hussain, M. Ashraf, S. G. Wesnousky, and A. 684
B. Kausar (2008), Surface rupture of the 2005 Kashmir, Pakistan, earthquake, and its active 685
tectonic implications, Bull. Seismol. Soc. Am., 98, 521– 686
557. https://doi.org/10.1785/0120070073. 687
Khan, M.A., Treloar, P.J., Searle, M.P., and Jan, M.Q., (eds) 2000. Tectonics of the 688
Nanga Parbat Syntaxis and the Western Himalaya. Geological Society, London, Special 689
Publication, v.170, pp: 2 690
Khan, M. A., R. Bendick, I.M. Bhat, R. Bilham, D.M. Kakar. S. F. Khan, S. H. Lodi, 691
M. S. Qazi, B. Singh, W. Szeliga amd A. Wahab, 2008. Preliminary geodetic constraints on 692
plate boundary deformation on the western edge of the Indian Plate from TriGGNnet, J. 693
Himalayan Earth Sciences, 41 (2008), 71-87). Peshawar 2010.
694
Khan, S.D., Chen, L., Ahmad, S., Ahmad, I., Ali, F., 2012. Lateral structural variation 695
along the Kalabagh Fault Zone, NW Himalayan foreland fold-and-thrust belt, Pakistan. J. Asian 696
Earth Sci. 50, 79e87. http://dx.doi.org/10.1016/j.jseaes.2012.01.009. 697
Kondo, H., Nakata, T., Akhtar, S.,Wesnousky, S., Sugito, N., Kaneda, H., Tsutsumi, H., Khan, 698
A., Khattak,W., Kausar, A., (2008). Long recurrence interval of faulting beyond the 2005 699
Kashmir earthquake around the northwestern margin of the Indo-Asian collisionzone. Geology 700
36, 731–734. http://dx.doi.org/10.1130/G25028A. 701
Kumar S, Wesnousky WG, Rockwell TK, Ragona D, Thakur VC, Seitz GG (2001) 702
Earthquake recurrence and rupture dynamics of Himalayan Frontal Thrust, India. Science 703
294:2328–2331. 704
Kumar, S., Wesnousky, S., Rockwell, T.K., Briggs, R.W., Thakur, V.C., 705
Jayangondaperumal, R., 2006. Paleoseismic evidence of great surface rupture earthquakes 706
along the Indian Himalaya. J. of Geophysical Res. 111, B03304. doi:10.1029/2004JB003309. 707
Kundu, B., R. K. Yadav, B. S. Bali, S. Chowdhury, and V. K. Gahalaut (2014), Oblique 708
convergence and slip partitioning in the NW Himalaya: Implications from GPS measurements, 709
Tectonics, 33, 2013–2024, doi:10.1002/2014TC003633. 710
Li, S., Wang, Q., Yang, S., Qiao, X., Nie, Z., Zou, R., et al. (2018). Geodetic imaging 711
mega-thrust coupling beneath the Himalaya. Tectonophysics 747, 712
DOI: 10.1016/j.tecto.2018.08.014. 713
McDougall, J.W., Hussain, A., Yeats, R.S., 1993. The Main Boundary Thrust and 714
propagation of deformation into the foreland fold-and-thrust belt in northern Pakistan near the 715
Indus River. Geol. Soc. Lond. Spec. Publ. 74, 581e588. 716
Mcdougall, J.W., Khan, S.H., 1990. Strike-slip faulting in a foreland foldthrust belt: the 717
Kalabagh Fault and western salt Range, Pakistan. Tectonics 9, 1061e1075. 718
Madin, I.P., Lawrence, R.D. & Ur-Rehman, S, 1989. The northwestern Nanga Parbat-719
Haramosh massif; evidence for crustal uplift of the northwestern corner of the Indian craton. 720
In: MALINCONICO, L.L. & LILLIE, R.J. (eds) Tectonics of the Western Himalayas. 721
Geological Society of America, Special Papers, 232, 169–182. 722
Marechal A., Mazzotti S., Cattin R., Cazes G, Vernant P., Drukpa D., Thinley K., 723
Tarayoun A., Le Roux-Mallouf R., Thapa B. B., et al.. Evidence of interseismic coupling 724
variations along the Bhutan Himalayan arc from new GPS data. Geophysical Research Letters, 725
American Geophysical Union, 2016, 43 (24), pp.12399-12406. ff10.1002/2016GL071163ff. 726
ffhal-01689807. 727
Meltzer, A., G. Sarker, B. Beaudoin, L. Seeber, and J. Armbruster (2001), Seismic 728
characterization of an active metamorphic massif, Nanga Parbat, Pakistan, Himalayan Geol., 729
29, 651 – 654, doi:10.1130/0091-7613. 730
Mir RR, Parvez IA, Gaur VK, Chandra R, Romshoo SA, 2017, Crustal structure beneath 731
the Kashmir Basin adjoining the western Himalayan syntaxis, Bulletin of the Seismological 732
Society of America 107 (5), 2443-2458. 733
Mona Lisa, Khwaja, A.A., Jan, M.Q. et al. (2009). New data on the Indus Kohistan 734
seismic zone and its extension into the Hazara–Kashmir Syntaxis, NW Himalayas of Pakistan. J 735
Seismol 13, 339–361. https://doi.org/10.1007/s10950-008-9117-z
Mukhopadhyay, Basab , Acharyya, Anshuman , Bhattacharyya, Debkumar , Dasgupta, 737
Sujit and Pande, Prabhas (2011) 'Seismotectonics at the terminal ends of the Himalayan Arc', 738
Geomatics, Natural Hazards and Risk, 2: 2, 159 — 181. 739
Mugnier, J.-L., Vignon V. , Jayangondaperumal R. , Vassallo R., Malik M.A., Replumaz 740
A., Srivastava R.P. , Jouanne F., Buoncristiani J.F., Jomard H., Carcaillet J., (2017) A complex 741
thrust sequence in western Himalaya: The active Medlicott Wadia Thrust, Quaternary 742
International, http://dx.doi.org/10.1016/j.quaint.2017.05.028. 743
Owen, L. A. (1989), Neotectonics and glacial deformation in the Karakoram Mountains 744
and Nanga Parbat Himalaya, Tectonophysics, 163, 227–265. 745
Pant, M.R. 2002. A step toward a historical seismicity of Nepal. Adarsa, 2, 29–60. 746
Pathier, E., Fielding, E., Wright, T., Walker, R., Parsons, B., and Hensley, S., 2006, 747
Displacement field and slip distribution of the 2005 Kashmir earthquake from SAR imagery, 748
Geophys. Res. Lett. 33, L20310. 749
Paul, H., Priestley, K. F., Powali, D., Sharma, S., Mitra, S., & Wanchoo, S. K. (2018). 750
Signatures of the existence of frontal and lateral ramp structures near the Kishtwar Window of 751
the Jammu and Kashmir Himalaya: Evidence from microseismicity and source mechanisms. 752
Geochemistry, Geophysics, Geosystems, 19, 3097–3114. 753
https://doi.org/10.1029/2018GC007597. 754
Pennock, E.S., Lillie, R.J., Zaman, A.S.H., Yousuf, M., 1989. Structural interpretation 755
of seismic reflection data from eastern Salt Range and Potwar Plateau. Pak. Am.Assoc. Pet. 756
Geol. Bull. 73, 841e857. 757
Sana, H., and Nath., S.K. 2016. In and around the Hazara-Kashmir syntaxis: a 758
seismotectonic and seismic hazard perspective, J. Ind. Geophys. Union ( September 2016 ) v.20, 759
no.5, pp: 496-505. 760
Sapkota, S., Bollinger, L., Klinger, Y., Tapponnier, P., Gaudemer, Y., Tiwari, D., 2013. 761
Primary surface ruptures of the great Himalayan earthquakes in 1934 and 1255. Nat. Geosci. 6, 762
71–76. http://dx.doi.org/10.1038/ngeo1669. 763
Satyabala, SP, ZH Yang and R Bilham (2012), Stick-slip advance of the Kohat Plateau 764
in Pakistan. Nat. Geosci. Version: 1 5 (2) 147-150, issn: 1752-0894, ids: 893ZU, doi: 765
10.1038/NGEO1373. 766
Savage J.C., 1983. A dislocation model of strain accumulation and release at a 767
subduction zone, J. geophys. Res., 88, 4984–4996. https://doi.org/10.1029/JB088iB06p04984. 768
Schiffman, C., Bali, B.S., Szeliga, W., Bilham, R., 2013. Seismic slip deficit in the 769
Kashmir Himalaya from GPS observations. Geophys. Res. Lett. 40, 5642–5645. 770
Seeber, L., Armbruster, J.G., 1981. Great detachment earthquakes along the Himalayan 771
Arc and long-term forecasting. In: Sibson, D.W., Richards, P.G. (Eds.), Earthquake Prediction: 772
An international review. American Geophysical Union. Maurice Ewing Series, 4, Amer. 773
Geophysical Union, pp. 259e277. http://dx.doi.org/10.1029/ME004p0259. 774
Seeber, L., and A. Pêcher (1998), Strain partitioning along the Himalayan arc and the 775
Nanga Parbat antiform, Geology, 26, 791 – 794, doi:10.1130/0091-7613(1998)026. 776
Serpelloni, E., R. Burgmann, M. Anzidei, P. Baldi, B. Mastrolembo Ventura, and E. 777
Boschi (2010), Strain accumulation across the Messina € Straits and kinematics of Sicily and 778
Calabria from GPS data and dislocation modeling, Earth Planet. Sci. Lett., 298(3–4), 347–360, 779
doi: 10.1016/j.epsl.2010.08.005. 780
Stevens, V. L., and J. P. Avouac (2015), Interseismic coupling on the main Himalayan 781
thrust, Geophys. Res. Lett., 42, 5828–5837, doi:10.1002/2015GL064845. 782
Thakur, V.C., Jayangondaperumal, R., Malik, M.A., 2010. Redefining Medlicott-783
Wadia’s main boundary fault from Jhelum to Yamuna, an active fault strand of the main 784
boundary thrust in northwest Himalaya. Tectonophysics 489, 29–42. 785
Vassallo, R., Mugnier, J.-L., Vignon, V., Malik, M. a., Jayangondaperumal, R., 786
Srivastava, P., Jouanne, F., Carcaillet, J., 2015. Distribution of the late-quaternary deformation 787
in northwestern Himalaya. Earth Planet. Sci. Lett. 411, 241e252. 788
http://dx.doi.org/10.1016/j.epsl.2014.11.030. 789
Vignon V, Mugnier J-L, Vassallo R, Srivastava P, Malik MA, Jayangondaperumal R, 790
Jouanne F, Buoncristiani JF, Carcaillet J, Replumaz A, Jomard H, (2016). Sedimentation close 791
to the active Medlicott Wadia Thrust (Western Himalaya) : How to estimate climatic base level 792
changes and tectonics, Geomorphology, http://dx.doi.org/10.1016/j.geomorph.2016.07.040. 793
Wang, L., Wang, R., Roth, F., Enescu, B., Hainzl, S., Ergintav, S., 2009. Afterslip and 794
viscoelastic relaxation following the 1999 M 7.4 Izmit earthquake from GPS measurements. 795
Geophys. J. Int. 178 (3), 1220–1237. 796
Wang, R., Schurr, B., Milkereit, C., Shao, Zh., Jin, M., 2011. An improved automatic 797
scheme for empirical baseline correction of digital strong-motion records. Bull. Seismol. Soc. 798
Am. 101 (5), 2029–2044. http://dx.doi.org/10.1785/0120110039. 799
Wang, K., Fialko, Y., 2014. Space geodetic observations and models of postseismic 800
deformation due to the 2005 M7.6 Kashmir (Pakistan) earthquake. J. Geophys. Res. 119, 7306– 801
7318. 802
Wang, R., Parolai, S., Ge, M., Jin, M., Walter, T.R., Zschau, J., 2012. The 2011 Mw 9.0 803
Tohoku Earthquake: comparison of GPS and strong-motion data. Bull. Seismol. Soc. Am. 804
http://dx.doi.org/10.1785/0120110264. 805