HAL Id: hal-02394347
https://hal.umontpellier.fr/hal-02394347
Submitted on 4 Dec 2019
HAL is a multi-disciplinary open access
archive for the deposit and dissemination of
sci-entific research documents, whether they are
pub-lished or not. The documents may come from
teaching and research institutions in France or
abroad, or from public or private research centers.
L’archive ouverte pluridisciplinaire HAL, est
destinée au dépôt et à la diffusion de documents
scientifiques de niveau recherche, publiés ou non,
émanant des établissements d’enseignement et de
recherche français ou étrangers, des laboratoires
publics ou privés.
Distributed under a Creative Commons Attribution| 4.0 International License
Pandion haliaetus
Flavio Monti, Olivier Duriez, Véronique Arnal, Jean-Marie Dominici, Andrea
Sforzi, Leonida Fusani, David Grémillet, Claudine Montgelard
To cite this version:
Flavio Monti, Olivier Duriez, Véronique Arnal, Jean-Marie Dominici, Andrea Sforzi, et al.. Being
cosmopolitan: evolutionary history and phylogeography of a specialized raptor, the Osprey Pandion
haliaetus. BMC Evolutionary Biology, BioMed Central, 2015, 15, pp.255.
�10.1186/s12862-015-0535-6�. �hal-02394347�
R E S E A R C H A R T I C L E
Open Access
Being cosmopolitan: evolutionary history
and phylogeography of a specialized
raptor, the Osprey Pandion haliaetus
Flavio Monti
1,2*, Olivier Duriez
1, Véronique Arnal
1, Jean-Marie Dominici
3, Andrea Sforzi
4, Leonida Fusani
2,5,
David Grémillet
1,6and Claudine Montgelard
1,7Abstract
Background: The Osprey (Pandion haliaetus) is one of only six bird species with an almost world-wide distribution. We aimed at clarifying its phylogeographic structure and elucidating its taxonomic status (as it is currently separated into four subspecies). We tested six biogeographical scenarios to explain how the species’ distribution and differentiation took place in the past and how such a specialized raptor was able to colonize most of the globe. Results: Using two mitochondrial genes (cyt b and ND2), the Osprey appeared structured into four genetic groups representing quasi non-overlapping geographical regions. The group Indo-Australasia corresponds to the cristatus ssp, as well as the group Europe-Africa to the haliaetus ssp. In the Americas, we found a single lineage for both carolinensis and ridgwayi ssp, whereas in north-east Asia (Siberia and Japan), we discovered a fourth new lineage. The four lineages are well differentiated, contrasting with the low genetic variability observed within each clade. Historical demographic reconstructions suggested that three of the four lineages experienced stable trends or slight demographic increases. Molecular dating estimates the initial split between lineages at about 1.16 Ma ago, in the Early Pleistocene.
Conclusions: Our biogeographical inference suggests a pattern of colonization from the American continent towards the Old World. Populations of the Palearctic would represent the last outcomes of this colonization. At a global scale the Osprey complex may be composed of four different Evolutionary Significant Units, which should be treated as specific management units. Our study brought essential genetic clarifications, which have implications for conservation strategies in identifying distinct lineages across which birds should not be artificially moved through exchange/reintroduction schemes.
Keywords: Accipitriformes, Aves, Cytochrome b, Evolutionary Significant Unit, Mitochondrial markers, Molecular dating, ND2, Subspecies
Background
The modern distribution of living organisms has been shaped by multiple processes that had profound effects on the dispersal, genetic structure and evolutionary his-tories of plant and animal populations. Movements of land-masses and successive multiple glacial events that occurred during the Pleistocene caused severe habitat
changes which confined many species to warmer refugia and led other taxa to experience demographic reductions or complete extinction [1]. Favourable periods during climatic fluctuations allowed successive population ex-pansions, together with the recolonization of portions of the ancient ranges [2].
Despite the high potential dispersive power of flying birds, it is striking that only a few taxa did colonize most of the world. Excluding seabirds, for which the distribu-tion pattern depends more on ocean basins than on the major land-masses [3], only six landbird species (out of ca. 10,000 species) are known to be cosmopolitan, breed-ing in each biogeographical region of the world, except
* Correspondence:flaviomonti00@gmail.com
1CEFE UMR 5175, CNRS - Université de Montpellier - Université Paul-Valéry
Montpellier - EPHE, 1919 Route de Mende, 34293 Montpellier cedex 5, France
2
Department of Life Sciences and Biotechnology, University of Ferrara, via Borsari 46, I-44121 Ferrara, Italy
Full list of author information is available at the end of the article
© 2015 Monti et al. Open Access This article is distributed under the terms of the Creative Commons Attribution 4.0 International License (http://creativecommons.org/licenses/by/4.0/), which permits unrestricted use, distribution, and reproduction in any medium, provided you give appropriate credit to the original author(s) and the source, provide a link to the Creative Commons license, and indicate if changes were made. The Creative Commons Public Domain Dedication waiver (http://creativecommons.org/publicdomain/zero/1.0/) applies to the data made available in this article, unless otherwise stated.
Antarctica. This group includes the Great Egret Ardea alba, the Cattle Egret Bubulcus ibis, the Glossy Ibis Plegadis falcinellus, the Barn Owl Tyto alba, the Peregrine Falcon Falco peregrinus and the Osprey Pandion haliaetus.
The Osprey is a medium-sized raptor with flexible breeding habitat requirements across its range. Des-pite its specialization as a piscivore, it is an opportun-istic forager that can feed in both freshwater and marine environments [4]. Northern populations are known to migrate long distances [4, 5], whereas indi-viduals from lower latitudes (e.g. Caribbean, Atlantic islands and Mediterranean basin) are mostly seden-tary, or perform small-scale interbreeding movements [4, 6]. One could therefore predict that such broad habitat tolerances and high mobility should homogenize genomes, limiting genetic differentiation across popula-tions at a continental level, as described in other wide-spread raptors (e.g. Haliaeetus albicilla: [7]; Falco peregrinus: [8]). However, adult ospreys tend to return to their natal area to breed [9] and such strong philo-patry may have played in favour of genetic structuring
among populations across the extensive range. Simi-larly, genetic differences may be expected between long-distance migratory and partially migratory/resi-dent populations.
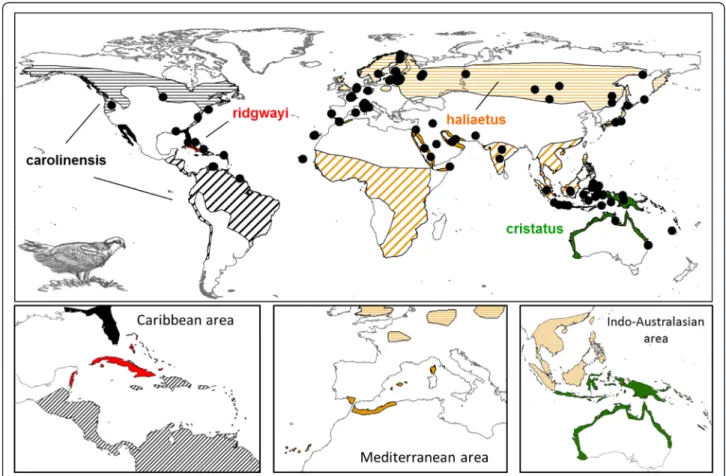
On the basis of comparative non-molecular characters such as osteology, pelvic musculature and the distribu-tion of feather tracts, the Osprey is considered suffi-ciently distinct from other raptor species (family Accipitridae; [10]) to merit a monotypic family (Pandio-nidae) [11, 12]. The most widely accepted taxonomic ar-rangement recognises four subspecies of Osprey: P. h. haliaetus(Linnaeus, 1758) in the Palearctic from Europe, northwest Africa, and Asia north of the Himalayas, P. h. carolinensis(Gmelin, 1788) in North America, P. h. ridg-wayi (Maynard, 1887) in Caribbean Islands, and P. h. cristatus(Vieillot, 1816) in the Indo-Pacific and Oceania (Fig. 1). The four subspecies were traditionally split on the basis of morphometry and plumage characteristics, but the differences are not straightforward [4, 13]. Therefore, referring only to morphology for describing diversity and interrelationships between subspecies has led to controversies in taxonomy.
Fig. 1 Geographical distribution of Pandion haliaetus. Ranges for the four recognized subspecies are in different colors: black for carolinensis, red for ridgwayi, orange for haliaetus and green for cristatus. Horizontal stripes are for breeding areas, skew lines for wintering areas and color-filled zones represent areas with sedentary populations. Black circles symbolize sample locations. In the small boxes (from left to right) three zones are zoomed in: Caribbean, Mediterranean and Indo-Australasian areas
In this context, using molecular markers is a powerful method for inferring the evolutionary history of the Osprey. Only two genetic studies have been carried out on this species [14, 15], but they did not investigate all subspecies, in the entire distributional range. Here, we carried out an extensive phylogeographic study based on mitochondrial DNA sequences (cytochrome b and ND2 genes) from samples covering the worldwide distribution of the Osprey. This exhaustive dataset allowed address-ing specific questions. a) Does the Osprey show any phy-logeographic structure in mitochondrial DNA at the continental level? b) How was such a specialized raptor able to colonize the entire world? We propose a hypo-thetical evolutionary scenario explaining how the spe-cies’ distribution and differentiation took place in the past. In the light of these new genetic clarifications, we discuss the potential implications for revisions of the taxonomy and for conservation (e.g. defining Evolution-ary Significant Units (ESUs; [16]) to design relevant con-servation strategies at the appropriate spatial scale.
Methods
Sampling, DNA sequencing and alignment
Sampling covered the whole species’ distributional range, with 204 individuals (114 fresh samples + 90 museum specimens) from 31 countries across five continents (Fig. 1; Additional file 1).
Fresh samples (n = 114; both blood and feathers) were obtained from wild ospreys at the nest during ringing ac-tivities in different breeding sites. For each individual, about 0.5 ml of blood was taken by venepuncture from the wing and stored either on filter blotting papers or in 70 % ethanol in Eppendorf tubes. In some cases, growing body feathers containing traces of blood within the calamus were collected and stored in envelopes.
For areas where it was not possible to collect fresh samples, we completed our sampling using 90 museum specimens. We collected small pieces of skin (about 2 mm from the toepad) from museum study Osprey-skins following the procedure described by Mundy et al. [17]. From each museum, we mainly choose museum study skins of various origins and collected during the breeding season, so excluding possible vagrants, winter-ing birds or disperswinter-ing animals.
From both fresh and museum specimens DNA was ex-tracted and amplified by PCR (see technical procedures below) for the mitochondrial Cytochrome b (cyt b) and NADH dehydrogenase subunit 2 (ND2). For the cyt b, five sequences from the GenBank database were also in-cluded, leading to a total of 209 sequences (see Additional file 1). For ND2 a subset of only 37 individuals returned high-quality PCR products to which we added one se-quence from GenBank, thus leading to a dataset of 38 in-dividuals (Additional file 1). Finally, four other raptor
species were used as outgroups: White-tailed eagle (Haliaeetus albicilla), Tawny eagle (Aquila rapax), Black-breasted buzzard (Hamirostra melanosternon) and Gray-headed kite (Leptodon cayanensis). The choice of these outgroups was motivated because 1) both cyt b and ND2 sequences were available in GenBank (see [11] for out-group accession numbers), and 2) they represent four line-ages of the Accipitridae family, the sister taxa of Pandionidae (including only Pandion haliaetus; [11]). The number of individuals and the length of sequences used for each analysis are reported in supplementary informa-tion (Addiinforma-tional file 2).
Total genomic DNA was extracted from fresh and his-torical samples using a Qiagen DNeasy Tissue kit, fol-lowing the manufacturer’s instructions (Qiagen, Hilden, Germany). To avoid contamination with contemporary DNA [18], all extractions from museum specimens were performed using the facilities of the platform “degraded DNA” (Labex CeMEB, Montpellier, France) dedicated to degraded DNA experiments, where we adopted the fol-lowing specific safety measures. Equipment, consum-ables and Qiagen DNeasy Tissue kits used in the platform were purchased new, while the room was regu-larly cleaned and exposed to UV overnight after each DNA extraction cycle, in order to destroy possible traces of DNA between successive extractions. Experimentators wore protective clothing and footwear. As a further pre-caution and following Bantock et al. [18], we worked with a maximum of 12 samples during each series of ex-traction to reduce the risks of cross-contamination and possible handling errors with tubes. We only used half of each foot-skin sample (about 10 mg of tissue) from which total DNA was extracted. Samples were incubated at least for one night at 56 °C to be digested during the lysis. The tissue was digested in 180 μL buffer ATL/ 20μL proteinase K solution for 20-h at 55 °C; other re-agents and the spin column were used according to the manufacturer's instructions ("Tissue protocol"), and final DNA elution was performed with 2 × 100 μL of 10 mM Tris, 0.5 mM HC1 pH 9.0 preheated to 70 °C. Multiple negative extraction and amplification controls were car-ried out simultaneously, using the same instruments and reagents, to detect possible contamination.
Portions of the mitochondrial cyt b and ND2 were amplified by PCR. Specific external and internal mito-chondrial cyt b and ND2 primers were designed in this study for Pandion haliaetus (Additional file 3). PCR was performed using 1-μl (fresh samples) to 3-μl (museum specimens) of total DNA extracted, 5-μl of the Qiagen Multiplex PCR kit (containing HotStarTaq DNA poly-merase, DNTPs and Multiplex PCR buffer), 1-μl for each primer at 2 pm and 2-μl of purified water. PCR reaction was performed using a MasterCycler Eppendorf thermo-cycler and began with an initial denaturation of 15 min
at 95 °C, followed by 30 cycles of 30 s denaturation at 94 °C, 90 s annealing at 54 °C, 1 min extension at 72 °C and a 30 min final extension at 60 °C. A mitochondrial cytochrome b 1040 nucleotides fragment was amplified with PANHF1 and PANHR5 primers; F13 and PHND2-R1 primers were used to amplify a ND2 nucleotide frag-ment of 1100 bp. In case of degraded DNA, we used internal primers to amplify cyt b and ND2 in 300 to 500 nucleotides overlapping fragments (see Additional file 3). Screening of the PCR products was performed by running on a 1 % agarose gel using GelRed TM nucleic Acid gel stain (Biotium). Size products have been compared to long fragments ladder from Eurogentec, Smart LadderTM. After band sizes were determined, PCR products were sequenced at the Genoscope (Evry, France).
Electrophoregrams were read using CodonCode Aligner 4.0.4 software and sequences were aligned by eye using Seaview 4 software [19]. Sequences were also translated into amino acids to check for any stop codons and possible amplification of pseudo-genes. Consensus sequences obtained for cyt b and ND2 from both fresh and museum samples were deposited in GenBank under accession numbers given in Additional file 1.
Partitioning and phylogenetic analyses
Phylogenetic relationships were inferred from the cyt b alone or from the concatenated cyt b + ND2 datasets. We determined both the best-fit partitioning scheme and the best models of sequence evolution using Parti-tionFinder 1.0.1 [20].
Phylogenetic trees were reconstructed using two prob-abilistic methods: Bayesian inference (BI) and maximum likelihood (ML). Bayesian analyses were performed with MrBayes 3.2 [21] using the partitioning strategy obtained with PartitionFinder (see also Results). Two separate runs of five million generations (sampled every 250 gen-erations) were conducted simultaneously. Tracer 1.5 [22] was used to check the convergence between the two runs and to determine the burn-in period. On this basis, the first 2000 phylogenetic trees were discarded (10 %), and the remaining 18000 trees were used to estimate posterior parameters and probability distributions. ML tree was constructed with RaxMl 8.0.17 [23]. As GTR is the only nucleotide substitution model available in RaxMl, GTR + G was applied to all partitions previously determined by PartitionFinder. The robustness of nodes was evaluated with 1000 bootstrap replicates with the option –b. The consensus tree was obtained using the program Consense of the Phylip 3.69 package [24].
Relationships between haplotypes were also visualized as a minimum spanning network, using the Median-Joining (MJ) network algorithm implemented in the pro-gram network 4.1.1.0 [25]. In order to avoid artefactual groupings due to missing data, the MJ network was built
considering the most complete dataset in terms of nu-cleotides and individuals, which is a fragment of 661 bp of the cyt b on 146 samples.
Genetic diversity, demographic history and molecular dating
We used Dnasp 5.10 [26] to compute the number of haplotype (nH), haplotype diversity (H), nucleotide di-versity (π) as well as the average number of nucleotide differences (k). Mean genetic distances within and be-tween groups were computed using the p-distance and a pairwise deletion for the gaps/missing data treatment, as implemented in the Mega 5.10 software [27].
Demographic history of the haplogroups and the whole dataset was determined with different methods. Firstly, R2 [28], Fu’s Fs [29] statistics and their significance were calculated with DnaSP. Ramos-Onsins & Rozas [28] recommended using R2 when population sizes are small (~10) and Fs when sample sizes are large (~50). The his-torical demography of main haplogroups was also esti-mated based on the cyt b dataset using the skyline plot method (BSP; [30, 31] implemented in Beast 1.8.0. BSP analyses were performed on each group (including all cyt bsequences) separately with the cyt b partitioned accord-ing to codon position and usaccord-ing the HKY + G model as se-quence evolution. The likelihood-ratio test performed with tree-puzzle 5.2 [32] rejected the strict molecular clock hypothesis (p < 0.05). BSP analyses were thus con-ducted using a lognormal-relaxed molecular clock with a substitution rate of 0.01973 per lineage per million years as estimated by Nabholz et al. [33] for the Osprey cyto-chrome b. Although this rate has been obtained for the third codon position we apply it because most substitu-tions (83.3 %) are located at this position in our dataset. Analyses were run for 50 million generations, sampled every 1000 generations, after discarding the first 10 % as burn-in. We used Tracer 1.5 to analyse the results and draw the BSPs.
Time of the most recent common ancestor (TMRCA) was estimated with Beast 1.8.0 based on 23 sequences (19 Osprey haplotypes and 4 outgroups) of the cyto-chrome b (661 positions). The whole alignment was par-titioned according to the three codon positions using a HKY + G model of sequence evolution. As previously, analyses were performed using a lognormal-relaxed mo-lecular clock using a substitution rate (ucld. mean) fol-lowing a normal prior distribution of mean 0.01973 [33] and a standard deviation of 0.005 to take into account some rate uncertainty. Two runs were performed, each of 50 million generations, sampled every 1000 genera-tions, and a 10 % burn-in was applied. The resulting tree files were combined with LogCombiner 1.8.0 and the maximum clade credibility tree (mean height) was obtained with Tree-Annotator 1.8.0.
Historical biogeography reconstruction
Probabilistic inference of ancestral range was performed using BioGeoBEARS [34] as implemented in R. We per-formed six different models [34, 35], to reconstruct the biogeographic history of Osprey across continents. Each analysis allows for a different subset of biogeographical possibilities, such as dispersal, vicariance and extinction (see [34, 35]). Accordingly, we tested the following models: Dispersal-Extinction Cladogenesis Model (DEC), Dispersal-Vicariance Analysis (DIVA), Bayesian inference of historical biogeography for discrete areas (BayArea) and the same models including the founder-event speci-ation parameter (‘j’), DECj, DIVAj and BayAreaj. Finally, statistical fit of the six different models were compared using a model choice procedure by means of the Akaike Information Criterion implemented in the R package BioGeoBEARS [34, 35].
As input tree, we used the ultrametric tree obtained from the MrBayes (Fig. 2a) analysis on the 19 haplotypes of the cyt b gene. We implemented a model including four broad geographic regions: America (A), Indo-Australasia (I), Asia (J) and Europe-Africa (E). The max-imal number of areas that could be occupied by one ter-minal grouping (that is ASIA, AMER, INDIA-AUS and EUR-AFR) was set to two. Analyses were conducted using a non-time-stratified approach under default set-tings [34]. These six models have been tested in the frame of three different scenarios. The scenario“S0” cor-responded to an unconstrained analysis without disper-sal matrix. In addition, we tested two alternative biogeographic scenarios by implementing two different geodispersal matrices. In the scenario “S1” we tested a passage from America to Indonesia-Australia (via the Bering Strait and Asian pacific coast) and then towards Asia and Europe-Africa areas in the rest of the Palearctic, whereas in the scenario“S2” the matrix used stipulated a direct dispersal from America to the Old World via the Atlantic Ocean, with a first colonisation of Europe, then extending to Asia and Indonesia-Australia (thus equivalent to a tree in which the AMER and EUR-AFR groups are sister taxa).
Results
Phylogenetic relationships
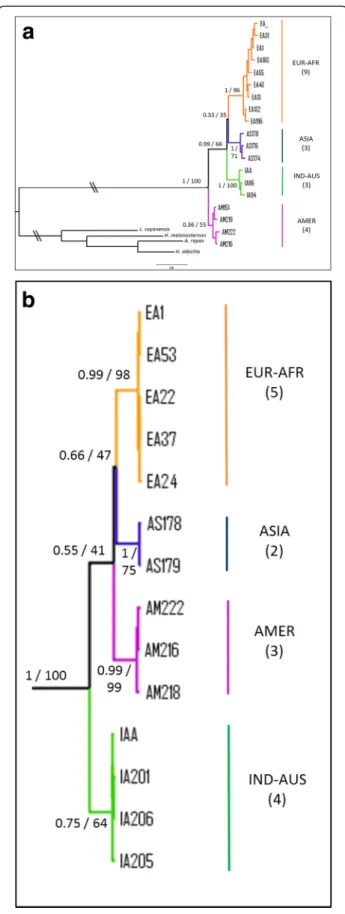
For the mitochondrial cyt b dataset (213 individuals = 209 ospreys + 4 outgroups), the best-fit scheme was a par-titioning according to codon position with the models HKY + I for position 1 (367 nucleotides), TrN for pos-ition 2 (368) and K80 + G for pospos-ition 3 (368). As the TrN substitution model was not available in MrBayes, the parameter Nst was set to 6. The partitioned ML analysis was performed with 1000 bootstrap replicates using a GTR + G substitution model for each codon position in RaxMl software. The average Bayesian
posterior probabilities (pp) and bootstrap values (BP) for supported clades are shown on the tree in Fig. 2. The phylogenetic tree including the totality of individ-uals (n = 209) is reported in supplementary informa-tion (Addiinforma-tional file 4).
Comparisons on cyt b sequences of ospreys (n = 146 individuals on 661 bp; see methods) returned 19 mtDNA haplotypes that were used to represent phylo-genetic relationships (Fig. 2a). This tree revealed the existence of four groups which represent quasi non-overlapping geographical lineages. A first clade (AMER; pp = 0.36, BP = 55) includes 5 haplotypes from 17 os-preys from the New World: 2 samples from the Pacific coast of USA (Oregon), 8 from the Atlantic coast of USA (Massachusetts and Virginia), 5 from the Carib-bean and 2 of unknown origins (one collected in Suriname, South America and the other one from USA without specification). No genetic structure was evi-denced and it can be noticed that Caribbean samples (supposed to form a separate group: ridgwayi ssp) be-long to two haplotypes which are scattered with other carolinensissamples (Fig. 3).
The second cluster (IND-AUS; pp = 1.00, BP = 100) is composed of 3 haplotypes including 16 individuals re-trieved from the Indo-Australasian area: 6 from various islands of Indonesia and 10 from Australia.
A third group was composed of 2 haplotypes and 11 ospreys from Asia (ASIA; pp = 1.00, BP = 71): 6 from the Pacific coast of Siberia (e.g. regions of Magadan, Khabarovsky, Primorskii and the Kurile islands) and five from Japan (Fig. 3). In addition, two samples that belonged to this haplogroup were collected in other geographic areas: one from continental Asia (Mongolia) and another one from the Indo-Australasian region (New Guinea).
Finally, the largest clade (EUR-AFR; pp = 1, BP = 96) was formed by 102 individuals representing 9 haplotypes, mainly belonging to the Western Palearctic area, with a few exceptions. 93 of these samples were collected in Eur-ope along a latitudinal gradient scattered from northern Europe (Fenno-Scandia and western Russia), central Europe (Germany, France), to southern localities in the Mediterranean area (Corsica, Balearics, Italy, Portugal). Samples from North African coasts (e.g. Morocco) and Atlantic islands (e.g. Canary and Cape Verde) were in-cluded in this haplogroup, together with ospreys from the Red Sea and Persian Gulf areas. Three single haplotypes identified particular geographical regions (Fig. 3): Canary Islands (4 individuals), Persian Gulf (2 ind.) and Red Sea (3 ind.). The remaining samples of the EUR-AFR group (93 ind.) mostly belonged to two frequent haplotypes. Interestingly, three geographical exceptions were recorded in this group: two individuals from central Siberia (Tuva and Baikal regions) and one from India.
In total, three potential mixing areas were detected be-tween phylogenetic lineages in the Old world (see Fig. 7): a) one in central Siberia between EUR-AFR and ASIA; b) one in Indonesia between ASIA and IND-AUS and c) a third one between west Indonesia and India between EUR-AFR and IND-AUS.
Despite the different sample sizes, mean genetic p-distances within groups (Table 1) were low and showed comparable values (p = 0.001 - 0.002), indicating limited genetic variability internal to each lineage. On the other hand, the greatest genetic differences between groups (Table 1) were recorded between AMER and EUR-AFR (p = 0.026), whereas lowest values were obtained between IND-AUS and ASIA (p = 0.015) and between IND-AUS and EUR-AFR (p = 0.017). At the same time, distance be-tween AMER and IND-AUS was smaller (p = 0.020) than those between AMER and ASIA (p = 0.025).
Relationships between the four haplogroups did not appear well resolved. The structure of the cyt b phylo-genetic tree (Fig. 2a) revealed that the three Old World lineages (EUR-AFR, ASIA and IND-AUS) formed a ra-ther well supported grouping (pp = 0.99, BP = 66) leav-ing the AMER group as the basal clade. On the other hand, the sister group relationships between EUR-AFR and ASIA is poorly supported (pp = 0.33, BP = 35). In order to improve resolution between groups we se-quenced the ND2 gene for a subsample of 39 individ-uals (Additional file 4b). The concatenation of the two mitochondrial fragments represented 2037-bp and pro-vided fourteen haplotypes from thirty-eight sequences (Additional file 1). Four partitions were obtained for the best-fit scheme: one for the position 1 of cyt b (with the model K80 + G), one for the cyt b-position 2 and ND2-position 3 (model HKY + I), one for the cyt b-position 3 and the ND2-position1 (model TrN) and one for the ND2-position 2 (model K81uf + G). As previously stated, the TrN model was approximated with Nst = 6 in MrBayes. The analysis carried out on the two genes (Fig. 2b for the 14 haplotypes and Additional file 4c for the 38 individuals) reinforced the support for the four main lineages, although it should be noted that the ASIA group was now repre-sented only by five samples from Japan. Even though the number of nucleotides has been doubled, the only no-ticeable gain is a slight increased support for the node
Fig. 2 Bayesian phylogenetic trees of ospreys constructed from: a 19 haplotypes of cytochrome b (661 nucleotides); b the concatenated genes (cyt b + ND2; 2037 nucleotides, 14 haplotypes). In both trees, four species (Accipitridae family) were used as outgroups. Branch lengths are proportional to the number of substitutions per site and \\ means that branches leading to outgroups have been reduced. For the four main clades the geographic origin of the samples is indicated by different colours and the number of haplotypes is given into parentheses. For supported clades, Bayesian posterior probabilities and ML bootstrap are indicated at nodes, respectively
EUR-AFR/ASIA (pp = 0.66, BP = 47) whereas other re-lationships, including the position of the root, remained unresolved.
Network, genetic variability and demography
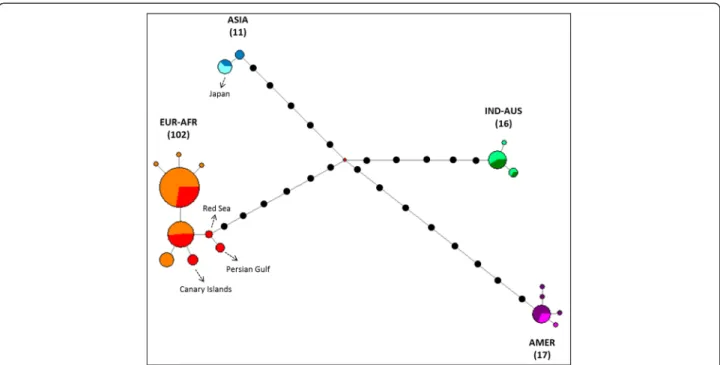
The cyt b network (Fig. 3) confirmed that four major groups which were included in 19 unique mtDNA hap-lotypes. The EUR-AFR clade (n = 102) resulted in nine haplotypes differing by only one nucleotide change. Two out of the nine haplotypes were most frequent, and shared by the majority of the individuals (58 and 25 indi-viduals, respectively). Despite remarkable differences in breeding and movement ecology, Osprey populations of lower latitudes within the EUR-AFR did not show not-able haplotypic differences when compared to the
northern and central European birds. The four samples from the Canary Islands shared a single haplotype (Fig. 3). Within the IND-AUS group (n = 16) only three haplotypes were found, differing by only one nucleotide position. Five haplotypes were observed within the AMER group and 13 samples out of 17 showed the same haplotype, which was shared by ospreys from both west-ern and eastwest-ern USA and from the Caribbean. Finally, within the ASIA group (n = 11) two haplotypes were re-corded. The five samples from Japan were characterized by a single haplotype, which was shared with 2 samples from East Siberia.
Despite slight variation within each group (haplotypes were mainly distant by only one or two positions), a lar-ger number of nucleotide differences were recorded be-tween clades. The AMER group recorded the greatest genetic distance with EUR-AFR (a minimum of 15 nu-cleotides changed), whereas the minimum number of changes is 11 positions between IND-AUS and ASIA (Fig. 3).
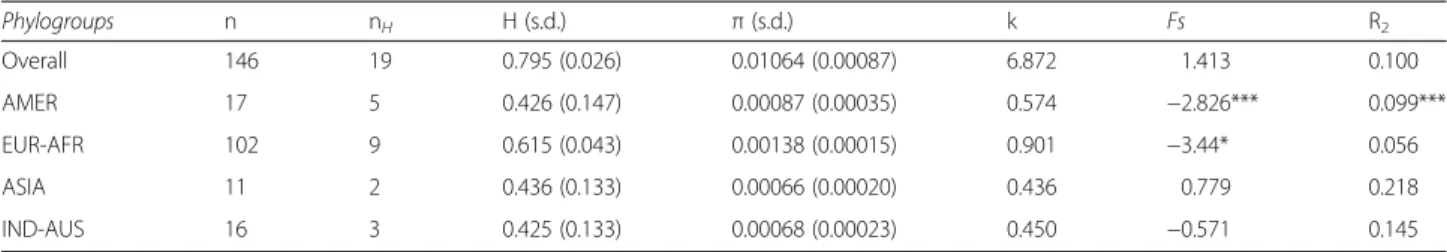
In the subset of 146 ospreys, 34 polymorphic segregat-ing sites were discovered within the 661 bp cyt b frag-ment. The haplotype diversity (H), nucleotide diversity (π) and other statistics were computed for the four rec-ognized haplogroups and the whole dataset combined (Table 2). Haplotype diversity was higher in the largest
Table 1 Uncorrected pairwise (p)-distance expressed as percentage (%) for cyt b within (in bold) and between clades in Pandion haliaetus. The number of individuals analzed for each group is given into parentheses
IND-AUS EUR-AFR AMER ASIA IND-AUS (37) 0.1
EUR-AFR (131) 1.7 0.1
AMER (26) 2.0 2.6 0.1
ASIA (15) 1.5 2.1 2.5 0.2
Fig. 3 Phylogenetic network of Osprey based on 146 individuals and 661 pb of the cyt b. Coloured pies chart indicate different haplotypes with size proportional to the number of individuals. Within each clade, different colours have been used to show the origin of samples: within the EUR-AFR clade, orange is for North and central Europe, whereas red is for Mediterranean, Atlantic Islands and Middle East areas; within the ASIA clade, blue is for Siberia and pale blue for Japan; within the IND-AUS clade, dark and light green are for Indonesia and Australia, respectively; within the AMER clade, violet is for North America and fuchsia for Caribbean. Haplotypes of particular interest (e.g. Japan, Canary Islands, Persian Gulf and Red Sea) are indicated by dotted arrows. Black dots represent missing haplotypes. The median vector is reported with a red dot. The number of individuals is indicated into parentheses for each group
group of EUR-AFR (H = 0.615) and lower for the three other groups (range: 0.425-0.436). The nucleotide diver-sity showed similar patterns between groups, being very weak in each lineage (range: 0.00066-0.00138). Overall, H was 0.795 and π was 0.0106 for all Pandion samples. Demographic history of the four phylogroups, as in-ferred on the basis of Fu’s FSand R2 statistics (Table 2),
indicate that only the AMER group yielded very signifi-cant values for both indices, whereas the EUR-AFR lineage showed a significant value for the Fu’s FS only. Thus, population expansion can be assumed for the American and possibly for the Western Palearctic groups. By comparison, Bayesian skyline plots (Fig. 4) in-dicated that the two haplogroups AMER and IND-AUS remained demographically stable whereas the EUR-AFR haplogroup showed a trend of demographic expansion starting >10,000 years ago. Conversely, the ASIA hap-logroup was the only one showing a pattern of demo-graphic decline although demodemo-graphic stability cannot likely be ruled out (Fig. 4).
Molecular dating and biogeographical inference
Diversification for each of the four groups was dated be-tween 0.14 and 0.27 Ma, that is during the Upper Pleis-tocene. Among the four lineages, the initial split that individualized the AMER group occurred about 1.16 Ma in the Early Pleistocene (Fig. 5). Subsequent events con-cerned firstly the divergence of the IND-AUS group at 0.73 Ma whereas the last divergence event that gener-ated the ASIA and EUR-AFR clades occurred at about 0.64 Ma. These two last events can be considered as nearly concomitant considering the large overlapping of the divergence dates (see 95 % HPD on Fig. 5).
Among the six models tested in biogeographic infer-ence, the ancestral area reconstruction method using the likelihood dispersal-vicariance analysis with the founder parameter (DIVAj) had a higher probability of being the best model for each of the three scenarios tested (Table 3). With this model, the proposed scenario “S1” returned the best likelihood values. The “j” parameter for founder-event significantly increased the likelihood
Table 2 Estimates of across and within-population variability of cyt b sequences of Osprey mtDNA
Phylogroups n nH H (s.d.) π (s.d.) k Fs R2 Overall 146 19 0.795 (0.026) 0.01064 (0.00087) 6.872 1.413 0.100 AMER 17 5 0.426 (0.147) 0.00087 (0.00035) 0.574 −2.826*** 0.099*** EUR-AFR 102 9 0.615 (0.043) 0.00138 (0.00015) 0.901 −3.44* 0.056 ASIA 11 2 0.436 (0.133) 0.00066 (0.00020) 0.436 0.779 0.218 IND-AUS 16 3 0.425 (0.133) 0.00068 (0.00023) 0.450 −0.571 0.145
Sample size (n), number of haplotypes (nH), haplotype diversity (H), nucleotide diversity (π), and the average number of pairwise differences (k). The value of the Fu’s Fs test and R2 of Ramos-Onsins & Rozas [28] are also reported; stars indicate significant values (*p < 0.05 and ***p < 0.001)
Fig. 4 Bayesian skyline plots showing the demographic histories of the four main haplogroups identified in the Pandion haliaetus sequences. On the x-axis the (inversed) time is expressed in years. The population size (expressed in units of Neτ, the product of the effective population size per generation length) is reported on the y-axis. The number of individuals analyzed for each group is given into parentheses
of the model (DIVA lnL =− 10.3, DIVA + j lnL = − 7.3, P= 0.013) because “j” was estimated to be greater than zero (j = 0.108) whereas the estimated rate of both dis-persal and extinction was essentially zero (d = 0; e = 0; Fig. 6; Table 4). The ancestral reconstruction (Fig. 6) thus favoured the scenario in which the radiation of Pandion started from America and expanded towards the Old World with subsequent founder events (j); the an-cestor (AI) first diversified in the Indo-Australasian area by vicariance and then underwent a range expansion to occupy the Eastern Asia (J) and Western Palearctic (E).
Discussion
Species diversity and demography
Our study revealed that the Osprey is structured into four main genetic groups, representing quasi non-overlapping geographical regions. Each lineage, though including birds from distant geographic areas, showed
low internal genetic variability as revealed by the very low values (range: 0.1-0.2 %; Table 1) observed for the mean intra-group genetic distances. Haplotypic and nu-cleotide diversities were also weak, with only 9 haplo-types observed for the largest group including 102 ospreys (EUR-AFR), and values were even smaller for the other three lineages (Table 2). The two most com-mon haplotypes in the clade EUR-AFR showed high overlap in ranges (e.g. individuals from very distant pop-ulations, like Finnish and Moroccan birds, were included in the same haplotype). A marked geographic substruc-turing was recorded only for individuals of the Canary Islands, Red Sea and Persian Gulf areas, each one repre-senting a single haplotype (even if sample size is low; Fig. 3).
Despite the low variation within each group, the net-work (Fig. 3) revealed a high number of nucleotide dif-ferences between the four distinct clades. Overall, the
Fig. 5 Chronogram obtained with BEAST 1.8.0 showing the time of divergence for the diverse splits in Pandion haliaetus using a substitution rate of 0.01973 ± 0.005 per lineage per million years. Values between brackets at nodes indicate 95 % highest posterior densities. The colour code used for each haplogroup is the same as in previous figures. A partial geological time scale is reported below the chronogram (H = Holocene)
Table 3 Comparison of the six biogeographical reconstruction models for three different scenarios (“S0”, “S1”, “S2”; see text for definition)
Scenario S0 Scenario S1 Scenario S2
Model lnL AIC ῳi lnL AIC ῳi lnL AIC ῳi
DEC −13.984414 31.97 0.042 −13.072694 30.15 0.018 −14.54651 33.09 0.55 DEC + J −9.861326 25.72 0.96 −8.059002 22.12 0.98 −13.75296 33.51 0.45 DIVALIKE −11.852773 27.71 0.11 −10.371666 24.74 0.11 −13.23454 30.47 0.66 DIVALIKE + J −8.73571 23.47 0.89 −7.315617 20.63 0.89 −12.90696 31.81 0.34 BAYAREALIKE −17.770147 39.54 0.0047 −18.357268 40.71 0.0002 −19.58099 43.16 0.025 BAYAREALIKE + J −11.405964 28.81 1 −8.920927 23.84 1 −14.90445 35.81 0.98
For each model of each scenario are indicated the log-likelihood (lnL), the Akaike information criterion (AIC) values, and the Akaike weightῳi(indicating the relative
likelihood of the model). The model with lowest AIC value is marked in bold font and the most likely scenario is underlined. DEC = Dispersal-Extinction Cladogenesis; DIVA = Dispersal-Vicariance Analysis; BAYAREALIKE = Bayesian inference of historical biogeography for discrete areas; j = founder-event speciation parameter
mean sequence divergence across all populations (the entire Pandion mix) is 1.2 %, which is higher than the values recorded for the Red kite Milvus milvus (0.75 % observed for the mitochondrial DNA control region; [36] or the white-tailed eagle Haliaeetus albicilla (0.7 % for mitochondrial DNA control region; [7]). The mean genetic distance between groups (range: 1.5-2.6 %) is comparable to, or even greater than, those observed for the mitochondrial cyt b in several members of closely related sister eagle species from the genera Aquila, Hieraaetus (range: 1.7-2.1 %; [10]) and Haliaeetus (range: 0.3-9.8 %; [37]).
Populations within each group were poorly differenti-ated, suggesting that they might have experienced a re-duction of genetic variation. Such low values are usually related to populations that experienced demographic crashes or remained isolated in fragmented habitats [38, 39]. However, the historical demographic reconstruction for each lineage suggested that they did not experience any strong bottleneck phases (Fig. 4), but rather under-went stable trends or slight increases.
For the EUR-AFR clade, Bayesian skyline curves (Fig. 4) suggest that populations encountered a recent expan-sion, which probably started about 10,000 years ago. This fits well with a recent review of the Holocene fos-sils of Osprey in central Europe from 10,000 years BP [40]. In Europe, the Osprey expanded its distribution area in the following centuries until the beginning of the 20th century. Then, despite declines during the 1960-70s, populations were able to recover, showing positive demographic trends in most areas [41]. On the other hand, the ASIA clade seems to be the only one that poten-tially suffered some demographic decline (Fig. 4). The same trend is also suggested by very low nucleotide diversity and a positive Fs value. However, such values might also be re-lated to the small sample size of this group (15 samples). This result needs hence to be confirmed by further ana-lyses with more extensive sampling from East Asia.
Why then does each clade show such low genetic variability? Low levels of genetic variation can be the consequence of recent population declines, or repre-sent an ancestral condition, inherited from an ancient evolutionary history [42]. To bring support to these two hypotheses, we compared haplotype diversity be-tween museum and fresh specimens among the EUR-AFR group (n = 102). We found that for 10 oldest mu-seum specimens (dated between 1872 and 1959; see Additional file 1), most haplotypes (7 out of 9) are also represented in the fresh samples, thus suggesting that there has been no recent loss of haplotypic diversity. Several studies have also reported stable genetic diver-sity despite declines in population size (e.g. [43]). For example, no obvious loss of genetic diversity was detected among Canadian peregrine falcons (Falco
Fig. 6 Ancestral-area estimations (above nodes) for Pandion evolution, using the unconstrained DIVA + J model in BioGeoBEARS, according to the selected scenario“S1”. Letters represent the areas used for the biogeographical reconstructions: A = America (violet), I = Indo-Australasia (green), J = Asia (blue) and E = Europe-Africa (orange); in red the common ancestor between A and I. Outgroup species used to root the tree are not shown
Table 4 Details of parameter estimations (dispersal (d), extinction (e), and founder-event speciation (j)) from the analyses of biogeographic inference of scenario S1 in BioGeoBEARS.The model with lowest AIC value is marked in bold font
Model lnL Number of Parameters AIC d e j DEC −13.072694 2 30.145388 4.67e-02 1.59e-02 0.000000 DEC + J −8.059002 3 22.118004 1.00e-12 1.00e-12 0.126265 DIVA −10.371666 2 24.743332 4.30e-02 1.00e-12 0.000000 DIVA + J −7.315617 3 20.631234 1.00e-12 1.00e-12 0.1079407 BayArea −18.357268 2 40.714536 5.90e-02 7.31e-02 0.000000 BayArea + J −8.920927 3 23.841854 1.00e-07 1.00e-07 0.1458791
peregrinus) despite a population bottleneck in the 20th century [44]. In our case, one possible explanation is the colonization of new areas by few individuals carry-ing only a few mitochondrial lineages from the genetic pool (founder effect). Furthermore, source populations could have experienced a reduction in genetic variabil-ity due to climate fluctuations during the Quaternary; remnant populations in refugia represented the genetic source for the following recolonization (see below).
Phylogenetic inferences
The cyt b phylogenetic tree (Fig. 2a and Additional file 4a) suggests that the AMER haplogroup constitutes the first genetic group that emerged among the four groups evi-denced for Pandion haliaetus. This relationship is more supported by the cyt b alone (1103 bp) than by the ND2 alone (1078 bp; Additional file 4b). Moreover, the combin-ation of cyt b and ND2 (2037 bp, Fig. 2b) did not increase markedly the resolution, thus suggesting that the diver-gence of the four major clades occurred over a relatively short time period. Another explanation could be that ir-resolution arose as a misplacement of the root of the tree due to the use of too divergent outgroups. Indeed, there are no optimal outgroups available for the phylogeny root-ing of Pandion, since it constitutes a long branch in the phylogeny of raptors, distant from its sister Accipitridae family [11, 45]. In preliminary analyses we also included other outgroups such as Sagittarius serpentarius and/or different species from the Cathartidae family, but no evi-dent improvements in branching were recorded. Similar problems of rooting have been reported in other phylo-geography studies [46, 47].
Nevertheless, other arguments can be advocated to reinforce the hypothesis that the Osprey originated in the New World (step 1 in Fig. 7). First, the oldest recog-nized Osprey specimen is a Pandion homalopteron of the mid-Miocene of California dated at 13 Ma [4]. This is in accordance with our molecular dating which esti-mated at ca. 10.69 Ma (95 % HPD: 19.59-3.70) the origin of a first ancestor for Pandion sp (Fig. 5). In addition, as far as we know no fossil was found in Australia (where the species is frequent today), whereas seven fossils from late Pleistocene have been found in Florida [40]. Second, calculation of the p-distances between groups (Table 1) indicates that the AMER group is the most divergent compared to the other three groups, suggesting its more ancient origin (and a closer relationship with IND-AUS group). Our molecular dating estimated at 1.16 Ma (Pleistocene) the diversification of Pandion haliaetus. Further, the phylogenetic trees (see also scenario“S2” in Table 3) did not support a sister group relationship be-tween AMER and EUR-AFR, as it would be expected in the case of a direct colonization from America to Europe (across the Atlantic Ocean). On the contrary, a pro-nounced phylogenetically old separation between Ameri-can and Western Palearctic populations emerged, in accordance with previous studies [10, 15].
Biogeographic inferences
The major result yielded by phylogeographic inferences is a split of Pandion in four clades that appear to have diverged from each other within relatively short time. Because of the uncertainty with regard to the relative
Fig. 7 Geographical distribution of the four haplogroups of Pandion haliaetus. Symbols and colours indicate both sample locations and genetic group: violet squares for AMER, orange circles for EUR-AFR, blue stars for ASIA and green triangles for IND-AUS (see results). Numbers with their corresponding arrows describe the different phases of the hypothetical colonization scenario
branching order of these clades (see Results), patterns of colonization phases should be considered as tentative.
The best biogeographical scenario supports America as the most likely area of origin of Pandion (step 1 Fig. 7). The selected model (DIVAj) favours an expan-sion of Osprey populations that underwent diversi-fication by subsequent founder events followed by vicariance processes. Synthetically, from America, Osprey should have colonized the Indo-Australasian re-gion passing through the Pacific coast of Asia (step 2 Fig. 7). From refugia located in Indonesia-Oceania, rapid range expansion allowed the settlement in eastern Asia and the Western Palearctic (Fig. 5, Fig. 6, step 3 Fig. 7). As a supporting case, cyt b data suggest that Japan was likely colonized after Russia and not directly from Australia. Such a scenario would explain the current dis-tribution of Pandion across all continents and the genetic divergence found among the four lineages. This hypothesis is corroborated by the p-distances which displayed lower values between AMER and IND-AUS (p = 0.020) than those recorded between AMER and EUR-AFR (0.026). This result indicates that the EUR-AFR group did not ori-ginate directly from the AMER group, as also suggested by the lowest likelihood values yielded by the alternative biogeographical reconstruction (scenario “S2” in which EUR-AFR would have been colonized from AMER; Table 3).
Implications for taxonomy and conservation
The four genetic groups that we found do not entirely correspond to the four subspecies described, based on morphological characters [4, 13]. The IND-AUS lineage fully matched geographically with the subspecies crista-tus[48]. Contrary to current taxonomy, North American carolinensis ospreys did not differ from Caribbean ridg-wayibirds as there is no evident structure in the phylo-geographic tree and in the network. On the other hand, in Eurasia, we discovered that the subspecies haliaetus was actually composed of 2 lineages (EUR-AFR and ASIA) that are undistinguishable morphologically. This reflects the poor knowledge of the species in Asia where detailed information about biology and distribution are needed [49]. More samples should be collected to clarify the geographical limits of these lineages, especially in the regions where we found a zone of overlap (e.g. cen-tral Siberia with EUR-AFR clade and in Indonesia with IND-AUS clade).
Overall, genetic distances between Osprey clades (Table 1) are in a range which has already been used by taxonomists for designating distinct raptor species (e.g. [37]). However, we detected a relatively low overall nu-cleotide diversity (1.0 %) compared to other large raptor species with a similar wide distribution (e.g. Gypaetus barbatus, 2.9 % for the control region; [46]; but see [7]
for Haliaetus albicilla, 0.7 %). It might be objected that more variability would potentially have been found by including more geographic samples for the different clades. However, if we consider the EUR-AFR clade (131 individuals covering a large geographic area), the vari-ability was as weak as for other groups that are repre-sented by a much smaller number of birds (15 to 37). The decision for splitting ospreys into different species (e.g. the split of P. h. cristatus as a full species called Eastern Osprey; [50]) should integrate also other factors besides morphology and mtDNA differences; e.g. nuclear genes and behavioural aspects, including migrations that could play an important role as reproductive barriers between distant populations [50].
A first step towards a sound global management and conservation plan is to define Management Units (MUs) and Evolutionary Significant Units (ESUs; [16]). As a matter of fact, subspecies have often been used as prox-ies for units of conservation in absence of a genetic data indicating distinct evolutionary units [51]. Our results evidenced four different lineages that may deserve the status of ESUs for specific management actions. A better knowledge of the distribution range of each lineage is strongly needed in the near future. In particular, the ASIA lineage should be a priority target for multiple rea-sons: 1) this lineage has never been described before; 2) it relied on a limited number of samples (n = 15) from only a few areas; 3) the majority of the samples analysed were museums specimens, so the current presence of this lineage in East Russia and Indonesia needs to be confirmed; 4) it is the only one clade showing signals of demographic decline; and 5) no clear morphological characteristics can presently help identification.
Conclusions
Our study revealed that, at the global scale, the particu-lar evolutionary history of the Osprey has partitioned the species into 4 distinct clades with clear genetic dif-ferentiation. In addition, our findings indicate that broad habitat requirements and high mobility of Osprey were more important factors than philopatry in shaping gen-etic diversity at the intra-clade level. Further gengen-etic study using microsatellite markers are ongoing (Monti et al., in prep.) in order to reveal more recent differences and to quantify gene flow among populations that show differences in migratory or reproductive behaviours (e.g. North and Central European populations vs Mediterranean, Canary Islands, Cape Verde and Red Sea).
Even though the Osprey is currently globally listed as “Least Concern” according to IUCN criterions [52], it is considered a priority species for conservation across its distributional range. Indeed, the Osprey is taxonomically unique and conserving its phylogenetic diversity should be a priority [53–55]. The species experienced a severe
decline during the 19th and 20th century that led to significant demographic declines and local extinctions [56–58]. Consequently, the Osprey has emerged as an important flagship species and during recent decades has been involved in 25 reintroduction projects in the USA [9, 58] and in Europe [57, 59]. Our results suggest that future reintroduction projects should be con-ducted using source populations from the same lineage (e.g. within Europe birds chosen for translocation should originate from the Western Palearctic, avoiding individuals belonging to the other lineages). However, before concluding that no restriction needs to be adopted for translocations between populations within the Western Palearctic, other ecological, demographical or behavioural variables should be considered.
Ethics statement
A specific ethical committee was not required for this study. Bird handling was performed under animal experi-mentation permits 34–369 (David Grémillet) delivered by the French‘Direction Départementale de la Protection des Populations’ and under the licence of Olivier Duriez from the Centre for Bird Population Studies (CRBPO) of the Natural History Museum (MNHN, Paris): according to the French law of 22 September 2008, the CRBPO has the delegation by the Ministry of Ecology, Energy, Sus-tainable Development and Land Settlement for allowing the owners of a general bird ringing licence to capture and handle birds from protected species, and collect samples or mark them (with rings or any other device like GPS units).
Availability of supporting data
The data set supporting the results of this article is included within the article and its additional files“Additional files 1, 2, 3 and 4.docx”. Nucleotide sequences have been submit-ted to GenBank and accession numbers are provided in Additional file 1. Alignments used for each analysis (please refer to the table in Additional file 2 for matching) have been included as Additional file 5.
Additional files
Additional file 1: Taxon sampling. Detailed list of the 209 Osprey samples indicating: sample lab code, subspecies according to morphology classification, country of collection, locality, sample type (tp = toepad; wb = wet blood; db = dry blood; ft = feather; fs = fasta sequence), codes, gene bank number accession for cyt b and ND2) and name of the institution and/or collector (with affiliation). (DOC 370 kb)
Additional file 2: Sampling for analyses. Number of individuals (N) and sequence length (L in base pairs) used for each analysis (phylogeny and network) and for each gene or concatenation of genes. nd means not done. (DOC 29 kb)
Additional file 3: DNA amplification. Cytochrome b and ND2 primer names and sequences for amplification and sequencing. (DOC 32 kb)
Additional file 4: Phylogenetic trees of cytb, ND2 and cyt b + ND2. Bayesian phylogenetic trees of ospreys constructed from: a) the cytochrome b (209 sequences, 1103 nucleotides) showing the four supported clades as well as the geographic origin of the samples; b) the ND2 (39 sequences, 1078 nucleotides) and (c) the concatenated genes (cyt b + ND2; 38 sequences, 2037 nucleotides). In all the trees, four species belonging to the Accipitridae family were used as outgroups. Branch lengths are proportional to the number of substitutions per site and \\ means that branches leading to outgroups have been reduced. For supported clades, bayesian posterior probabilities and ML bootstrap are indicated at nodes, respectively. (DOC 182 kb)
Additional file 5: Alignments used for each analysis: SI1 = cyt b (209 sequences, 1103 nucleotides); SI2 = ND2 (39 sequences, 1078
nucleotides); SI3 = cyt b+ND2 (38 sequences, 2037 nucleotides); SI4 = cyt b (19 haplotypes, 661 nucleotides); SI5 = cyt b+ND2 (14 haplotypes, 2037 nucleotides); SI6 = cyt b network (146 sequences, 661 nucleotides). Refer to the table in Additional file number 2 for matching. (ZIP 27 kb) Competing interests
The authors declare that they have no competing interests. Authors’ informations
Flavio Monti is a PhD student both at the University of Ferrara (Italy) and University of Montpellier (France). His research interests concern the evolutionary biology, behaviour and conservation of raptors. He began this study as part of his doctoral dissertation. The general interest of the research team is concerned with the dynamics and management of biodiversity that have direct applications for the conservation biology of vertebrates. Authors’ contributions
FM, OD and CM designed the study and performed much of the initial research. FM, JMD, OD and AS carried out part of the sampling. FM and VA performed laboratory manipulations and DNA sequencing; FM and CM analysed the data; FM, CM and OD wrote the manuscript; AS, LF and DG have been involved in revising the manuscript critically for important intellectual content. All authors read, discussed, corrected and approved the final version of the paper.
Acknowledgements
We thank all the colleagues who kindly provided Osprey samples: Pertti Saurola, Harri Koskinen and Juhani Koivu (Finland), Urmas Sellis (Estonia), Aigars Kalvāns (Latvia), Miroslav V. Babushkin and Vladimir V. Ivanovsky (Russia), Martin Haase and Daniel Schmidt (Germany), Rolf Wahl, Franҫois Gossmann and Eric Pasquet (France), Luis Palma and Ursula Hofle Hansen (Portugal), Manuel Siverio (Canary islands), Pedro López-Suárez (Cape Verde), Houssine Nibani (Morocco), Rafel Triay Bagur (Balearic islands). Special thanks to Yula Kapetanakos and Alan Poole (Cornell lab of Ornithology, Ithaca, USA) for collecting and performing free analyses of 10 samples from the USA. Many thanks are also addressed to the following museums and birds’ collection curators who allowed us to gather samples from their collection: Mark Adams (Natural History Museum of London; UK), Steven van der Mije and Bechy Desjardins (Netherlands Centre for Biodiversity Naturalis of Leiden), Isao Nishiumi (National Museum of Nature and Science of Amakubo; Japan), Mikhail Kalyakin, Pavel Tomkovitch, Yaroslav Red’kin (Zoological Museum of Moscow; Russia), Guillermo Delgado (Museo de la Naturaleza y el Hombre of Tenerife Island; Spain) and Enrico Borgo (Museo Civico di Storia Naturale Giacomo Doria di Genova; Italy). We also thank the Portuguese Navy and in particular the contra-almirante José Luís Branco Seabra de Melo (Head of Cabinet of the Navy Chief of Staff) and the capitão-de-mar-e-guerra José Jaime Gonçalves Ribeiro (Director of the Vasco da Gama Aquarium) for providing historical samples of Portuguese ospreys. All extractions from museum specimens were performed using the facilities of the platform “ADN dégradé” (Labex CeMEB, Montpellier, France) coordinated by Christelle Tougard. Sequencing was supported by the project SEQMED attributed to CM by the“Bibliothèque du Vivant” sequencing project (CNRS-INRA-MNHN). Alan Poole provided valuable comments and improved the English of earlier drafts. This study was funded thanks to a grant from the Foundation Prince Albert II de Monaco and the Associazone italiana delle Fondation Prince Al-bert II de Monaco ONLUS. It also benefits from the support of the Parc Nat-urel Régional de Corse, Maremma Regional Park and Conservatoire du
Littoral (through the Mediterranean Small Islands Initiative PIM). F. Monti is supported by a grant of the Maremma Regional Park (Italy) and by a mobility grant of the Università Italo Francese/Université Franco
Italienne (UIF/UFI). Author details
1CEFE UMR 5175, CNRS - Université de Montpellier - Université Paul-Valéry
Montpellier - EPHE, 1919 Route de Mende, 34293 Montpellier cedex 5, France.2Department of Life Sciences and Biotechnology, University of
Ferrara, via Borsari 46, I-44121 Ferrara, Italy.3Réserve Naturelle Scandola, Parc Naturel Règional de Corse, 20245 Galeria, France.4Maremma Natural History
Museum, Strada Corsini 5, 58100 Grosseto, Italy.5Department of Cognitive Biology, University of Vienna, & Konrad Lorenz Institute for Ethology, University of Veterinary Medicine, Vienna, Austria.6Percy FitzPatrick Institute, DST-NRF Centre of Excellence, University of Cape Town, Rondebosch 7701, South Africa.7Department of Zoology, University of Johannesburg, P.O. Box 524, Auckland Park 2006, South Africa.
Received: 27 July 2015 Accepted: 9 November 2015
References
1. Hewitt G. The genetic legacy of the Quaternary ice ages. Nature. 2000;405:907–13.
2. Hewitt GM. Genetic consequences of climatic oscillations in the Quaternary. Philos Trans R Soc B Biol Sci. 2004;359:183–95.
3. Newton I. Speciation and Biogeography of Birds. London & San Diego: Academic; 2003.
4. Poole AF. Ospreys: a Natural and Unnatural History. New York: Cambridge University Press; 1989.
5. Alerstam T, Hake M, Kjellén N. Temporal and spatial patterns of repeated migratory journeys by ospreys. Anim Behav. 2006;71:555–66.
6. Thibault JC, Triay R, Beabrun P, Boukhalfa D, Dominici JM, Torre A. Osprey (Pandion haliaetus) in the Mediterranean: characteristics of a resident population with a patchy distribution. In: Muntaner J, Mayol J, editors. Biologia y Conservacion de las Rapaces Mediterraneas. Madrid: Monografias, n°4. SEO; 1996. p. 135–44.
7. Hailer F, Helander B, Folkestad AO, Ganusevich SA, Garstad S, Hauff P, et al. Phylogeography of the white-tailed eagle, a generalist with large dispersal capacity. J Biogeogr. 2007;34:1193–206.
8. Bell DA, Griffiths CS, Caballero IC, Hartley RR, Lawson RH. Genetic Evidence for Global Dispersal in the Peregrine Falcon (Falco peregrinus) and Affinity with the Taita Falcon (Falco fasciinucha). Journal of Raptor Research. 2014;48:44–53.
9. Martell MS, Englund JV, Tordoff HB. An urban Osprey population established by translocation. Journal of Raptor Research. 2002;36(2):91–6.
10. Wink M, Sauer-Gürth H. Phylogenetic relationships in diurnal raptors based on nucleotide sequences of mitochondrial and nuclear marker genes. In: Raptors Worldwide. Edited by Chancelor RD, Meyburg BU. WWGBP, Berlin; 2004.
11. Lerner HRL, Mindell DP. Phylogeny of eagles, Old World vultures, and other Accipitridae based on nuclear and mitochondrial DNA. Mol Phylogenet Evol. 2005;37:327–46.
12. Griffiths CS, Barrowclough GF, Groth JG, Mertz LA. Phylogeny, diversity, and classification of the Accipitridae based on DNA sequences of the RAG-1 exon. J Avian Biol. 2007;38:587–602.
13. Strandberg R. Ageing, sexing and subspecific identification of Osprey, and two WP records of American Osprey. Dutch Birding. 2013;35:69–87. 14. Wink M, Sauer-Gürth H, Witt HH. Phylogenetic differentiation of the Osprey
(Pandion haliaetus) inferred from nucleotide sequences of the mitochondrial cytochrome b gene. In: Raptors Worldwide. Edited by Chancelor RD, Meyburg BU. WWGBP, Berlin; 2004.
15. Helbig AJ, Schmidt D, Seibold I. Mitochondrial DNA sequences reveal differentiation between Nearctic and Palearctic Osprey (Pandion haliaetus) populations [abstract]. Biol Cons Fauna. 1998;102:224.
16. Moritz C. Defining“Evolutionarily Significant Units” for conservation. Trends Ecol Evol. 1994;9:373–5.
17. Mundy NI, Unitt P, Woodruff DS. Skin from feet of museum specimens as a Non-destructive source of DNA for avian genotyping. The Auk. 1997;114:126–9.
18. Bantock TM, Prys-Jones RP, Lee PLM. New and improved molecular sexing methods for museum bird specimens. Mol Ecol Resour. 2008;8:519–28. 19. Galtier N, Gouy M, Gautier C. SEAVIEW and PHYLO_WIN: two graphic tools
for sequence alignment and molecular phylogeny. Comput Appl Biosci. 1996;12:543–8.
20. Lanfear R, Calcott B, Ho SYW, Guindon S. PartitionFinder: combined selection of partitioning schemes and substitution models for phylogenetic analyses. Mol Biol Evol. 2012;29:1695–701.
21. Ronquist F, Huelsenbeck J, MrBayes 3. Bayesian phylogenetic inference under mixed models. Bioinformatics. 2003;19:1572–4.
22. Rambaut A, Drummond AJ. Tracer: MCMC Trace Analysis Tool. Edinburgh: Institute of Evolutionary Biology, University of Edinburgh; 2007.
23. Stamatakis A. RAxML-VI-HPC: maximum likelihood-based phylogenetic analyses with thousands of taxa and mixed models. Bioinformatics. 2006;22:2688–90. 24. Felsenstein J. PHYLIP (Phylogeny Inference Package) version 3.6. Distributed
by the author. Seattle: Department of Genome Sciences, University of Washington; 2005.
25. Bandelt HJ, Forster P, Röhl A. Median-joining networks for inferring intraspecific phylogenies. Mol Biol Evol. 1999;16:37–48.
26. Rozas J, Sánchez-DelBarrio JC, Messeguer X, Rozas R. DnaSP, DNA polymorphism analyses by the coalescent and other methods. Bioinformatics. 2003;19:2496–7.
27. Tamura K, Peterson D, Peterson N, Stecher G, Nei M, Kumar S. MEGA5: molecular evolutionary genetics analysis using maximum likelihood, evolutionary distance, and maximum parsimony methods. Mol Biol Evol. 2011;28:2731–9.
28. Ramos-Onsins SE, Rozas J. Statistical properties of new neutrality tests against population growth. Mol Biol Evol. 2002;19:2092–100.
29. Fu Y-X. Statistical tests of neutrality of mutations against population growth, hitchhiking and background selection. Genetics. 1997;147:915–25. 30. Drummond AJ, Rambaut A, Shapiro B, Pybus OG. Bayesian coalescent
inference of past population dynamics from molecular sequences. Mol Biol Evol. 2005;22:1185–92.
31. Drummond AJ, Rambaut A. BEAST: Bayesian evolutionary analysis by sampling trees. BMC Evol Biol. 2007;7:214.
32. Schmidt HA, Strimmer K, Vingron M, von Haeseler A. TREE-PUZZLE: maximum likelihood phylogenetic analysis using quartets and parallel computing. Bioinformatics. 2002;18:502–4.
33. Nabholz B, Glémin S, Galtier N. The erratic mitochondrial clock: variations of mutation rate, not population size, affect mtDNA diversity across birds and mammals. BMC Evol Biol. 2009;9:54.
34. Matzke NJ. BioGeoBEARS: BioGeography with Bayesian (and Likelihood) Evolutionary Analysis in R Scripts. R package, version 0.2.1, published July 27, 2013 at https://cran.r-project.org/web/packages/BioGeoBEARS/index.html. 35. Matzke NJ. Thesis abstract: probabilistic historical biogeography: new
models for founder-event speciation, imperfect detection, and fossils allow improved accuracy and model-testing. Front Biogeogr. 2013;5(4):242–8. 36. Roques S, Negro JJ. MtDNA genetic diversity and population history of
a dwindling raptorial bird, the Red Kite (Milvus milvus). Biol Conserv. 2005;126:41–50.
37. Wink M, Heidrich P, Fentzlo C. A mtDNA phylogeny of sea eagles (genus Haliaeetus) based on nucleotide sequences of the cytochrome b gene. Biochem Syst Ecol. 1996;24:783–91.
38. Lifjeld J, Bjornstad G, Steen O, Nesje M. Reduced genetic variation in Norwegian Peregrine Falcons Falco peregrinus indicated by minisatellite DNA fingerprinting. Heredity. 2002;144:19–26.
39. Martínez-Cruz B, Godoy JA, Negro JJ. Population genetics after fragmentation: the case of the endangered Spanish imperial eagle (Aquila adalberti). Mol Ecol. 2004;13:2243–55.
40. Zachos FE, Schmölcke U. Archeozoological records and distribution history of the osprey (Pandion haliaetus) in central Europe. Journal of Ornithology. 2006;147:565–8.
41. Schmidt-Rothmund D, Dennis R, Saurola P. The osprey in the western palearctic: breeding population size and trends in the early 21stcentury.
Journal of Raptor Research. 2014;48:375–86.
42. Wandeler P, Hoeck PEA, Keller LF. Back to the future: museum specimens in population genetics. Trends Ecol Evol. 2007;22:634–42.
43. Pertoldi C, Hansen MM, Loeschcke V, Madsen AB, Jacobsen L, Baagoe H. Genetic consequences of population decline in European Otter Lutra lutra: An assessment of microsatellite DNA variation in Danish otters from 1883 to 1993. Proc R Soc Lond B. 2001;268:1775–81.
44. Brown JW, de Groot PJV, Birt TP, Seutin G, Boag PT, Friesen VL. Appraisal of the consequences of the DDT-induced bottleneck on the level of geographic distribution of neutral genetic variation in Canadian peregrine falcons, Falco peregrinus. Mol Ecol. 2007;16:327–43.
45. Helbig AJ, Kocum A, Seibold I, Braun M. A multi-gene phylogeny of aquiline eagles (Aves: Accipitriformes) reveals extensive paraphyly at the genus level. Mol Phylogenet Evol. 2005;35:147–64.
46. Godoy JA, Negro JJ, Hiraldo F, Donázar JA. Phylogeography, genetic structure and diversity in the endangered bearded vulture (Gypaetus barbatus, L.) as revealed by mitochondrial DNA. Mol Ecol. 2004;13:371–90. 47. Igea J, Aymerich P, Fernández-González A, González-Esteban J, Gómez A,
Alonso R, et al. Phylogeography and postglacial expansion of the endangered semi-aquatic mammal Galemys pyrenaicus. BMC Evol Biol. 2013;13:115.
48. Christidis L, Boles WE. Systematics and taxonomy of Australian birds. Collingwood, Australia: CSIRO Publishing; 2008.
49. Shoji A, Sugiyma A, Brazil MA. The status and breeding biology of Ospreys in Hokkaido, Japan. Condor. 2011;113:762–7.
50. Helbig AJ, Knox AG, Parkin DT, Sangester G, Collinson M. Guidelines for assigning species rank. Ibis. 2002;144:518–25.
51. Zink RM. The role of subspecies in obscuring avian biological diversity and misleading conservation policy. Proc R Soc Lond B. 2004;271:561–4. 52. BirdLife International (2015). Pandion haliaetus. The IUCN Red List of
Threatened Species. Version 2015-3. <www.iucnredlist.org>. Downloaded on 12 November 2015.
53. Winter M, Devictor V, Schweiger O. Phylogenetic diversity and nature conservation: where are we? Trends Ecol Evol. 2013;28:199–204. 54. Jetz W, Thomas GH, Joy JB, Redding DW, Hartmann K, Mooers AO. Global
distribution and conservation of evolutionary distinctness in birds. Curr Biol. 2014;24:919–30.
55. Nunes LA, Turvey ST, Rosindell J. The price of conserving avian phylogenetic diversity: a global prioritization approach. Philos Trans R Soc Lond B Biol Sci. 2015;370:20140004.
56. Cramp S, Simmons KEL. Handbook of the birds of Europe, vol. 2. Oxford: Oxford University Press; 1980. p. 265–77.
57. Dennis R, Dixon H. The experimental reintroduction of Ospreys Pandion haliaetus from Scotland to England. Vogelwelt. 2001;122:147–54. 58. Bierregaard RO, David AB, Gibson L, Kennedy RS, Poole AF, Scheibel MS, et
al. Post-DDT recovery of osprey (Pandion haliaetus) populations in Southern New England and Long Island, New York, 1970–2013. Journal of Raptor Research. 2014;48:361–74.
59. Monti F, Sforzi A, Dominici JM. Post-fledging dependence period of ospreys Pandion haliaetus released in central Italy: home ranges, space use and aggregation. Ardeola. 2012;59:17–30.
Submit your next manuscript to BioMed Central and take full advantage of:
• Convenient online submission
• Thorough peer review
• No space constraints or color figure charges
• Immediate publication on acceptance
• Inclusion in PubMed, CAS, Scopus and Google Scholar
• Research which is freely available for redistribution
Submit your manuscript at www.biomedcentral.com/submit