HAL Id: hal-02043523
https://hal.uca.fr/hal-02043523
Submitted on 24 Dec 2020
HAL is a multi-disciplinary open access
archive for the deposit and dissemination of
sci-entific research documents, whether they are
pub-lished or not. The documents may come from
teaching and research institutions in France or
abroad, or from public or private research centers.
L’archive ouverte pluridisciplinaire HAL, est
destinée au dépôt et à la diffusion de documents
scientifiques de niveau recherche, publiés ou non,
émanant des établissements d’enseignement et de
recherche français ou étrangers, des laboratoires
publics ou privés.
Distributed under a Creative Commons Attribution - NoDerivatives| 4.0 International
License
very fine ash into the atmosphere
Mathieu Gouhier, Julia Eychenne, Nourddine Azzaoui, Arnaud Guillin,
Mathieu Deslandes, Matthieu Poret, Antonio Costa, Philippe Husson
To cite this version:
Mathieu Gouhier, Julia Eychenne, Nourddine Azzaoui, Arnaud Guillin, Mathieu Deslandes, et al..
Low efficiency of large volcanic eruptions in transporting very fine ash into the atmosphere. Scientific
Reports, Nature Publishing Group, 2019, 9 (1), �10.1038/s41598-019-38595-7�. �hal-02043523�
Low efficiency of large volcanic
eruptions in transporting very fine
ash into the atmosphere
Mathieu Gouhier
1, Julia Eychenne
1, Nourddine Azzaoui
2, Arnaud Guillin
2,
Mathieu Deslandes
3, Matthieu Poret
4, Antonio Costa
4& Philippe Husson
3Volcanic ash clouds are common, often unpredictable, phenomena generated during explosive eruptions. Mainly composed of very fine ash particles, they can be transported in the atmosphere at great distances from the source, having detrimental socio-economic impacts. However, proximal settling processes controlling the proportion (ε) of the very fine ash fraction distally transported in the atmosphere are still poorly understood. Yet, for the past two decades, some operational meteorological agencies have used a default value of ε = 5% as input for forecast models of atmospheric ash cloud concentration. Here we show from combined satellite and field data of sustained eruptions that ε actually varies by two orders of magnitude with respect to the mass eruption rate. Unexpectedly, we demonstrate that the most intense eruptions are in fact the least efficient (with ε = 0.1%) in transporting very fine ash through the atmosphere. This implies that the amount of very fine ash distally transported in the atmosphere is up to 50 times lower than previously anticipated. We explain this finding by the efficiency of collective particle settling in ash-rich clouds which enhance early and en masse fallout of very fine ash. This suggests that proximal sedimentation during powerful eruptions is more controlled by the concentration of ash than by the grain size. This has major consequences for decision-makers in charge of air traffic safety regulation, as well as for the understanding of proximal settling processes. Finally, we propose a new statistical model for predicting the source mass eruption rate with an unprecedentedly low level of uncertainty.
Volcanic ash clouds generated by explosive eruptions are distally transported in the atmosphere up to distances ranging from a few hundreds to thousands of kilometres from the vent. They are mainly composed of the finest ash fraction which survives proximal sedimentation, and referred to as very fine ash (<32 µm) following the phys-ical volcanology-derived terminology of explosive eruptions1. However, in some cases coarser particles can reach
distal location as recently demonstrated during moderate Icelandic eruptions2. Very fine ash can have damaging
effects on aircraft, hence having detrimental impact on air traffic safety as demonstrated by air traffic disruption during Eyjafjallajökull3 and Cordón del Caulle4 eruptions. Distal airborne very fine ash represent only a fraction
of the total amount of solid particles (referred to as tephra) injected into the volcanic plume column above the crater. Here we examine this partitioning (ε; given in percentage) as the ratio between the very fine ash flux trans-ported in distal clouds (Qa) estimated from satellite-based infrared measurements, and the total flux of tephra
emitted at the source (Qs) inferred from ground studies of tephra deposits. The latter is also referred to as the Mass
Eruption Rate (MER). The ratio ε quantifies the volcanic ash removal efficiency in proximal areas, which is critical for constraining ash sedimentation processes during the early stages of cloud dispersal, as well as for predicting the ash clouds properties as they are advected around the globe.
We compiled a database of 22 eruptions of various magnitudes and intensities carefully selected from remark-ably well documented case studies in the published records (Table 1). They are characterized by distinct eruption styles describing the dynamics and phenomenology of the explosive activity. Eruption styles can be defined from various classifications using different parameters5,6. In our case, we adopted the most recent one6 for the following
reasons: (i) it uses the MER (equivalent to Qs) and the volcanic ash plume height (H) as input parameters; (ii) it
allows individual eruption phases to be easily requalified; and (iii) permits a real-time first order classification
1Université Clermont Auvergne, CNRS, IRD, OPGC, Laboratoire Magmas et Volcans, F-63000, Clermont-Ferrand,
france. 2Laboratoire de Mathématiques Blaise Pascal, UMR 6620 CNRS & UCA, Aubière, France. 3VAAc toulouse,
Météo france, toulouse, france. 4Istituto Nazionale di Geofisica e Vulcanologia, Sezione di Bologna, Bologna, Italy.
correspondence and requests for materials should be addressed to M.G. (email: M.Gouhier@opgc.fr) Received: 13 July 2018
Accepted: 20 December 2018 Published online: 05 February 2019
opeN
of eruptive events, which is useful for operational applications. Therefore, we distinguish sustained eruptions (9 Small/Moderate, 7 Subplinian and 4 Plinian styles) defined by quasi-steady discharge conditions (i.e., with a dura-tion of tephra emission much longer than the time necessary to reach the neutral buoyancy level) from transient eruptions corresponding to unsteady impulsive explosions (i.e., 2 Vulcanian style).
The database comprises satellite-based infrared measurements of Qa inferred from the extinction
proper-ties of ash using the split-window method7,8, except for the May, 2011 Grimsvötn and October 27, 2002 Etna
eruptions, whose measurements were carried out using hyperspectral sounders. This technique provides ver-tical column densities as a mass per unit area, and allows total mass of very fine ash to be retrieved from inte-gration of ash-bearing pixels over the whole cloud surface. Then, the average value of Qa can be calculated by
Volcano Explosive Phase selected Duration (s) Fallout deposit mass (Kg) ±(Kg)Error (Kg)Cloud mass ±(Kg)Error Plume Height (km) Qs (kg/s) Qa (kg/s) ε (%) ±Error Style
Pinatubo Climactic phase on 15–16/06/1991 3.24E + 04(1) 5.7E + 12(2) 1.4E + 12 5.0E + 10(3) 2.5E + 10 40(1) 1.8E + 08 1.5E + 06 0.9 0.6 Plinian(1,2)
Kelut Full eruption 13/02/2014 1.08E + 04(4) 6.5E + 11(5) 1.6E + 11 7.4E + 08(4) 3.7E + 08 20(4) 6.0E + 07 6.9E + 04 0.1 0.1 Plinian(5)
El Chichon Phases B and C on 04/04/1982 3.96E + 04(6) 8.7E + 11(7) 2.2E + 11 6.5E + 09(8) 3.3E + 09 30(8) 2.2E + 07 1.6E + 05 0.7 0.5 Plinian(6)
Hudson Full eruption 12–15/08/1991 2.27E + 05(9) 3.9E + 12(10) 9.8E + 11 2.9E + 09(11) 1.5E + 09 18(9,11) 1.7E + 07 1.3E + 04 0.1 0.0 Plinian(10)
Sarychev Peak Subplinian events on 14–15/06/2009 5.94E + 04(12) 4.0E + 11(12) 1.0E + 11 5.4E + 08(12) 2.7E + 08 20(12) 6.7E + 06 9.1E + 03 0.1 0.1 Subplinian*
Cordon Caulle Climactic phase on 4–5/06/2011 8.64E + 04(13) 4.5E + 11(13) 1.1E + 11 7.0E + 08(14) 3.5E + 08 12.2(14) 5.2E + 06 8.1E + 03 0.2 0.1 Subplinian(13)
Grimsvotn Subplinian phase on 22/05/2011 1.91E + 05(15) 7.0E + 11(15,16) 1.8E + 11 4.9E + 08(17) 2.5E + 08 20(17,18) 3.7E + 06 2.6E + 03 0.1 0.0 Subplinian(16)
Mt. Spurr Full eruption 16/09/1992 1.30E + 04(19) 3.9E + 10(20) 9.8E + 09 6.1E + 08(21) 3.1E + 08 13.9(21) 3.0E + 06 4.7E + 04 1.6 1.0 Subplinian(20)
Mt. Spurr Full eruption 18/08/1992 1.25E + 04(19) 3.6E + 10(20) 9.0E + 09 4.2E + 08(21) 2.1E + 08 13.7(21) 2.9E + 06 3.4E + 04 1.2 0.8 Subplinian(20)
Redoubt Explosive events 1 to 5 on
22–23/03/2009 5.22E + 03
(22) 1.4E + 10(22) 3.5E + 09 1.7E + 09(23) 8.5E + 08 15(22) 2.7E + 06 3.3E + 05 12.1 8.0 Vulcanian(22)
Mt. Spurr Full eruption 27/06/1992 1.46E + 04(19) 3.1E + 10(20) 7.8E + 09 4.4E + 08(21) 2.2E + 08 14.5(21) 2.1E + 06 3.0E + 04 1.4 0.9 Subplinian(20)
Lascar Full eruption 04/1993 1.73E + 05(24) 3.5E + 11(21,25) 8.6E + 10 4.8E + 09(21) 2.4E + 09 21(24) 2.0E + 06 2.8E + 04 1.4 0.9 Subplinian*
Anatahan Explosive phases on 10–11/05/2003 3.24E + 04(26) 3.8E + 10(27) 9.6E + 09 1.3E + 09(26) 6.5E + 08 12(26) 1.2E + 06 4.0E + 04 3.4 2.2 Small/
Moderate(27)
Chaiten Full eruption: 2–8/05/2008 6.05E + 05(28) 1.7E + 11(28) 4.3E + 10 8.0E + 08 4.0E + 08 19(28) 2.8E + 05 1.3E + 03 0.5 0.3 Subplinian(28)
Hekla Phase I + 8 hrs phase II on
26/02/2000 4.21E + 04
(29) 1.0E + 10(30) 2.5E + 09 1.0E + 08(29) 5.0E + 07 11(29) 2.4E + 05 2.4E + 03 1.0 0.7 Small/
Moderate* Soufrière Hills Full eruption: 26/09/1997 3.60E + 03(31) 5.5E + 08(32) 1.4E + 08 5.4E + 07(33) 2.7E + 07 11.3(33) 1.5E + 05 1.5E + 04 9.8 6.4 Vulcanian(32)
Ruapehu Full eruption: 17/06/1996 3.60E + 04(34) 4.2E + 09(35) 1.1E + 09 2.9E + 08(36) 1.5E + 08 8.5(36) 1.2E + 05 8.1E + 03 6.9 4.6 Small/
Moderate* Eyjafjallajökull Phase I/III on 14–19/04 &
05–18/05/2010 1.90E + 06
(37) 2.0E + 11(38) 4.9E + 10 8.3E + 09(39) 4.2E + 09 9(38) 1.0E + 05 4.4E + 03 4.2 2.8 Small/
Moderate Etna Full eruption: 28/10/2002 2.16E + 04(40) 1.1E + 09(40) 2.6E + 08 1.1E + 07(41) 5.7E + 06 6(42) 4.9E + 04 5.3E + 02 1.1 0.7 Small/
Moderate(40)
Popocatepetl Climactic events on 10/03/1996 2.16E + 04(43) 5.3E + 08(44) 1.3E + 08 1.5E + 07(43) 7.5E + 06 9(44) 2.4E + 04 6.9E + 02 2.8 1.9 Small/
Moderate* Etna Full eruption: 27/10/2002 3.60E + 04(40) 8.7E + 08(40) 2.2E + 08 2.4E + 07(42) 1.2E + 07 6(42) 2.4E + 04 6.6E + 02 2.7 1.8 Small/
Moderate(40)
Etna Full eruption: 24/11/2006 2.16E + 04(45) 1.0E + 08(46) 2.5E + 07 3.6E + 06(47) 1.8E + 06 1.5(45) 4.6E + 03 1.7E + 02 3.6 2.4 Small/
Moderate(46)
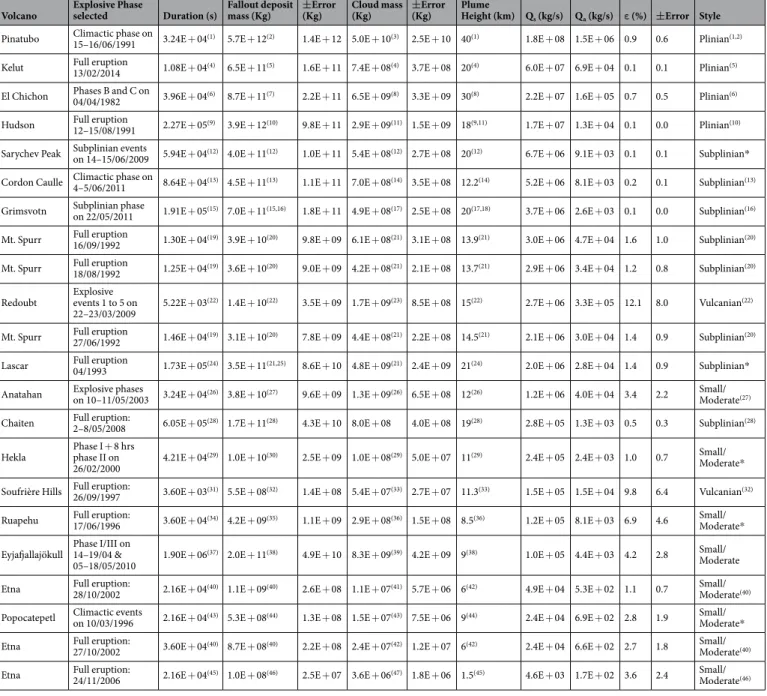
Table 1. Eruptive parameters for the 22 eruptions of our dataset. The eruptions were selected in the dataset
providing that quality published data existed in the literature on the mass of the fallout deposit (derived from field analyses) and the mass of the very fine ash cloud (derived from satellite-based measurements). The plume height above the vent comes from different types of observational data (remote-sensing, visual estimations, etc.). Qs and Qa are calculated as the fallout deposit mass and very fine ash cloud mass, respectively, divided
by the duration of the eruption phase. ε is calculated as the ratio of Qa over Qs. Eruption styles have been
determined using Qs and the plume height6 and are in agreement with related published records. *Eruption
styles for explosive phases that have not been published and which may differ from existing classifications made for full eruption or a different phase.
simply dividing the total mass by the duration of ash emission. Most of the data come from Low-Earth Orbiting (LEO) platforms, hence allowing image acquisition ∼10 hours on average after the start of the eruption. The large Instantaneous Field Of View (IFOV) of these sensors usually allows the observation of the whole cloud from a single or a few images. The extent of the cloud determines the ash emission duration and the timing of the image acquisition allows us to identify the explosive phase within the eruption chronology. The inversion of thermal infrared measurements is particularly relevant for the characterization of the very fine ash content of volcanic clouds because it allows the retrieval of particles in the size range 1–32 µm (at 2σ for a lognormal distribution2).
However, some known uncertainties remain from (i) the split-window technique leading to false detection and missed ash-bearing pixels9 as well as from (ii) the limits of the validity domain within the Mie scattering theory2,8.
Overall uncertainty associated with satellite-based measurements was estimated to be in the range ±40–60%2.
The average value of Qs was calculated from the published mass of tephra deposited on the ground, divided
by the duration of the explosive phase. Importantly, Qa and Qs refer to the same period of explosive activity
and can thus be reliably compared. The temporal concordance required between these 2 parameters explains the relatively low number of eruptions finally selected. The deposit masses selected in this study (Table 1) were calculated by integrating the mass decay rate of the fallout deposit or integrating the thinning rate of the fallout deposit10,11. These methods are sensitive to the quality and density of field data, to the mathematical function
chosen (e.g., exponential, power-law, Weibull) to represent their spatial variations and to the distal extrapolation limit. Indeed, individual measurements of tephra thickness or mass are extrapolated at greater distances than the maximum sampling, allowing the finest ash fraction to be accounted for, and the total mass of tephra estimated. Thus, Qs represents the average MER of the total grain size distribution at the source vent and is given with an
uncertainty of ±10–40%12,13. Note that uncertainties on each individual eruption for both satellite and ground
deposits retrievals have not been systematically published or inferred, but we specifically selected eruptions for which the measurements errors should be low (e.g. no clouds in the atmosphere, no erosion of the deposit, sam-pling performed hours to days following the eruptions, etc.). The related error on ε has been calculated from the average bulk uncertainties of Qa and Qs and reported for each eruption in Table 1.
Results
Source-to-atmosphere very fine ash partitioning.
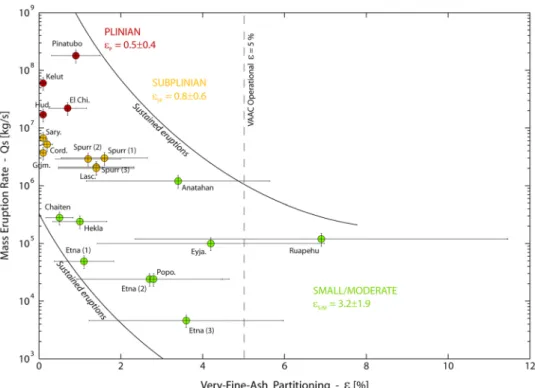
We show that ε of sustained eruptions spans a wide range of values, from 0.1% (e.g., Plinian Kelut 2014 eruption) to 6.9% (Small/Moderate Ruapehu 1996 eruption; Table 1). Fine ash removal from Plinian eruptions is thus about two orders of magnitude more efficient than that from Small/Moderate ones. Remarkably, the variation of the partitioning coefficient is not arbitrary. From Fig. 1, ε decreases with increasing MER, with respect to eruption styles. The four Plinian eruptions selected have large MER (1.7 × 10⁷ < Qs < 1.8 × 10⁸ kg/s). They all produced copious amount of volcanic ash, as for the 1980 Mount
St Helens, and the 1982 El Chichón eruptions, for which the mass fraction of ash smaller than 63 µm represents ∼50% of the total mass of tephra emitted14,15. Such high fine ash contents are related to efficient magma
fragmen-tation processes, occurrence of phreato-magmatic episodes, and contribution of ash elutriated from pyroclastic density currents (PDC) forming co-PDC plumes16. However, they all exhibit a very small proportion of distal very
fine ash, as shown by the weak partitioning coefficient range (0.1 < ε < 0.9%), and fall in a well delimited area in Fig. 1. To explain this observation, we suggest that early enhanced fallout in proximal regions makes the actual proportion of very fine ash transported in distal clouds much lower than expected. This highlights the critical role played by collective settling mechanisms, occurring preferentially in ash-rich plumes, which enhance the sedi-mentation rate of tephra regardless of grain size. Such mechanisms include aggregation17,18, gravitational
instabil-ities19, diffusive convection20, particle-particle interactions21, and wake-capture effects22. These are inferred to be
key processes controlling the early depletion of ash-rich plumes, which cannot be explained by individual particle settling. Aggregation efficiency, in particular, has been identified23,24 to be proportional to a power greater than
two of ash concentration. This means that the higher the fine ash concentration the more important the aggrega-tion efficiency, which is in agreement with the observaaggrega-tions made in our study.
Collective settling mechanisms, allow en masse sedimentation of particles of different sizes, which explains the significant amount of fine ash as well as the poor grain sorting sometimes observed in proximal tephra fallout deposits of large Plinian events. The fallout deposit from the 18 May 1980 eruption of Mount St. Helens (MSH80) for instance, shows both a poor grain sorting in proximal locations25,26 and an increase of mass and thickness at
distances >300 km27 demonstrating rapid removal of fine ash from the plume. Different enhanced sedimentation
processes have been invoked and successfully tested to explain these observations, including aggregation28, and
hydrometeor formation14. Subplinian eruptions, although less powerful than Plinian ones, remain very explosive
and capable of efficient fragmentation, also leading to the formation of ash-rich plumes. For example, the August and September 1992 Mt. Spurr eruptions produced fallout deposits with fine ash contents reaching 30% and 40% of the total mass of tephra, respectively29. The origin of this fine ash is discussed, and could be related to
hetero-geneities in the source magma or secondary particle fragmentation in the volcanic conduit or eruption column30.
They have MER in the range 0.28–6.7 × 10⁶ kg/s and still exhibit low partitioning coefficient, although spanning a
wider range of values (0.1 < ε < 1.6%), hence implying collective settling mechanisms to be at work. The Mt Spurr fallout deposits also show an increase of mass and thickness at distances >150 km from the source, which can be explained by collective settling mechanisms including aggregation, topographic effects and gravitational instabil-ities30. Small/Moderate eruptions are drastically different from Plinian and Subplinian. The eruption explosivity
and the MER are much weaker. The plume column height is generally lower and the fine ash fraction of the size distribution at the source vent is much smaller. Consequently, Small/Moderate eruptions do not produce ash-rich plumes, and enhanced sedimentation in proximal regions is limited, resulting in larger partitioning coefficients (0.5 < ε < 6.9%). The wide range of ε values for Small/Moderate eruptions reflects the heterogeneity of grain size and concentration of the associated plumes. But, this can also be explained by the natural complexity of some
long-lasting eruptions. This is the case, in particular, for the Eyjafjallajökull 2010 eruption displaying multiple and discontinuous phases of explosive activity with varying intensity.
The inverse relationship between ε and the MER shows that for very powerful eruptions, the proximal sed-imentation is mainly controlled by the concentration of fine ash. This suggests that above a given threshold of the fine ash volume fraction, collective mechanisms dominate over individual particle settling, and conversely. Assessment of this threshold is very difficult as proximal measurements (i.e., in the first tens of kilometres from the source vent) of airborne volcanic ash concentration are scarce. Indeed, satellite-based retrievals are usually impossible due to the opacity of the cloud. But, radar instruments operating at larger wavelengths are able to provide volcanic ash concentration within proximal cloud. The comparison of ash concentration at various dis-tances, hence using various techniques, should bring precious information on early depletion processes and about sedimentation rate evolution. As an example, proximal measurements carried out in the first two hours after the MSH80 Plinian eruption by a 23-cm wavelength radar31 give an ash cloud concentration of ∼8.5 g/m3. In this
region of the cloud we expect sedimentation rate to be high with a significant contribution of collective particle settling mechanisms. As a comparison, distal measurements carried out by satellite-based infrared sensors on the Kelut 2014 Plinian eruption32 give an ash cloud concentration 3 orders of magnitude lower (maximum value
∼9 mg/m3). In this region of the cloud, the sedimentation rate is very low and the individual particle settling is
most likely to prevail.
Ash cloud hazards and operational response.
The partitioning parameter ε is crucial in operational volcanic risk mitigation, as it is required as input for ash-cloud-dispersal models used by several VAACs respon-sible for global air traffic safety. Given that satellite images are not systematically available, the VAACs need rapid parameterization schemes to predict Qa, and to provide frequent and reliable up-to-date forecast maps ofatmospheric ash concentration during volcanic crises33. With this aim, VAACs (such as London and Toulouse)
have typically used a poorly constrained default ε value of 5%34 to forecast the concentration of very fine ash
composing distal ash clouds following Qa = ε × Qs. However, as demonstrated in Fig. 1, the fraction of very fine
ash that survives proximal settling varies by ∼2 orders of magnitudes (0.1% > ε > 6.9%) with respect to the MER.
Figure 1. Style-derived volcanic ash partitioning of sustained eruptions. Mass erupting rate (Qs in kg/s) as a
function of the partitioning coefficient ε (Qa/Qs in %) for the 20 sustained eruptions of our dataset (see Table 1
for details about the eruptions). ε is the ratio between the very fine ash flux transported in distal clouds (Qa)
and the flux of tephra in the plume (Qs) also referred to as MER. It quantifies the volcanic very fine ash removal
efficiency. The sustained eruptions cluster following their eruption style (Plinian, Subplinian, Small/Moderate). This plot shows that ε of sustained eruptions scales with Qs, and spans about two orders of magnitude. The
main trend shows that ε increases with decreasing MER. This indicates that very fine ash removal from ash-rich plumes (Plinian and Subplinian style) is more efficient than from plumes containing coarser tephra (Small/ Moderate style). Error bars are plotted from average bulk uncertainties given for fallout deposit and cloud masses (see Table 1 for detailed error values). The vertical dashed line represents the current VAAC operational partitioning coefficient used by to forecast the atmospheric path of very fine ash clouds. The
Therefore, a constant partitioning value cannot be used, even as first order estimate for operational purposes. Note that Qs is needed, and usually obtained operationally from top plume height estimates following a power-law
relationship35 between the two parameters. The reliability of Q
s estimate from this method is discussed later in
this work and compared with our satellite-based prediction model of Qs (see next section). Here we propose a
new operational eruption-style-dependant parameterization of ε using the mean values for Plinian (εP = 0.5%),
Subplinian (εSP = 0.8%), and Small/Moderate (εS/M = 3.2%) eruptions (Fig. 1). This parameterization is easily
implementable in ash-cloud-dispersal models, allowing operational use by the VAACs. Also, the choice of the correct partitioning parameter to be used during the course of an eruption is not difficult. The phenomenology as well as the real-time assessment of Qs will be particularly useful to discriminate the eruption style. In some cases,
the eruptive history at each volcanic target can also be helpful. Our assessed values of ε significantly depart from the default 5% value used by the VAACs (Fig. 1), and the resulting differences will propagate into the modelled ash cloud concentrations.
Therefore, in order to test the sensitivity of concentration variations to partitioning values, distal ash cloud dispersion maps were simulated for 4 eruption scenarios (Supplementary Information Table S1) using MOCAGE-accident, the ash-cloud-dispersal model of VAAC Toulouse. This model is based upon the three-dimensional chemistry and transport model developed by Météo-France, and specifically adapted for the transport and diffusion of accidental release from the regional to the global scale. For this study, meteorological data were extracted from Météo-France operational database, including 20 pressure levels, from 1000 to 10 mb, with a time resolution of 1-hour and a horizontal resolution of 0.5°. MOCAGE-accident internal grid resolution is 0.5°. For each scenario, ash release was constant for the eruption phase duration and uniform along a vertical line rising from the vent to the maximum plume height. The particle size distribution in the distal cloud includes 6 grain size fractions between 0.1 and 100 µm, with 70 wt% of the particles smaller than 30 µm36. For modelling
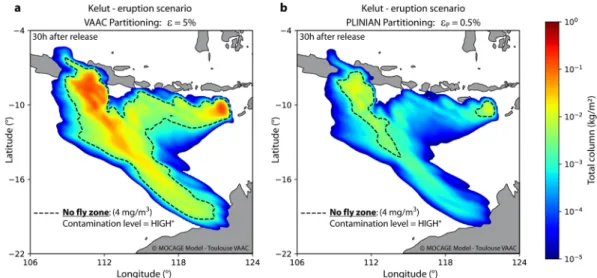
simplicity, we run the simulations using present-day meteorological data. For the Plinian case (see Supplementary Information Fig. S2 for Subplinian and Small/Moderate cases), we use an eruptive scenario based on the Kelut 2014 eruption (Supplementary Information, Table S1). We compare the ash cloud loading (i.e., integration of ash concentration along the vertical path; in kg/m2) simulated using the VAAC-default ε value (5%) with the
Plinian partitioning coefficient (εP = 0.5%) derived from our model (Fig. 2). The ash cloud concentrations are
drastically different, with maximum values of 1.7 × 10⁻¹ and 1.6 × 10⁻² kg/m2 for the VAAC-default and our
eruption-style-dependant coefficients, respectively (Fig. 2a,b). This means that for such Plinian eruptions, VAAC operational simulations could overestimate by a factor of ∼10 the amount of very fine ash in the atmosphere. Consequently, this would overestimate the extent of the no-fly zone (delimited in Fig. 2 by the black dashed line) set by the European Commission beyond a threshold37 of 4 mg/m3 (Fig. 2). Patterns of the no-fly zones are
dras-tically different, and the extent computed from the VAAC model is ∼6.5 times larger than the other one, which could have serious implications for air traffic regulation during an eruption.
Volcanic ash particles can be responsible for the formation of indirect aerosols and/or droplets, the ones potentially having short term effect on the climate38–40. However, the systematic overestimation of the fine ash
amount injected in the atmosphere during large sustained eruptions raises questions about the actual impact of volcanic ash on radiative forcing Conversely, when no calibration is available from ground deposits, the proximal sedimentation can be underestimated by such models (or other tephra-deposition models), as collective settling mechanisms are still not well constrained. This raises the question of the actual impact (buildings damage, agri-culture and water pollution, health and respiratory problems, etc.) of tephra fallout in the vicinity of volcanic areas, likely to be larger than expected.
Satellite-based prediction model of Q
s.
The interdependence of Qa, Qs and the eruption style leads usto develop statistical models for predicting Qs using satellite measurements of Qa with additional controlling
parameters. A reliable assessment of Qs is essential for estimating plume dynamics close to the source, and hence
for delineating zones impacted by tephra fallout using tephra-deposition models41. However, direct
measure-ments of Qs remain impossible during the course of an eruption42. Thus, for rapid assessment of Qs, indirect
methods have been developed using scaling laws based on relationships between measured plume height H and time-averaged Qs; these are referred to as empirical scaling laws35,43. This methodology currently represents the
standard for real-time determination of Qs, although associated with uncertainties as large as a factor of 54 at a
95% confidence interval35. Data investigated here are small sized while the number of explanatory variables is
relatively high. Therefore, we developed specifically a novel and robust statistical technique using a modified Akaike Information Criterion (AICc; see Methods) allowing the selection of the best regression mixture model for the eruptions in our database (all statistical indicators are summarized in Table 2). By combining Qs, Qa and H
in three-dimensional space (Fig. 3a), the best model selected follows a power-law in the form:
= . . .
Qs 30 22Q Ha0 51 2 25 (1)
This relationship gives an AICc of 12.9 with excellent p-values (Table 2). The RMSE (Root Mean Square Error) yields an error factor of 12.8 at a 95% prediction interval. With an uncertainty four times lower than the empirical scaling laws35, this new satellite-derived model improves significantly the estimation of Q
s (Table 2). In
particu-lar, the error distribution is not uniform as shown in Fig. 3b from the projection of the 95% prediction interval envelope in the H-Qa plane. This yields an error factor of ∼2, close to the data centre of mass that encloses 12 of
the 22 eruptions of our dataset.
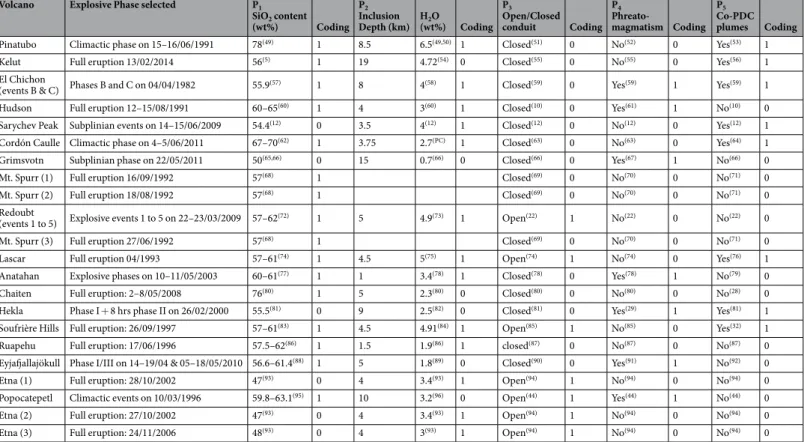
Then, we also collected 5 additional parameters (P1 to P5, Table 3) related to magmatic system properties and
external processes (referred to as modalities), likely to control the amount of very fine ash produced and injected in the plume. Each modality has been coded on a Boolean basis (0/1) so that they can be statistically analysed. We then proceeded to the selection steps to discriminate between all the possible models with 7 different variables
(Qa, H, P1 to P5), with modalities (P1, …, P5) being class parameters for Qa and H. The modalities include the SiO2
(P1) and H2O (P2) contents of the magma, the open or closed character of the conduit (P3), the occurrence of
phreatomagmatic activity (P4), and the formation of co-pyroclastic density current (co-PDC) plumes (P5). Using
our selection model analysis, these modalities allow clustering of the 22 data samples in the 3D space defined by Qs, Qa and H, and the identification of sub-models corresponding to different eruption scenarios (see the
Methods section for details). We found that P1 and P3 are the parameters that best improve the fitness criterion,
with a low AICc value of 10.4. This leads to a new sub-model yielding an error factor of 9.3 at a 95% prediction interval based on four different equations as follows:
= . . . ‐ ‐
QS 25 95Qa0 72 1 95H low SiO and closed conduit2 (2)
= . . . ‐ ‐
QS 25 95Qa0 72 1 4H low SiO and open conduit2 (3)
Figure 2. Ash cloud concentration simulations during Plinian eruptions. The two simulations are produced
by the volcanic ash-cloud-dispersal model MOCAGE of the Toulouse VAAC based on the Plinian eruption of Kelut the 13 February, 2014 (Supplementary Information Table 1), using different partitioning coefficients and present-day meteorological data. (a) Simulation of ash dispersion in the atmosphere at Kelut volcano 30 hours after the eruption, using the VAAC-default operational ε value of 5%. (b) Same simulation conditions and scenario, but using the Plinian ε value established in this study at 0.5%. The extent of the No-Fly zone (4 mg/m3
for an ash cloud 500-m thick*) is much larger for the VAAC-default ε, yielding a maximum concentration one order of magnitude higher. *The threshold at 4 mg/m3 was first established by the European Commission after
the Eyjafjallajökull 2010 eruption23. It is now described by EASA (European Aviation Safety Agency) and used
in the emergency plan EUR/NAT (EURopean and North ATlantic office) as the “High” contamination level.
Models Coefficients p-value AICc RMSE (95%) Error factor
Qs = c0Qac1 c0 89.211 5.93E-03*** 22.49 3.27 26.31 c1 1.004 2.13E-06*** Qs = c0Qac1Hc2 c0 30.220 8.87E-03*** 12.93 2.55 12.80 c1 0.505 1.05E-02** c2 2.249 1.31E-03*** Qs = c0Qac(P1)Hc(P3) c0 25.946 2.16E-02** 10.43 2.23 9.29 c(P1(lo)) 0.721 5.65E-03*** c(P1(hi)) 0.622 2.49E-03*** c(P3(cl)) 1.950 1.80E-03*** c(P3(op)) 1.396 3.17E-02**
Table 2. Summary of statistic results using model selection analysis. p-values quality is illustrated using asterisk
(***Excellent; **very good). The AICc stands for corrected Akaike Information Criterion, the RMSE is given as the natural logarithm of the Root Mean Square Error for a 95% prediction interval and the error factor is calculated as the exponential of the RMSE.
= . . . ‐ ‐
QS 25 95Qa0 62 1 95H high SiO and closed conduit2 (4)
= . . . ‐ ‐
QS 25 95Qa0 62 1 4H high SiO and open conduit2 (5)
The magma SiO2 content (P1), often associated with the magma viscosity is a critical parameter controlling the
pressurization state of the shallow magmatic system provided sufficient gas is available. The parameter (P3) related
to the open/closed character of the conduit goes in the same direction. Indeed, closed systems usually designate volcanic conduits or vents sealed by cooled lava acting as an impermeable plug preventing from easy gas exhaust, and hence allowing a pressure increase in the shallow magmatic system. Exclusion of P2 is unexpected, as the
gas usually controls the MER at the source vent. This can be explained by the difficulty of comparing H2O
con-tent measurements made with different techniques. Exclusion of P4 is also interesting. Indeed, the
phreatomag-matism is a mechanism involving external water and is frequently observed during recent subglacial Icelandic eruptions44. In one hand, magma-water interaction can enhance the explosivity hence the formation of very fine
ash. On the other hand, water-rich eruptive column is likely to cause premature deposition of ash through wet aggregation and hydrometeor formation14,29. However, no significant influence of the phreatomagmatism could
be demonstrated by the our statistical analysis. Significant amount of very fine ash can be produced by PDC as for MSH1980 Plinian eruption, therefore the contribution to airborne ash by co-PDC plumes needed to be tested. However, the variability of co-PDC plumes (P5) dispersion mechanisms45 associated with the difficulty to
assess quantitatively their amplitude is likely to explain their exclusion. The power-law coefficients are related to the modalities (Pn) and show a strongly non-linear behaviour with power values of 0.72 and 0.62 on Qa for low
and high-SiO2, respectively, and power values of 1.95 and 1.4 on H for closed and open-conduit respectively. The
constant (c0 = 25.95) is inherent to the general model structure and is not dependent on the explanatory variable
Qa and H, nor on the modalities P1 and P3.
Equations 2 to 5 offer a new tool for accurate, near-real-time estimation of Qs during an eruption, provided
that Qa and H can be estimated. In order to validate our approach, we simulated the 23 February 2013 eruption
of Mount Etna (Sicily) using two different Qs inputs. The goal of this work is to test the ability of each
parameter-ization (Qs1 and Qs2) to reproduce the observed tephra fallout deposits. Simulations have been carried out using
Fall3D; which is a tephra-transport and deposition model, and now represent a standard used at INGV (Italy), VAACs of Buenos Aires (Argentina) and Darwin (Australia). Thus, Fall3D is a perfect candidate for this analysis; a full description of its characteristics can be found in the litterature41,46. In one hand, Q
s1 was estimated from our
satellite-derived statistical model using the parameterization for low-SiO2 content and open conduit (Eq. 3), and
used as input parameter in simulation 1 (Fig. 4a). On the other hand, Qs2 was calculated from the standard
empir-ical scaling law35 (currently used operationally by the London and Toulouse VAAC), and used as input parameter
in simulation 2 (Fig. 4b). Simulations were run between 00:00 (all times are in UTC) on the 23 and 24:00 on the 28 February 2013, within a 445 by 445 km grid domain using meteorological fields (from ECMWF data). They include 37 pressure levels with a time resolution of 6 hours and a horizontal resolution of 0.75°. The FALL3D
Figure 3. Qs prediction model using model selection analysis. (a) Statistical relationship between Qs derived
from fallout deposits, Qa derived from satellite-based measurements, and H (above the vent) derived from
observations, in a three-dimensional natural logarithm space. The best Qs prediction model is shown as the
coloured plane and the related equation is given in natural scale following a power-law at the top of the plot. It was selected by the AICc (Corrected Akaike Information Criterion) which gives a robust evaluation of the goodness-of-the-fit for small datasets. The error factor and related RMSE are provided at a 95% prediction interval. See Supplementary Information Table 2 for all the goodness-of-the-fit evaluation criteria. (b) Error factor contour levels related to the MER estimation plotted on the two-dimensional plane H vs. Qa in natural
logarithm, and showing the anisotropy of the error distribution. Red triangles represent eruptions (12 over 22) for which the error factor value is ∼2 or less. Practically, this means that estimations of MER for future eruptions falling in this range of Qa (∼1 × 10³ to 1 × 10⁵ kg/s) and H (∼7 to 21 km) have a 95% probability to fall
internal grid resolution was 4 by 4 km, obtained by interpolating linearly the meteorological data. The three main Eruption Source Parameters (ESP) required by FALL3D at the input of the model are the plume column height, the Total Grain-Size Distribution and Qs. Then, the ability of each model to reproduce the observed tephra fallout
deposits is assessed using field measurements47 of tephra loading at 10 locations carried out after the 23 February
2013 eruption of Mount Etna (Fig. 4; Supplementary Information Table S2, Table S3 and Fig. S3). The two simula-tions are strikingly different. The first one (Fig. 4a) provides a faithful reconstruction of the deposits as shown by the 5 isomass contours (set at 10, 1, 0.1, 0.01, and 0.001 kg/m2) correctly enclosing the sampling points #1 (21 kg/
m2), #8 (0.29 kg/m2), #9 (0.013 kg/m2), and #10 (0.0014 kg/m2). On the contrary, the simulation 2 (Fig. 4b) using
the empirical H-derived scaling law fails at reproducing the actual deposits and significantly underestimates the amount of tephra deposited on the ground. This is clearly shown by the restricted extent of the computed isomass contours, and is the direct consequence of the underestimation of Qs. These results illustrate the robustness of our
model and highlight the importance of including satellite-derived estimates of Qa for reliable estimations of Qs.
Conclusion
Volcanic very fine ash clouds can travel great distances and contaminate the atmosphere for long periods of time, disrupting air traffic as demonstrated during recent eruptions. However, the proportion of very fine ash distally transported in the atmosphere, and related proximal settling processes, are difficult to assess. Yet, for the past two decades, several operational meteorological agencies (VAACs) have used an unrealistic default value of ε = 5% as input for forecast models of atmospheric ash cloud concentration. Here, from the combination of field and satellite data, we provide first-time quantitative assessment of the source-to-atmosphere partitioning (ε) of very fine ash from 22 eruptions. We also developed a robust and novel statistical model for predicting the source mass eruption rate (Qs) with an unprecedentedly low level of uncertainty. The main findings are summarized below:
i. The fraction of very fine ash (i.e., which survive proximal settling) varies by ∼2 orders of magnitudes (0.1 > ε > 6.9%) with respect to the MER. This partitioning is not arbitrary as ε decreases with increasing MER, with respect to eruption styles.
ii. Large plumes from Plinian eruptions are much less efficient (up to 50 times lower) at transporting very fine ash through the atmosphere than previously anticipated.
Volcano Explosive Phase selected P1
SiO2 content (wt%) Coding P2 Inclusion Depth (km) H(wt%) Coding2O P3 Open/Closed conduit Coding P4 Phreato-magmatism Coding P5 Co-PDC plumes Coding
Pinatubo Climactic phase on 15–16/06/1991 78(49) 1 8.5 6.5(49,50) 1 Closed(51) 0 No(52) 0 Yes(53) 1
Kelut Full eruption 13/02/2014 56(5) 1 19 4.72(54) 0 Closed(55) 0 No(55) 0 Yes(56) 1
El Chichon
(events B & C) Phases B and C on 04/04/1982 55.9(57) 1 8 4(58) 1 Closed(59) 0 Yes(59) 1 Yes(59) 1 Hudson Full eruption 12–15/08/1991 60–65(60) 1 4 3(60) 1 Closed(10) 0 Yes(61) 1 No(10) 0
Sarychev Peak Subplinian events on 14–15/06/2009 54.4(12) 0 3.5 4(12) 1 Closed(12) 0 No(12) 0 Yes(12) 1
Cordón Caulle Climactic phase on 4–5/06/2011 67–70(62) 1 3.75 2.7(PC) 1 Closed(63) 0 No(63) 0 Yes(64) 1
Grimsvotn Subplinian phase on 22/05/2011 50(65,66) 0 15 0.7(66) 0 Closed(66) 0 Yes(67) 1 No(66) 0
Mt. Spurr (1) Full eruption 16/09/1992 57(68) 1 Closed(69) 0 No(70) 0 No(71) 0
Mt. Spurr (2) Full eruption 18/08/1992 57(68) 1 Closed(69) 0 No(70) 0 No(71) 0
Redoubt
(events 1 to 5) Explosive events 1 to 5 on 22–23/03/2009 57–62(72) 1 5 4.9(73) 1 Open(22) 1 No(22) 0 No(22) 0 Mt. Spurr (3) Full eruption 27/06/1992 57(68) 1 Closed(69) 0 No(70) 0 No(71) 0
Lascar Full eruption 04/1993 57–61(74) 1 4.5 5(75) 1 Open(74) 1 No(74) 0 Yes(76) 1
Anatahan Explosive phases on 10–11/05/2003 60–61(77) 1 1 3.4(78) 1 Closed(78) 0 Yes(78) 1 No(79) 0
Chaiten Full eruption: 2–8/05/2008 76(80) 1 5 2.3(80) 0 Closed(80) 0 No(80) 0 No(28) 0
Hekla Phase I + 8 hrs phase II on 26/02/2000 55.5(81) 0 9 2.5(82) 0 Closed(81) 0 Yes(29) 1 Yes(81) 1
Soufrière Hills Full eruption: 26/09/1997 57–61(83) 1 4.5 4.91(84) 1 Open(85) 1 No(85) 0 Yes(32) 1
Ruapehu Full eruption: 17/06/1996 57.5–62(86) 1 1.5 1.9(86) 1 closed(87) 0 No(87) 0 No(87) 0
Eyjafjallajökull Phase I/III on 14–19/04 & 05–18/05/2010 56.6–61.4(88) 1 5 1.8(89) 0 Closed(90) 0 Yes(91) 1 No(92) 0
Etna (1) Full eruption: 28/10/2002 47(93) 0 4 3.4(93) 1 Open(94) 1 No(94) 0 No(94) 0
Popocatepetl Climactic events on 10/03/1996 59.8–63.1(95) 1 10 3.2(96) 0 Open(44) 1 Yes(44) 1 No(44) 0
Etna (2) Full eruption: 27/10/2002 47(93) 0 4 3.4(93) 1 Open(94) 1 No(94) 0 No(94) 0
Etna (3) Full eruption: 24/11/2006 48(93) 0 4 3(93) 1 Open(94) 1 No(94) 0 No(94) 0
Table 3. Explicative variables used in the statistical analyses for the 22 eruptions. The five explicative variables
considered here (SiO2 (P1) and H20 (P2) magma content, open or closed character of the conduit (P3),
occurrence of phreatomagmatism (P4), and formation of co-PDC plumes (P5)) are coded as Boolean data
type (0/1) to be used in the model selection analysis. The threshold between low and high SiO2 content is set
at 56 wt% for P1. The threshold between low and high water saturation for P2 is set considering the inclusion
iii. We explain this behaviour by the existence of collective particle settling mechanisms occurring in ash-rich plumes, which enhance early and en masse fallout of very fine ash.
iv. We suggest that proximal sedimentation during powerful eruptions is controlled by the concentration of fine ash regardless of the grain size.
v. We thus propose a style-derived parameterization of ε (εP = 0.5%; εSP = 0.8%; εS/M = 3.2%) to be used into
VAAC ash-cloud-dispersal models for operational applications.
vi. We provide a novel and robust statistical model for the estimation of the source Mass Eruption Rate (Qs),
with an unprecedented reduction of uncertainties from an error of a factor 54 (previous work used by some VAACs) to a factor 9.3 at a 95% prediction interval.
The fact that very fine ash from Plinian eruptions are not efficiently transported in the atmosphere and expe-rience early sedimentation has major implications for risk management. On the ground, tephra fallouts can be more severe than predicted by current tephra-deposition models, having a detrimental effect on water infra-structure, buildings or agriculture. In the atmosphere, the concentration of far-travelled ash clouds can be much lower than predicted by current ash-cloud-dispersal models, hence having important impact for crisis manage-ment related to air traffic safety. We propose incorporating our eruption-style-dependant partitioning coeffi-cients into VAAC ash-cloud-dispersal models, as well as the use of the equations (2–5) of our statistical model into tephra-deposition models. For this purpose, we provide (Supplementary Information, Table S4) operational parameters to be used in real-time for three standard eruptive scenarios (i.e., Plinian, Subplinian, and Small/ Moderate). For each scenario, these parameters include the Total Grain Size Distribution48 (TGSD), the total ash
fraction with diameter <64 µm, the distal very fine ash fraction (εP, εSP, εS/M), and equations of Qs for the
estima-tion of the source mass erupestima-tion rate.
Methods
Statistical model.
Data investigated here are small sized while the number of explanatory variables is rel-atively high. A classical solution consists in regularizing parameters estimation by introducing a penalty term into the maximum likelihood estimation problem. For instance, Ridge or Lasso regressions are based on this principle and have been introduced for variable grouping or to reduce the residuals variance49,50. However,each one is either specialized in the selection (grouping of variables) or in the reduction of quadratic errors51–53.
Consequently, and in adequacy with our context, we propose to introduce a new penalty term that will allow: (i) grouping explanatory variables to determine the relevant number of predictors (ii) improving the estimation of the parameters assigned to each class and (iii) taking into account the small size of observed data. To avoid mak-ing any a-priori, the methodology has been at first, set in the general context of a Gaussian regression mixture models but it turned out by investigating the data set that only one Gaussian regression model is selected via our
Figure 4. Simulations of the tephra fallout deposit from the 23rd February 2013 Etna eruption. The simulations
are generated by the FALL3D tephra-transport deposition model with distinctive Qs as input. The simulated
tephra fallout deposits are displayed as isomass contour levels (black lines) that represent the “computed tephra load” on the ground in kg/m2. The “measured tephra load” on the ground is indicated in red squares at
individual locations of field sampling (red squares and numbers, see Supplementary Information Table 3 for details on sampling locations). (a) Simulation 1 uses an input Qs1 estimated with our satellite-derived statistical
model (see equation at the top of the map for low SiO2 content and open system). The simulated deposit is in
very good agreement with the “measured tephra load” at locations #1, 8, 9 and 10 for instance. (b) Simulation 2 uses an input Qs2 estimated with the empirical scaling law35 (see equation at the top of the map). The simulated
deposit has a much smaller extent than in simulation 1, with “computed tephra loads” departing significantly from the “measured tephra loads”. The total erupted mass (TEM) according to these simulations yields values of 1.09 × 10¹⁰ and 6.58 × 10⁸ kg for simulation 1 and 2, respectively. The reference TEM value47 for this fallout
deposit is 4.9 × 10⁹ kg which means that the Satellite-derived statistical model overestimates the TEM by a factor
procedure. Therefore, we only present our methodology in this context, which moreover allows physical inter-pretations of the involved parameters. Indeed, consider (y1, …, yn)t a sample observed from the interest variable Y
(Mass Eruption Rate, Qs) and let (xt, …, xt)t be a matrix of explanatory variables X (Qa, H, P1…, P5); xi are vectors
of ℜP. The estimation problem reduces to maximize the following penalized log-likelihood function:
∑
β σ = β σ − β = Pe l( , , , )Y X log f y x( , , ) ( ) i n t 1where f (y, xtβ, σ) is a Gaussian probability density with mean xtβ and variance σ2. The penalty term Pe (.) is given
by βPe( )= ∑α pj=1 β +(1−α)∑ ∑pj=2 lj=−11 βj−βl. The quantity 0 < α < 1 is a tuning parameter whose opti-mal choice makes a balance between the error of the model and the numbers of predictors used in it. This proce-dure is confirmed and emphasized by using model’s selection Criterion. The best known is the Akaike Information Criterion (AIC). It was designed as an asymptotically unbiased estimator of the Kullback divergence between the true model (that actually generated the data) and a statistical approximation of it. The measure of separation between the generating and a candidate model that we use is given by the Kullback’s symmetric divergence54. If
we denote Φ = (β, σ) and Φ0 = (β0, σ0) this divergence is defined by:
Φ Φ = Φ Φ − Φ Φ + Φ Φ − Φ Φ
J( , )0 { ( , )d 0 d( , )}0 0 { ( , )d 0 d( , )}
where d(Φ0, Φ) = EΦ0 {−2 log f (Y |Φ)} is the Kullback-Leibler divergence and EΦ0 denotes the expectation with
respect to f (Y|Φ0). Since d(Φ0, Φ0) does not depend on Φ we use:
Φ Φ = Φ Φ + Φ Φ − Φ Φ
K( , )0 d( , )0 { ( , )d 0 d( , )}
For large sample data and inspired by55, one may prove that the criteria defined by:
σ
= ˆ + +
AIC nlog 2 2(p 1)
is asymptotically unbiased estimator of EΦ0 (d(Φ0, Φˆ)). In the case of small samples, we may prove that the criteria
defined by: σ = + + − − ˆ AICc nlog n p n p 2 ( 1) 2 2
is unbiased estimator of EΦ0 (d(Φ0, Φˆ)) and still satisfy the same asymptotic properties than the AIC. We say that
a model is selected through the AICc if it has the lowest AICc in the family of chosen models.
Let us first observe that due to the range of the observations value, it is natural to consider log(y) as our new observations. The Gaussianity and independence of the observations will be asserted once the selection procedure is performed. Secondly, due to the very small number of observations, with respect to the number of covariables and using parameter estimations in a complete model, we then proceed to the selection steps to discriminate between all the possible models with 7 different variables (Qa, H, P1, …, P5). To this end, let us remark that Qa
and H are physical parameters (directly related to Qs), while other parameters (here named P1 to P5) are related
to magmatic system properties and external processes likely to impact Qs. We thus choose (P1, …, P5) to be class
parameters for Qa and H, which is natural from a physical interpretation of the different volcanoes and
meteoro-logical conditions. Namely, we test models depending on the modality of the parameters leading to the complete model with unknown parameters generically called β·
∑
∑∑
β β β σξ = + + + = = = y P P log k i i i k j i j P j k k 0 1 7 1 2 3 7 , ikwhere (ξk) are independent standardized Gaussian variable. The selection via AIC
c criterion is then performed.
Data Availability
All data generated or analysed during this study are included in this published article (and its Supplementary Information files).
References
1. Rose, W. I. & Durant, A. J. Fine ash content of explosive eruptions. Journal of Volcanology and Geothermal Research 186(1–2), 32–39 (2009).
2. Stevenson, J. A., Millington, S. C., Beckett, F. M., Swindles, G. T. & Thordarson, T. Big grains go far: reconciling tephrochronology with atmospheric measurements of volcanic ash. Atmos. Meas. Tech. Discuss. 8, 65–120 (2015).
3. Budd, L., Griggs, S., Howarth, D. & Ison, S. A fiasco of volcanic proportions? Eyjafjallajökull and the closure of European airspace.
Mobilities 6, 31–40 (2011).
4. Wilson, T. M. et al. Impacts of the June 2011 Puyehue-Cordón Caulle volcanic complex eruption on urban infrastructure, agriculture and public health. GNS Science Report 2012/20 (2013).
5. Walker, G. Explosive volcanic eruptions — a new classification scheme. Geologische Rundschau 62, 431–446 (1973).
6. Bonadonna, C. & Costa, A. Plume height, volume, and classification of explosive volcanic eruptions based on the Weibull function.
Bulletin of Volcanology 75, 1–19 (2013).
7. Prata, A. J. Infrared radiative transfer calculations for volcanic ash clouds. Geophysical Research Letters 16, 1293–1296 (1989). 8. Wen, S. & Rose, W. I. Retrieval of sizes and total masses of particles in volcanic clouds using AVHRR bands 4 and 5. Journal of
9. Guéhenneux, Y., Gouhier, M. & Labazuy, P. Improved space borne detection of volcanic ash for real-time monitoring using 3-Band method. Journal of Volcanology and Geothermal Research 293, 25–45 (2015).
10. Pyle, D. M. The thickness, volume and grainsize of tephra fall deposits. Bulletin of Volcanology 51, 1–15 (1989).
11. Bonadonna, C. & Houghton, B. F. Total grain-size distribution and volume of tephra-fall deposits. Bulletin of Volcanology 67, 441–456 (2005).
12. Klawonn, M. et al. From field data to volumes: constraining uncertainties in pyroclastic eruption parameters. Bulletin of Volcanology
76, 839 (2014).
13. Engwell, S. L., Aspinall, W. P. & Sparks, R. S. J. An objective method for the production of isopach maps and implications for the estimation of tephra deposit volumes and their uncertainties. Bulletin of Volcanology 77, 1–18 (2015).
14. Durant, A. J., Rose, W. I., Sarna‐Wojcicki, A. M., Carey, S. & Volentik, A. C. M. Hydrometeor‐enhanced tephra sedimentation: Constraints from the 18 May 1980 eruption of Mount St. Helens. Journal of Geophysical Research: Solid Earth, 114(B3) (2009). 15. Rose, W. I. & Durant, A. J. El Chichón volcano, April 4, 1982: volcanic cloud history and fine ash fallout. Natural hazards 51(2), 363
(2009).
16. Carey, S., Gardner, J. & Sigurdsson, H. The intensity and magnitude of Holocene plinian eruptions from Mount St. Helens volcano.
Journal of Volcanology and Geothermal Research 66(1–4), 185–202 (1995).
17. Van Eaton, A. R. et al. Hail formation triggers rapid ash aggregation in volcanic plumes. Nat Commun 6, 7860, https://doi. org/10.1038/ncomms8860 (2015).
18. Mueller, S. B. et al. Stability of volcanic ash aggregates and break-up processes. Scientific reports 7(1), 7440 (2017).
19. Manzella, I., Bonadonna, C., Phillips, J. C. & Monnard, H. The role of gravitational instabilities in deposition of volcanic ash. Geology
43, 211–214 (2015).
20. Carazzo, G. & Jellinek, A. M. Particle sedimentation and diffusive convection in volcanic ash-clouds. Journal of Geophysical Research:
Solid Earth 118, 1420–1437 (2013).
21. Del Bello, E. et al. Effect of particle volume fraction on the settling velocity of volcanic ash particles: insights from joint experimental and numerical simulations. Scientific Reports 7, 39620, https://doi.org/10.1038/srep39620 (2017).
22. Lovell, C. J. & Rose, C. W. Wake-Capture Effects Observed in a Comparison of Methods to Measure Particle Settling Velocity Beyond Stokes' Range. Journal of Sedimentary Research 61, 575–582 (1991).
23. Costa, A., Folch, A. & Macedonio, G. A model for wet aggregation of ash particles in volcanic plumes and clouds: 1. Theoretical formulation. J. Geophys. Res. 115, B09201, https://doi.org/10.1029/2009JB007175 (2010).
24. Folch, A., Costa, A. & Macedonio, G. FPLUME-1.0: An integral volcanic plume model accounting for ash aggregation. Geosci. Model
Dev. 9, 431–450, https://doi.org/10.5194/gmd-9-431 (2016).
25. Criswell, C. W. Chronology and pyroclastic stratigraphy of the May 18, 1980, eruption of Mount St. Helens, Washington. J. Geophys.
Res. 92(B10), 10,237–10,266 (1987).
26. Eychenne, J., Cashman, K., Rust, A. & Durant, A. Impact of the lateral blast on the spatial pattern and grain size characteristics of the 18 May 1980 Mount St. Helens fallout deposit. J. Geophys. Res. Solid Earth 120, 6018–6038 (2015).
27. Sarna-Wojcicki, A., Shipley, S., Waitt, R. B., Dzurisin, D. & Wood S. Aerial Distribution, Thickness, Mass, Volume and Grain Size of Air-Fall Ash From the Six Major Eruptions of 1980. U.S. Geol. Surv. Prof. Pap. 1250, 577–600 (1981).
28. Carey, S. N. & Sigurdsson, H. Influence of particle aggregation on deposition of distal tephra from the May 18, 1980, eruption of Mount St. Helens volcano. Journal of Geophysical Research: Solid Earth 87(B8), 7061–7072 (1982).
29. Durant, A. J. & Rose, W. I. Sedimentological constraints on hydrometeor-enhanced particle deposition: 1992 Eruptions of Crater Peak, Alaska. Journal of Volcanology and Geothermal Research 186(1–2), 40–59 (2009).
30. Eychenne, J., Rust, A. C., Cashman, K. & Wobrock, W. Distal enhanced sedimentation from volcanic plumes: Insights from the secondary mass maxima in the 1992 Mount Spurr fallout deposits. Journal of Geophysical Research: Solid Earth, 122 (2017). 31. Harris, D. M. et al. Radar observations of ash eruptions. US Geological Survey professional paper 1250, 323–333 (1981).
32. Kristiansen, N. I., Prata, A. J., Stohl, A. & Carn, S. A. Stratospheric volcanic ash emissions from the 13 February 2014 Kelut eruption.
Geophysical Research Letters 42(2), 588–596 (2015).
33. Witham, C. S. et al. Comparison of VAAC atmospheric dispersion models using the 1 November 2004 Grimsvötn eruption.
Meteorological Applications 14, 27–38 (2007).
34. Webster, H. N. et al. Operational prediction of ash concentrations in the distal volcanic cloud from the 2010 Eyjafjallajökull eruption.
Journal of Geophysical Research: Atmospheres 117, D20, https://doi.org/10.1029/2011JD016790 (2012).
35. Mastin, L. G. et al. A multidisciplinary effort to assign realistic source parameters to models of volcanic ash-cloud transport and dispersion during eruptions. Journal of Volcanology and Geothermal Research 186, 10–21 (2009).
36. Maryon, R. H., Ryall, D. B. & Malcolm, A. L. The NAME 4 Dispersion Model: Science Documentation. UK Meteorological Office
Report (1999).
37. Stohl, A. et al. Determination of time- and height-resolved volcanic ash emissions and their use for quantitative ash dispersion modeling: the 2010 Eyjafjallajökull eruption. Atmos. Chem. Phys. 11, 4333–4351 (2011).
38. Stenchikov, G. L. et al. Radiative forcing from the 1991 Mount Pinatubo volcanic eruption. Journal of Geophysical Research:
Atmospheres 103, 13837–13857 (1998).
39. Robock, A. Volcanic eruptions and climate. Reviews of Geophysics 38, 191–219 (2000).
40. Oppenheimer, C. Climatic, environmental and human consequences of the largest known historic eruption: Tambora volcano (Indonesia) 1815. Progress in Physical Geography 27, 230–259 (2003).
41. Costa, A., Macedonio, G. & Folch, A. A three-dimensional Eulerian model for transport and deposition of volcanic ashes. Earth and
Planetary Science Letters 241, 634–647 (2006).
42. Kaminski, E. et al. Estimation of ash injection in the atmosphere by basaltic volcanic plumes: The case of the Eyjafjallajökull 2010 eruption. Journal of Geophysical Research: Solid Earth 116, B9, https://doi.org/10.1029/2011JB008297 (2011).
43. Sparks, R. S. J. et al. Volcanic Plumes. John Wiley & Sons, Chichester (1997).
44. Pálmadóttir, E. The 2010 Eyjafjallajökull summit eruption: Nature of the explosive activity in the initial phase (Doctoral dissertation) (2016).
45. Engwell, S. L. & Eychenne, J. In Volcanic Ash: Hazard Observation (eds Mackie, S. et al.) (Elsevier, 2016).
46. Folch, A., Costa, A. & Macedonio, G. FALL3D: A computational model for transport and deposition of volcanic ash. Computers &
Geosciences 35(6), 1334–1342 (2009).
47. Poret, M. et al. Modelling eruption source parameters by integrating field, ground-based and satellite-based measurements: The case of the 23rd February 2013 Etna paroxysm. Journal of Geophysical Research: Solid Earth, https://doi.org/10.1029/2017JB015163 (2018).
48. Costa, A., Pioli, L. & Bonadonna, C. Assessing tephra total grain-size distribution: Insights from field data analysis. Earth and
Planetary Science Letters 443, 90–107 (2016).
49. Tibshirani, R. Regression shrinkage and selection via the lasso. Journal of the Royal Statistical Society Series B (Methodological), 267–288 (1996).
50. Zou, H. & Hastie, T. ization and variable selection via the elastic net. Journal of the Royal Statistical Society Series B (Statistical Methodology), 301–320 (2005).
51. Friedman, J., Hastie, T. & Tibshirani, R. Regularization paths for generalized linear models via coordinate descent. Journal of
52. Petry, S., Flexeder, C. & Tutz, G. Pairwise fused lasso. University of Munich Technical Report 102, https://epub.ub.uni-muenchen. de/12164/1/petry_etal_TR102_2011.pdf (2011).
53. Städler, N. & Bühlmann, P. Missing values: sparse inverse covariance estimation and an extension to sparse regression. Statistics and
Computing 22, 219–235 (2012).
54. Kullback, S. Information Theory and Statistics Dover Publications, Mineola, N.Y (1968).
55. Cavanaugh, J. E. A large-sample model selection criterion based on Kullback symmetric divergence. Statistics and Probability Letters
42, 333–343 (1999).
Acknowledgements
J.E. was funded by the Research Institute for Development (IRD). We are particularly grateful to Timothy H. Druitt for constructive scientific discussions. We warmly thank A. Folch and one anonymous reviewer for constructive comments.
Author Contributions
M.G. conceived the idea and defined the project strategy. M.G. and J.E. both compiled, analysed and interpreted the data, and co-wrote the manuscript. N.A. and A.G. designed and carried out the statistical analysis. M.D. and P.H. run the simulations of ash cloud dispersal using MOCAGE-accident model. M.P. and A.C. run the simulations of tephra deposition using FALL3D model.
Additional Information
Supplementary information accompanies this paper at https://doi.org/10.1038/s41598-019-38595-7.
Competing Interests: The authors declare no competing interests.
Publisher’s note: Springer Nature remains neutral with regard to jurisdictional claims in published maps and
institutional affiliations.
Open Access This article is licensed under a Creative Commons Attribution 4.0 International
License, which permits use, sharing, adaptation, distribution and reproduction in any medium or format, as long as you give appropriate credit to the original author(s) and the source, provide a link to the Cre-ative Commons license, and indicate if changes were made. The images or other third party material in this article are included in the article’s Creative Commons license, unless indicated otherwise in a credit line to the material. If material is not included in the article’s Creative Commons license and your intended use is not per-mitted by statutory regulation or exceeds the perper-mitted use, you will need to obtain permission directly from the copyright holder. To view a copy of this license, visit http://creativecommons.org/licenses/by/4.0/.