Long-term precipitation in Southwestern Europe
reveals no clear trend attributable to
anthropogenic forcing
To cite this article: D Peña-Angulo et al 2020 Environ. Res. Lett. 15 094070
View the article online for updates and enhancements.
Recent citations
Spatiotemporal patterns of snow in the Catalan Pyrenees ( NE Iberia)
Josep Bonsoms et al
-Mechanisms for Severe Drought Occurrence in the Balsas River Basin (Mexico)
Ana E. Melgarejo et al
-An Enhanced Innovative Triangular Trend Analysis of Rainfall Based on a Spectral Approach
Bilel Zerouali et al
Environmental Research Letters
OPEN ACCESS RECEIVED 27 April 2020 REVISED 3 June 2020ACCEPTED FOR PUBLICATION
12 June 2020
PUBLISHED
27 August 2020
Original content from this work may be used under the terms of the
Creative Commons Attribution 4.0 licence. Any further distribution of this work must maintain attribution to the author(s) and the title of the work, journal citation and DOI.
LETTER
Long-term precipitation in Southwestern Europe reveals no clear
trend attributable to anthropogenic forcing
D Peña-Angulo1,15 , S M Vicente-Serrano1,15,16 , F Domínguez-Castro2,3 , C Murphy4 , F Reig1 , Y Tramblay5 , R M Trigo6,7 , M Y Luna8 , M Turco9 , I Noguera1 , M Azn´arez-Balta1 , R García-Herrera12,13 , M Tomas-Burguera14 and A El Kenawy10,11
1 Instituto Pirenaico de Ecología, Consejo Superior de Investigaciones Científicas (IPE–CSIC), Zaragoza, Spain 2 Aragonese Agency for Research and Development Researcher (ARAID), Zaragoza, Spain
3 Department of Geography, University of Zaragoza, Zaragoza, Spain
4 Irish Climate Analysis and Research UnitS (ICARUS), Department of Geography, Maynooth University, Maynooth, Ireland 5 HSM (Univ. Montpellier, CNRS, IRD), Montpellier, France
6 Instituto Dom Luiz (IDL), Faculdade de Ciˆencias, Universidade de Lisboa, Lisboa, Portugal
7 Departamento de Meteorologia, Instituto de Geociˆencias, Universidade Federal do Rio de Janeiro, Rio de Janeiro, 21941-916, Brazil 8 Agencia Estatal de Meteorología (AEMET), Madrid, Spain
9 Regional Atmospheric Modeling Group, Department of Physics, University of Murcia, Murcia, Spain 10 Department of Geography, Mansoura University, Mansoura, Egypt
11 Department of Geography, Sultan Qaboos University, Al Khoud, Muscat, Oman
12 Departamento de Ciencias de la Tierra y Astrofísica, Facultad de Ciencias Físicas, Universidad Complutense de Madrid, Madrid, Spain 13 Instituto de Geociencias (CIS-UCM), Madrid, Spain
14 Estaci´on Experimental de Aula Dei, Consejo Superior de Investigaciones Científicas (EEAD -CSIC), Zaragoza, Spain 15 These authors contributed equally to this work.
16 Author to whom any correspondence should be addressed.
E-mail:svicen@ipe.csic.es
Keywords: Southwestern Europe, global climate model, precipitation, anthropogenic forcing, trends
Supplementary material for this article is availableonline
Abstract
We present a long-term assessment of precipitation trends in Southwestern Europe (1850–2018)
using data from multiple sources, including observations, gridded datasets and global climate
model experiments. Contrary to previous investigations based on shorter records, we demonstrate,
using new long-term, quality controlled precipitation series, the lack of statistically significant
long-term decreasing trends in precipitation for the region. Rather, significant trends were mostly
found for shorter periods, highlighting the prevalence of interdecadal and interannual variability at
these time-scales. Global climate model outputs from three CMIP experiments are evaluated for
periods concurrent with observations. Both the CMIP3 and CMIP5 ensembles show precipitation
decline, with only CMIP6 showing agreement with long term trends in observations. However, for
both CMIP3 and CMIP5 large interannual and internal variability among ensemble members
makes it difficult to identify a trend that is statistically different from observations. Across both
observations and models, our results make it difficult to associate any declining trends in
precipitation in Southwestern Europe to anthropogenic forcing at this stage.
1. Introduction
A wide range of studies have reported a decrease in average precipitation in Mediterranean regions, with pronounced drying observed since the 1960s (Longobardi and Villani 2010, Gudmundsson and Seneviratne 2016). Decreasing trends have been reported for winter (Caloiero et al 2011, Hoer-ling et al 2012), spring (Paredes et al 2006) and
summer (Deitch et al 2017, Caloiero et al 2018). Other studies have attributed this decline in aver-age precipitation and the corresponding increase in the frequency of dry events to anthropogenic for-cing in the Mediterranean area or in Southern Europe (Hoerling et al2012, Barkhordarian et al2013, Gud-mundsson and Seneviratne2016). Gudmundsson et al (2017) suggested that these anthropogenic effects could impact the hydrological cycle across Southern
Europe, inducing significant streamflow decreases over large parts of the region.
However, it is well-recognized that observed hydroclimatic trends are largely influenced by the study period (Hannaford et al2013). Consequently,
where possible, it is important to analyse
precipitation trends from a long-term perspective to contextualise trends from shorter records. Based on extended multi-decadal data (>100 years), some investigations have highlighted the presence of strong interannual and interdecadal variability in South-western Europe (Esteban-Parra et al1998, Brunetti et al2006, Camuffo et al 2013). Therefore, decreas-ing trends in precipitation for Southwestern Europe since the 1960s may also be seen in the context of long-term climate variability rather than anthro-pogenically forced change. In addition, previous assessments of trends in long-term records have been subject to limitations given the sparse spatial cov-erage of observations and lack of consistency in the assessment of data quality. For example, some stud-ies have indicated that a considerable percentage of precipitation series in Southwestern Europe may be impacted by data errors, incompleteness, and/or tem-poral inhomogeneities, which could bias identified trends (Gonz´alez-Rouco et al2001, Begert et al2005, Gonz´alez-Hidalgo et al2011, Reiser and Kutiel2011, Turco and Llasat2011).
Reliable long-term assessment of precipita-tion changes is of particular importance for water resources in the region given the strong decline in water availability over recent decades (García-Ruiz et al 2011, Vicente-Serrano et al 2019). To address this gap, this study aims to revisit long-term (1850– 2018) precipitation series in southwestern Europe by compiling and analysing monthly time-series of precipitation, gridded databases and simulated pre-cipitation from different climate model experiments (CMIP3, CMIP5 and CMIP6). In addition to identi-fying trends from long-term records across the region, we examine whether it is possible to attribute pos-sible long-term changes to anthropogenic forcing based on climate model simulations for concurrent periods.
2. Material and methods
2.1. Data
We used long-term meteorological records derived from station observations and gridded datasets. Sta-tion observaSta-tions were taken from the dataset recently developed by Vicente-Serrano et al (2020a), com-prising 58 stations for the region spanning the years 1870–2018 and 22 spaning 1850–2018. The series were collected from national meteorological agencies in different countries (Spain, Portugal, France and Italy) and the Global Historical Climatology Network (GHCN) dataset (Menne et al 2012). The stations used have short gaps (less than 5% of the total record
missing) and the dataset has been quality assured and homogenised. Quality control was based on a com-parison of the anomaly of precipitation at each can-didate station with the closest five neighbouring sta-tions following a careful visual assessment in order to trim suspicious values, while keeping ‘real’ extreme values. To perform homogeneity testing, HOMER (HOMogenization software in R) was used (Mestre et al2013) in which each candidate series was com-pared with data from the best 5 correlated series. Most of the series were free of monthly inhomogeneities and in the few that showed a significant break, a cor-rection factor was applied. The series showed high spatial coherence, delineating homogeneous regions in terms of temporal variability (Vicente-Serrano et al2020a).
Figure S1 (available online atstacks.iop.org/ERL/ 15/094070/mmedia) provides the location of stations for different years of record available. Trends in pre-cipitation from station observations were compared with those derived from a set of global and contin-ental gridded climate datasets, including the Climate Research Unit (CRU) dataset TS v. 4.03 (Harris et al 2014), the Global Precipitation Climatology Centre (GPCC) dataset (Schneider et al2014) and the E-OBS v. 20.0e dataset from the European Climate Assess-ment & Data (ECA&D) (Cornes et al2018).
A common approach to characterize the general temporal variability of climate in a specific region is to use a single regional series, created using data from all available sites. This approach has been adopted in different precipitation studies in the Mediterranean (Hoerling et al2012, Gudmundsson and Seneviratne 2016, Hanel et al 2018). Although such composite series do not adequately reveal ‘real’ variability for specific areas, especially in regions with diverse cli-matic and geographical conditions like Southwestern Europe, we adopted this approach for a better com-parison with results from earlier research. Regional series were created from observational data using Thiessen polygons (Jones and Hulme1996). Follow-ing this method, a weighted average was calculated considering the total area represented by each station, so that stations located in areas with a high density of stations received less weight, compared to those situated in areas with sparse density. As the station density varies over time (supplementary figure 1), two regional series were created: 1850–2018 and 1870– 2018 (note that both series contain a different set of stations from 1870 to 2018). Regional precipita-tion series from the different gridded datasets (CRU, GPCC and ECA&D) were obtained using a simple arithmetic average of the gridded points within the entire study domain.
We also compare long-term precipitation trends from station observations with those derived from climate model outputs for concurrent years. To do so, we used historical simulations from the CMIP3 (Meehl et al 2007), CMIP5 (Taylor et al 2012) and
CMIP6 (Eyring et al2016) experiments. While the evolution of climate models from CMIP3 to CMIP6 includes improvements in model physics, parametriz-ations and spatial resolution, suggesting more reliable results from CMIP6 (even if the spread of the models is not reduced), we opted to include all experiments in our assessment. A primary reason for doing so is the different historical forcing included in each CMIP experiment, making it possible to explore whether there is an agreement between these different his-torical experiments in simulating long-term changes in precipitation for the study domain (Knutti and Sedl´aˇcek2013). For CMIP3, we used precipitation data from 25 models corresponding to the 20c3 m experiment and spanning the period from 1900 to 1999. We used data from the SRES A1B experiment for more recent decades (2000–2018). For CMIP5, we used precipitation from 47 models correspond-ing to the historical experiment from 1860 to 2005 and the RCP8.5 experiment from 2006 to 2018. For CMIP6, we used the data from 25 models correspond-ing to the historical experiment from 1850 to 2014, and the ssp585 experiment from 2015 to 2018. The list of models included is shown in table S1. Data corres-ponding to the SRES A1B (CMIP3), RCP8.5 (CMIP5) and ssp585 (CMIP6) scenarios were used, as the evol-ution of the CO2concentrations considered in these
scenario match well with the observed concentra-tions for the years considered. For each model in the three simulation experiments (CMIP3, CMIP5 and CMIP6), we obtained regional precipitation series by means of the average of the gridded points within the entire study domain.
We stress that it is not expected that the precipit-ation anomalies simulated by climate model experi-ments will be completely consistent with those iden-tified from observational data. However, given that models are forced by observed atmospheric com-position and external radiative forcing, they should be able to reproduce long-term precipitation trends, which should summarize long-term changes in these forcing conditions. Numerous studies have similarly assessed anthropogenic influence by comparing pre-cipitation trends from observations and those from model simulations (Donat et al2016, Knutson and Zeng2018).
Rather than employ just the ensemble mean from each CMIP experiment, we alo employ the individual model simulations to characterise the forced signal, internal variability and important dif-ferences in the mean and variance of individual runs (figure S2). Consequently, the series of obser-vations oscillate within the range of variability of the model ensembles (figure S3), which makes difficult to establish a comparison of the possible long and short term trends between observations and model simulations. Following Knutson and Zeng (2018), we base our comparison on standardized series in which both observed and modelled precipitation
were transformed to z-series with a mean of zero and standard deviation of one. A two-parameter Gamma distribution was used for this purpose fol-lowing the recommendation to calculate the Stand-ardized Precipitation Index (Mckee et al 1993). We also derived an annual and seasonal multi-model mean standardized series for each region from each of the three CMIP experiments. These multi-model mean series are assumed to capture the external for-cing common to all models, with the same mean and standard deviation as the observed series, thereby facilitating the comparison of trends. Given the different length of the series, we used a common refer-ence period (1901–2018) to calculate the parameters of the Gamma distribution.
2.2. Trend analysis
To assess the magnitude of change in seasonal and annual precipitation, we applied a linear regression model. The slope of the regression between the series of time (independent variable) and precip-itation (dependent variable) indicated the amount of change (mm/year), with higher slope values sug-gesting greater change and vice versa. Seasons were defined as: winter (DJF), spring (MAM), summer (JJA) and autumn (SON). The statistical signific-ance of trends was assessed using the non-parametric Mann-Kendall statistic, which measures the degree to which a trend is consistently increasing or decreas-ing. Statistical significance was tested at the 95% level (p < 0.05). The Mann–Kendall statistic is advantage-ous compared to parametric tests, as it is robust to outliers and does not assume any underlying probab-ility distribution of the data. A modified version of the Mann–Kendall statistic was also applied to account for the possible effect of autocorrelation, which might be present in the series and could affect the signific-ance of the trends (Hamed and Ramachandra Rao 1998). This statistic returns the corrected p values after accounting for the temporal pseudo-replication. In addition to this classical approach to trend detec-tion, we also computed the amount of change in precipitation using the relative amount of change (%) rather than the absolute amount (mm). This approach allows for spatial comparability between different stations and gridded points. Maps of trend results were produced for the relative amount of change (%), using a linear regression model that considers the start and the end years of the study period. Finally, since the amount of change and stat-istical significance of the defined trends are sens-itive to the selection of the study period (Hanna-ford et al 2013), we analysed trends for all possible temporal combinations, with a minimum period of 30 years in length between the start and end years of the study period (1851–2018). The results were illus-trated by means of heat maps, where the magnitude of change in mm/year and the trend significance are shown.
Figure 1. Evolution of the regional annual precipitation series over Southwestern Europe from the different datasets. Black line
corresponds to the regional precipitation series obtained from the precipitation stations with available data from 1870. Blue lines correspond to the rest of regional precipitation series.
2.3. Comparison between trends in observations and model simulations
We compared the trends in the annual and seasonal precipitation series from observations and model simulations The purpose of this analysis was not to attribute possible trends to antrophogenic forcing but to check the consistency of model simulations relat-ive to observations. Comparison was undertaken for periods starting in 1850, 1870, 1891 and 1901 and finishing in 2018, consistent with when the different available observational datasets start. We compared the magnitude of trend from observations with the trend in all available models from the three CMIP experiments. We used a statistical test to determine the equality of slope coefficients obtained from obser-vations and model simulations (Paternoster et al 1998), with the difference between the regression slopes assessed at the 0.05 level. This method allowed us to compare the magnitude of observed trends with the distribution of trends obtained by the different models.
3. Results/discussion
A key characteristic of the long-term annual precip-itation series for Southwestern Europe is the absence of major trends, but rather strong interannual vari-ability (figure1). The regional annual averages of the different precipitation gridded datasets (CRU, GPCC and ECA&D) show good agreement with regional averages obtained from the meteorological stations, with Pearson’s r coefficients above 0.90. The aver-ages obtained from all the available stations from
1870 show variability similar to the regional series generated with the 22 available stations from 1850. Very dry years are evident in the 1850s, 1920s, 1940s and 2010s. Dry years are also well identified in the annual series derived using the CRU and GPCC data-sets. In addition, these two datasets show strong temporal agreement with the annual and seasonal regional series obtained using observations from 1870 onwards. Agreement is also very good with the annual regional series generated from the ECA&D dataset, but in this case there is some negative bias relative to the observed station series during the thirty year period starting in the 1980s.
The magnitude of trends identified from the dif-ferent regional series depends on their length and period of analysis (figure 2). There are no long-term significant trends identified from the differ-ent regional annual precipitation series. This suggests that for the Southwestern European region as a whole, there is no consistent long-term trend in annual pre-cipitation, at least over the past 170 years. Significant trends that are identified are not persistent and are recorded during relatively short periods with altern-ating sign. Thus, significant decreasing trends tend to be identified from the 1920s to the 1950s and from the 1960s to the 2000s, while significant increasing trends tend to appear between the 1880s and 1920s and from the 1940s to the 1980s. Notably, annual precipitation from the ECA&D series shows a stronger decreas-ing trend from the 1960s to present than the other datasets.
Spatially, the magnitude and statistical signi-ficance of trends in annual precipitation show
Figure 2. Heat maps of running trends in regional annual precipitation series from the different datasets, considering different
periods with a minimum of 30 years. X and Y-axes indicate the start and end years of the time slices, respectively. The scale indicates the magnitude of the trend (mm/year) based on the slope of the linear regression analysis. Dotted lines indicate periods with a significant trend (p < 0.05).
Figure 3. Annual precipitation trends in the station based observations for periods starting in 1871, 1901, 1931, 1961 and 1991
and ending in 2018. The magnitude of change is given in mm/year and in %.
important differences among stations and periods of analysis (figure3). The percentage of statistically significant trends is small over the different periods (table1). Similar results are found for the CRU and the GPCC datasets, which show some decreasing trends in parts of central Italy and Southern Iberia from 1901 to 2018 and a more general decrease from 1961 to 2018 (figure S4). However, trends are not stat-istically significant in most regions. Again, the largest decreases are obtained with the ECA&D dataset from 1961 to 2018, characterised by a large decrease of pre-cipitation in Southern France and Northern Italy, and particularly the Iberian Peninsula, where large areas show negative and significant trends. These findings from ECA&D are not consistent with those from any of the other series we analyse and raise questions as to the homogeneity of the dataset for the region.
As the strongest and most widespread negat-ive trends in annual precipitation over the period 1961–2018 in the ECA&D dataset affects the Iberian Peninsula, this opens an opportunity for comparison with a recently developed, quality controlled and homogenised gridded precipitation dataset for Spain, based on more than 2000 meteorological stations for the period 1961–2018 (Vicente-Serrano et al2017b). ECA&D precipitation series are not homogenised (Hofstra et al2009), while the density of stations for the region changes over time (Cornes et al2018). The correlation between the regional series of annual pre-cipitation for Spain obtained from the ECA&D and from the Spanish dataset is high (Pearson’s r = 0.94), but the series obtained from the ECA&D dataset shows a stronger precipitation decrease (15.5%) than the regional series generated from the Spanish
data-set (3.9%) over the period 1961–2018 (figure S5). In the ECA&D dataset more than 20% of Spain shows a negative and significant trend in annual precipita-tion, versus only 3.6% in the quality assured Spanish dataset. We hypothesise that the low number of met-eorological stations available for Spain in the ECA&D dataset (≈ 50) (Cornes et al2018), together with the lack of homogeneity testing explain this divergence. These issues may also explain why regional studies focusing on high-density homogenised national data-sets in Spain (Gonz´alez-Hidalgo et al2011) and Italy (Brunetti et al2006, Fatichi and Caporali 2009) do not show such large negative trends during the second half of the twentieth century, as suggested by the ECA&D.
Our results clearly show that the statistical signi-ficance of trends in annual precipitation in South-western Europe is strongly dependent on the study period and that no statistically significant long-term trends can be detected at least from the last 170 years of observations. Several studies have sugges-ted circulation mechanisms that explain interannual and decadal precipitation variability in Southwestern Europe. Large scale patterns like the North Atlantic Oscillation (NAO), the Eastern Atlantic Pattern (EA) or the Scandinavian Pattern (SCAN) strongly con-trol the interannual variability and thus short term precipitation trends over Southwestern Europe (Trigo et al2009, Sousa et al2011, Ferrari et al2013, Vergni et al2016, Mellado-Cano et al2019). Other regional patterns like the Western Mediterranean Oscillation or the Mediterranean Oscillation also control pre-cipitation trends in more specific areas of the study domain (Lopez-Bustins et al 2008). The Atlantic Multi-decadal Oscillation also explains decadal vari-ability of precipitation in the region (Mariotti and Dell’Aquila2012). Precipitation decreases during the period 1960–2000 are compatible with the evolution of the NAO (Paredes et al 2006, Matti et al 2009, Altava-Ortiz et al2011), characterised by predomin-antly low values during the 1960s that would explain the general wet conditions recorded in the region. Predominantly high NAO values in the 1980s and 1990s are consistent with more frequent dry years.
At the seasonal scale, the different regional pre-cipitation series also show strong agreement (figure S6) and are also characterised by strong interannual variability from 1850 to 2018. Thus, periods of high and low precipitation are recorded over the entire period and, as with annual precipitation, statistic-ally significant trends are typicstatistic-ally only representat-ive for short periods of time (figure S7). For example, the decrease in winter precipitation is only signific-ant in Southwestern Europe for the period 1960– 2000. On the contrary, the analysis of the long term regional series from 1850 and 1870 shows a long-term positive trend in winter precipitation, which is statistically significant for tests starting between 1850 and 1890 and ending in 2018. As with annual
Table 1. Percentage of land area within the domain showing
positive and negative trends in annual precipitation, as derived from the different precipitation datasets, based on the statistical significance thresholds. 1871 1901 1931 1961 1991 Meteorological Station Positive (p < 0.05) 10.8 12.1 15.7 7.9 7.9 Positive (p > 0.05) 17.2 25.5 35.6 24.6 43.3 Negative (p > 0.05) 63.9 55.5 45.5 56.4 37.7 Negative (p < 0.05) 8.1 6.9 3.3 11.1 11.1 CRU Positive (p < 0.05) 2.8 0.2 0.0 0.7 Positive (p > 0.05) 32.8 20.7 13.4 54.7 Negative (p > 0.05) 51.8 73.2 83.4 43.9 Negative (p < 0.05) 12.7 6.0 3.2 0.6 GPCC Positive (p < 0.05) 6.5 0.7 2.2 2.9 Positive (p > 0.05) 38.4 37.7 22.5 52.9 Negative (p > 0.05) 40.6 57.2 70.3 43.5 Negative (p < 0.05) 14.5 4.3 5.1 0.7 ECA&D Positive (p < 0.05) 3.3 6.9 Positive (p > 0.05) 19.5 52.9 Negative (p > 0.05) 55.6 34.4 Negative (p < 0.05) 21.6 5.9
precipitation, the ECA&D dataset returns stronger negative trends for winter and summer precipitation from the 1960s to the 2000s, relative to other datasets. Spatially there are some differences in the sign and magnitude of seasonal precipitation trends, based on the observed station series (figure S8, table S2) and the gridded datasets (figures S9–S11). Nevertheless, with the exception of the identified decrease in sum-mer precipitation in Southern Iberia between 1961 and 2018 and the decrease in autumn precipitation in Southern France and Northern Italy between 1991 and 2018, the trends are not significant. We note that given the dominant influence of the subtrop-ical Azores high, summer precipitation in Southern Iberia is close to zero (Ninyerola et al2007), so small changes in the total precipitation could drive statist-ically significant changes. Otherwise, the spatial pat-terns in seasonal trends are consistent between the different gridded datasets and station based observa-tions, while being consistent with other studies that have analysed seasonal precipitation trends over dif-ferent regions of Southwestern Europe for various study periods (Brunetti et al2006, Gonz´alez-Hidalgo et al2011, Río et al2011, Ramos et al2012, de Luis et al2014, Scorzini and Leopardi2019).
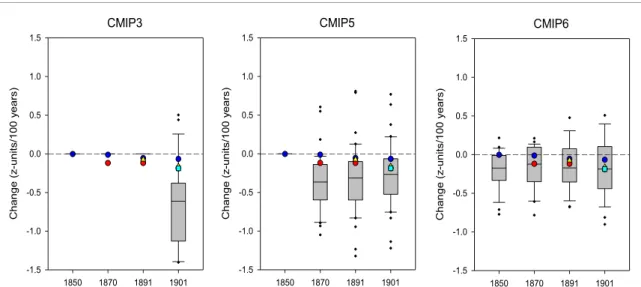
The CMIP3 and CMIP5 simulation experiments show large differences with the observed long-term changes in annual precipitation. The distribution of the linear regression slope coefficients in the CMIP3 models from 1901 to 2018 shows a large decline of precipitation in most models. This reduction is stronger than in the different observational datasets (figure4). In the CMIP5 models, the pre-dominantly
Figure 4. Box plots showing the distribution of the magnitude of annual precipitation trends in the three CMIP model simulation
experiments for four different periods. The central horizontal line shows the median, the shaded box is defined by the 25th and 75th percentiles, the whiskers represent the 10th and 90th percentiles and the dots represent the cases above or below the 10th and 90th percentiles. Color points represent the magnitude of change in observational datasets; blue circle: stations 1850, red circle: stations 1870, yellow triangle: GPCC, cyan square: CRU.
declining trends are also stronger than the trends in observations for the periods starting in 1870 and 1891. On the contrary, in the CMIP6 ensemble the distribution of the slope coefficients is closer to observations and only shows greater decreases than observations in the period 1850–2018. For the peri-ods starting in 1870, 1891 and 1901, the magnitude of the trend in observations is within the range of trends obtained by 50%–75% of models that show modest precipitation reductions.
The standardized ensemble mean annual precip-itation series, obtained from CMIP6 models, shows stationarity from circa 1870 to 2018, but CMIP3 and CMIP5 mean ensembles show a general decrease (fig-ure S12). Seasonally, the models tend to produce smaller precipitation increases than the observations in winter, when the observations show a weak positive trend (Figure S13). CMIP3 and CMIP5 models seem to capture adequately the observed trends during spring and autumn; summer and winter trends are only well reproduced in CMIP5 since 1901. CMIP6 models agree with observations for all seasons and periods, except for winter, which is only well captured since 1901.
Although CMIP3 and CMIP5 models show lar-ger decreasing long-term trends than observations, in the majority of cases they are not significantly differ-ent than the observations (p > 0.05) (figures S14 and S15). This is because the strong interannual variab-ility of precipitation in the observations and model simulations drive high standard errors in the regres-sion slopes. In the CMIP6 ensemble only a few models (< 5%) show a trend statistically different from the observations. It seems that the quality of the mod-els in reproducing the observed trends in Southwest-ern Europe has improved along the successive CMIP phases. Moreover, the dominant sign and significance
of the long-term seasonal and annual precipitation trends in the model simulations tend to agree with observations in most cases (table S3).
According to observations and the more recent models, the region does not show robust long-term decreasing trends in precipitation, at least since 1850, with strong interannual and interdecadal variations as the dominant feature in observations, and high internal variability in model simulations (Lionello and Scarascia2018, Seager et al2019). This makes it difficult to attribute a possible antrophogenic signal hypothesised in prevous studies. Although the spa-tial domain of our study is smaller than in previous attribution studies over the Mediterranean (Hoer-ling et al2012) or Southern Europe (Gudmundsson and Seneviratne 2016), we stress that in the region covered here, these studies also suggested persist-ent decreases in average precipitation. Such changes are not detected in observational datasets analysed in our study nor in the most recent CMIP6 model simulations.
The lack of significant decreasing trends in observed seasonal and annual precipitation trends is highly relevant for understanding different envir-onmental and hydrological processes associated with precipitation decreases in recent decades. For example, an increase in the frequency of forest decay episodes and reductions in forest growth in South-western Europe (Carnicer et al2011, Camarero et al 2015), together with large declines in streamflow have been observed over recent decades (L´opez-Moreno et al2011, Vicente-Serrano et al2019). According to our results, the explanation for these processes lies, at least partially, in factors other than precipitation decline. In relation to streamflow reductions, agricul-tural and livestock abandonment in large mountain headwaters (Sanju´an et al 2018), have encouraged
natural revegetation over recent decades (García-Ruiz and Lana-Renault 2011, García-Ruiz et al 2011), increasing water consumption by forests and shrubs (Martínez-Fern´andez et al2013, Schumacher et al 2019). In addition, large increases in water demands from economic activities, has dramatically reduced streamflow downstream of large irrigation polygons (L´opez-Moreno et al2004, Vicente-Serrano et al2017a).
Although precipitation in the Mediterranean region has not declined in the long-term, the cli-mate dryness has increased in the last four dec-ades as a consequence of anthropogenically forced warming in the region, with an increase in arid-ity (Fu and Feng2014, Vicente-Serrano et al2020b) and stronger drought events during dry years given enhanced Atmospheric Evaporative Demand (AED) (Stagge et al 2017, Gonz´alez-Hidalgo et al 2018, García-Herrera et al2019). However, we stress here that this increase in dryness is independent of the precipitation evolution in the region. In addition, a change in precipitation intensity which could also have some role on the dryness, does not show an homogeneous spatial and temporal pattern over the region. For example, different studies in the Iberian Peninsula have shown that there is not an increase in precipitation intensity, and the total precipita-tion amount is distributed more regularly among precipitation days (L´opez-Moreno et al 2010, Gal-lego et al 2011, Acero et al 2012, Serrano-Notivoli et al 2018). Nevertheless, an increase in precipita-tion intensity has been suggested in Southern France and areas of Italy (Brunetti et al 2004, Piccarreta et al 2013, Ribes et al 2019). This could contrib-ute to enhancing drying given smaller precipitation totals during low and moderate rainy days, and the enhanced increase of AED during non-rainy days (Rivoire et al2019).
4. Conclusions
This study provides a robust assessment of variability and change in precipitation in Southwestern Europe based on long-term, high quality series and model simultations over the entire region. The use of these series allows us to conclude that there is a lack of statistically significant trends in long-term records. Precipitation in Southwestern Europe is character-ised by strong interannual and decadal variability at the annual and seasonal scales, showing no long-term trends when using different precipitation data-sets. Moreover, we have shown that trends depend crucially on the period of record and dataset used, while the variability in trend magnitude and direc-tion across seasons suggests different driving mechan-isms. The observed decrease in precipitation between 1961–2000 in the ECA&D data is likely affected by uncertainties introduced in this dataset due to the low density of stations, their varying densities over time,
and the lack of temporal homogeneity of some series. Consequently, it is important to develop quality-controlled and homogenised long-term datasets of precipitation and to secure reliable records that allow for a more robust assessment of long-term precipita-tion in the region.
CMIP3 and CMIP5 do not capture the observed trends well. However, CMIP6 models show strong agreement with observations, except in winter, for long-term periods, suggesting higher quality in the most recent experiments. This also suggests that it is not possible to consider a dominant long-term precipitation decrease based on model simulations. Assessments based on ensemble means from the dif-ferent CMIP experiments could reinforce trends of dryness (Mariotti et al2008,2015) and the severity of drought events (Orlowsky and Seneviratne2013) in this region in comparison to the information content available from the individual ensemble members.
Taking all these findings into consideration there is an urgent need to better understand the dynamic and thermodynamic mechanisms responsible for precipitation variability and change in the region. Given the importance of precipitation for water resources, social and economic well-being and envir-onmental processes, a comprehensive understanding of the observed variability and change presented here is critical.
Acknowledgments
This work was supported by the research projects CGL2017-82216-R, CGL2017-83866-C3-3-R and PCI2019-103631, financed by the Spanish Commis-sion of Science and Technology and FEDER; CROSS-DRO project financed by the AXIS (Assessment of Cross(X)—sectoral climate Impacts and pathways for Sustainable transformation), JPI-Climate co-funded call of the European Commission and INDE-CIS which is part of ERA4CS, an ERA-NET initi-ated by JPI Climate, and funded by FORMAS (SE), DLR (DE), BMWFW (AT), IFD (DK), MINECO (ES), ANR (FR) with co-funding by the European Union (Grant 690462). Dhais Peña-Angulo received a ‘Juan de la Cierva’ postdoctoral contract (FJCI-2017-33652 Spanish Ministry of Economy and Com-petitiveness, MEC). Conor Murphy was suppor-ted by the Irish Environmental Protection Agency (Grant Nos. 2019-CCRP-MS.60). Marco Turco has received funding from the Spanish Ministry of Sci-ence, Innovation and Universities through the project PREDFIRE (RTI2018-099711-J-I00), which is co-financed with the European Regional Development Fund (ERDF/FEDER).
Author contributions
AD and V-SSM conceived research, V-SSM and P-AD perfomed the research, V-SSM, P-P-AD and EKA
wrote the first draft of the manuscript, D-CF, FR, CM, TY, RT and MYL contributed with data inputs and analysis, G-HJC, CM, G-HR, RT and T-BM helped to provide essential interpretations of the results, A-BM and NI contributed with figure design. All authors contributed to writing and editing the manuscript.
Competing interests
The authors declare that they have no competing interests.
Data availability
Some of the data that supports the finding of this study are openly available (https://crudata.uea.acuk/ cru/data/hrg/, https://www.dwd.de/EN/ourservices/ gpcc/gpcc.html, https://www.ecad.eu/download/ens embles/download.php,https://esgf-node.llnl.gov/pro jects/cmip6/, https://esgf-node.llnl.gov/projects/cmi p5/,https://esgf-node.llnl.gov/projects/cmip3/). The Long-term precipitation data and the gridded precip-itation data for Spain that support the findings of this study are available from the corresponding author upon reasonable request. No new data were created or analysed in this study.
ORCID iDs
Y Tramblay https://orcid.org/0000-0003-0481-5330 M Turcohttps://orcid.org/0000-0001-8589-7459 A El Kenawy https://orcid.org/0000-0001-6639-6253References
Acero F J, Gallego M C and García J A 2012 Multi-day rainfall trends over the Iberian Peninsula Theor. Appl. Climatol.
108 411–23
Altava-Ortiz V, Llasat M-C, Ferrari E, Atencia A and Sirangelo B 2011 Monthly rainfall changes in central and Western Mediterranean basins, at the end of the 20th and beginning of the 21st centuries Int. J. Climatol.31 1943–58
Barkhordarian A, von Storch H and Bhend J 2013 The expectation of future precipitation change over the Mediterranean region is different from what we observe Clim. Dyn.
40 225–44
Begert M, Schlegel T and Kirchhofer W 2005 Homogeneous temperature and precipitation series of Switzerland from 1864 to 2000 Int. J. Climatol.25 65–80
Brunetti M, Buffoni L, Mangianti F, Maugeri M and Nanni T 2004 Temperature, precipitation and extreme events during the last century in Italy Glob. Planet. Change40 141–9
Brunetti M, Maugeri M, Monti F and Nanni T 2006 Temperature and precipitation variability in Italy in the last two centuries from homogenised instrumental time series Int. J. Climatol.
26 345–81
Caloiero T, Coscarelli R, Ferrari E and Mancini M 2011 Precipitation change in Southern Italy linked to global scale oscillation indexes Nat. Hazards Earth Syst. Sci.11 1683–94
Caloiero T, Veltri S, Caloiero P and Frustaci F 2018 Drought analysis in Europe and in the Mediterranean basin using the standardized precipitation index Water10 1043
Camarero J J, Gazol A, Sangüesa-Barreda G, Oliva J and Vicente-Serrano S M 2015 To die or not to die: early warnings of tree dieback in response to a severe drought J.
Ecol.103 44–57
Camuffo D, Bertolin C, Diodato N, Cocheo C, Barriendos M, Dominguez-Castro F, Garnier E, Alcoforado M J and Nunes M F 2013 Western Mediterranean precipitation over the last 300 years from instrumental observations Clim.
Change117 85–101
Carnicer J, Coll M, Ninyerola M, Pons X, S´anchez G and Peñuelas J 2011 Widespread crown condition decline, food web disruption, and amplified tree mortality with increased climate change-type drought Proc. Natl Acad. Sci. U. S. A.
108 1474–8
Cornes R C, van der Schrier G, van den Besselaar E and Jones P D 2018 An ensemble version of the E-OBS temperature and precipitation data sets J. Geophys. Res. Atmos.
123 9391–409
Deitch M J, Sapundjieff M J and Feirer S T 2017 Characterizing precipitation variability and trends in the world’s mediterranean-climate areas Water9 259
Donat M G, Lowry A L, Alexander L V, O’Gorman P A and Maher N 2016 More extreme precipitation in the world’s dry and wet regions Nat. Clim. Chang.6 508–13
Esteban-Parra M J, Rodrigo F S and Castro-Diez Y 1998 Spatial and temporal patterns of precipitation in Spain for the period 1880-1992 Int. J. Climatol.18 1557–74
Eyring V, Bony S, Meehl G A, Senior C A, Stevens B, Stouffer R J and Taylor K E 2016 Overview of the coupled model intercomparison project phase 6 (CMIP6) experimental design and organization Geosci. Model Dev.9 1937–58
Fatichi S and Caporali E 2009 A comprehensive analysis of changes in precipitation regime in Tuscany Int. J. Climatol.
29 1883–93
Ferrari E, Caloiero T and Coscarelli R 2013 Influence of the North Atlantic oscillation on winter rainfall in Calabria (southern Italy) Theor. Appl. Climatol.114 479–94
Fu Q and Feng S 2014 Responses of terrestrial aridity to global warming J. Geophys. Res.119 7863–75
Gallego C, Trigo R, Vaquero J, Brunet M, García J, Sigr´o J and Valente M 2011 Trends in frequency indices of daily precipitation over the Iberian Peninsula during the last century J. Geophys. Res.116 D02109
García-Herrera R, Garrido-P´erez J M, Barriopedro D, Ord´oñez C, Vicente-Serrano S M, Nieto R, Gimeno L, Sorí R and Yiou P 2019 The European 2016/2017 drought J. Clim.
32 3169–87
García-Ruiz J M and Lana-Renault N 2011 Hydrological and erosive consequences of farmland abandonment in Europe, with special reference to the Mediterranean region - a review
Agric. Ecosyst. Environ.140 317–38
García-Ruiz J M, L´opez-Moreno J I, Vicente-Serrano S M, Lasanta-Martínez T and Beguería S 2011 Mediterranean water resources in a global change scenarioEarth-Sci. Rev.105 121–39
Gonz´alez-Hidalgo J C, Brunetti M and de Luis M 2011 A new tool for monthly precipitation analysis in Spain: MOPREDAS database (monthly precipitation trends December 1945-November 2005) Int. J. Climatol.31 715–31
Gonz´alez-Hidalgo J C, Vicente-Serrano S M, Peña-Angulo D, Salinas C, Tomas-Burguera M and Beguería S 2018 High-resolution spatio-temporal analyses of drought episodes in the western Mediterranean basin (Spanish mainland, Iberian Peninsula) Acta Geophys.66 381–92
Gonz´alez-Rouco J F, Jim´enez J L, Quesada V and Valero F 2001 Quality control and homogeneity of precipitation data in the southwest of Europe J. Clim.14 964–78
Gudmundsson L and Seneviratne S I 2016 Anthropogenic climate change affects meteorological drought risk in Europe
Environ. Res. Lett.11 044005
Gudmundsson L, Seneviratne S I and Zhang X 2017 Anthropogenic climate change detected in European renewable freshwater resources Nat. Clim. Chang.7 813–6
Hamed K H and Ramachandra Rao A 1998 A modified Mann-Kendall trend test for autocorrelated data J. Hydrol.
204 182–96
Hanel M, Rakovec O, Markonis Y, M´aca P, Samaniego L, Kyselý J and Kumar R 2018 Revisiting the recent European droughts from a long-term perspective Sci. Rep.8 9499
Hannaford J, Buys G, Stahl K and Tallaksen L M 2013 The influence of decadal-scale variability on trends in long European streamflow records Hydrol. Earth Syst. Sci.
17 2717–33
Harris I, Jones P D, Osborn T J and Lister D H 2014 Updated high-resolution grids of monthly climatic observations – the CRU TS3.10 dataset Int. J. Climatol.34 623–42
Hoerling M et al 2012 On the increased frequency of mediterranean drought J. Clim.25 2146–61
Hofstra N, Haylock M, New M and Jones P D 2009 Testing E-OBS European high-resolution gridded data set of daily precipitation and surface temperature J. Geophys. Res.
Atmos.114 D21101
Jones P D and Hulme M 1996 Calculating regional climatic time series for temperature and precipitation: methods and illustrations Int. J. Climatol.16 361–77
Knutson T R and Zeng F 2018 Model assessment of observed precipitation trends over land regions: detectable human influences and possible low bias in model trends J. Clim.
31 4617–37
Knutti R and Sedl´aˇcek J 2013 Robustness and uncertainties in the new CMIP5 climate model projections Nat. Clim. Chang.
3 369–73
Lionello P and Scarascia L 2018 The relation between climate change in the Mediterranean region and global warming
Reg. Environ. Change18 1481–93
Longobardi A and Villani P 2010 Trend analysis of annual and seasonal rainfall time series in the Mediterranean area Int. J.
Climatol.30 1538–46
Lopez-Bustins J-A, Martin-Vide J and Sanchez-Lorenzo A 2008 Iberia winter rainfall trends based upon changes in teleconnection and circulation patterns Glob. Planet. Change
63 171–6
L´opez-Moreno J I, Beguería S and García-Ruiz J M 2004 The management of a large Mediterranean reservoir: storage regimens of the Yesa Reservoir, Upper Aragon river basin, central Spanish Pyrenees Environ. Manage.34 508–15
L´opez-Moreno J I, Vicente-Serrano S M, Angulo-Martínez M, Beguería S and Kenawy A 2010 Trends in daily precipitation on the northeastern Iberian Peninsula, 1955–2006 Int. J.
Climatol.30 1026–41
L´opez-Moreno J I, Vicente-Serrano S M, Moran-Tejeda E, Zabalza J, Lorenzo-Lacruz J and García-Ruiz J M 2011 Impact of climate evolution and land use changes on water yield in the ebro basin Hydrol. Earth Syst. Sci.15 311–22
de Luis M, ˇCufar K, Saz M A, Longares L A, Ceglar A and Kajfež-Bogataj L 2014 Trends in seasonal precipitation and temperature in Slovenia during 1951–2007 Reg. Environ.
Change14 1801–10
Mariotti A and Dell’Aquila A 2012 Decadal climate variability in the Mediterranean region: roles of large-scale forcings and regional processes Clim. Dyn.38 1129–45
Mariotti A, Pan Y, Zeng N and Alessandri A 2015 Long-term climate change in the Mediterranean region in the midst of decadal variability Clim. Dyn.44 1437–56
Mariotti A, Zeng N, Yoon J-H, Artale V, Navarra A, Alpert P and Li L Z X 2008 Mediterranean water cycle changes: transition to drier 21st century conditions in observations and CMIP3 simulations Environ. Res. Lett.3 044001
Martínez-Fern´andez J, S´anchez N and Herrero-Jim´enez C M 2013 Recent trends in rivers with near-natural flow regime: the case of the river headwaters in Spain Prog. Phys. Geogr.
37 685–700
Matti C, Pauling A, Küttel M and Wanner H 2009 Winter precipitation trends for two selected European regions over the last 500 years and their possible dynamical background
Theor. Appl. Climatol.95 9–26
Mckee T B, Doesken N J and Kleist J 1993 The relationship of drought frequency and duration to time scales Eighth Conf.
Appl. Climatol Anaheim. CA. Ameer. Meteor. Soc. pp 179–184
Meehl G A, Covey C, Delworth T, Latif M, Mcavaney B, Mitchell J F B, Stouffer R J and Taylor K E 2007 The WCRP CMIP3 multimodel dataset: a new era in climatic change research Bull. Am. Meteorol. Soc.88 1383–94
Mellado-Cano J, Barriopedro D, García-Herrera R, Trigo R M and Hern´andez A 2019 Examining the North Atlantic
oscillation, East Atlantic Pattern, and jet variability since 1685 J. Clim.32 6285–98
Menne M J, Durre I, Vose R S, Gleason B E and Houston T G 2012 An overview of the global historical climatology
network-daily database J. Atmos. Ocean. Technol.29 897–910
Mestre O et al 2013 HOMER: a homogenization software -methods and applications Idojaras 117 47–67
Ninyerola M, Pons X and Roure J M 2007 Monthly precipitation mapping of the Iberian Peninsula using spatial interpolation tools implemented in a geographic information system
Theor. Appl. Climatol.89 195–209
Orlowsky B and Seneviratne S I 2013 Elusive drought: uncertainty in observed trends and short-and long-term CMIP5 projections Hydrol. Earth Syst. Sci.17 1765–81
Paredes D, Trigo R M, Garcia-Herrera R and Trigo I F 2006 Understanding precipitation changes in Iberia in early spring: weather typing and storm-tracking approaches J.
Hydrometeorol.7 101–13
Paternoster R, Brame R, Mazerolle P and Piquero A 1998 Using the correct statistical test for equality of regression coefficients Criminology36 859–66
Piccarreta M, Pasini A, Capolongo D and Lazzari M 2013 Changes in daily precipitation extremes in the Mediterranean from 1951 to 2010: the Basilicata region, southern Italy Int. J.
Climatol.33 3229–48
Ramos M C, Balasch J C and Martínez-Casasnovas J A 2012 Seasonal temperature and precipitation variability during the last 60 years in a Mediterranean climate area of Northeastern Spain: a multivariate analysis Theor. Appl.
Climatol.110 35–53
Reiser H and Kutiel H 2011 Rainfall uncertainty in the
Mediterranean: time series, uncertainty, and extreme events
Theor. Appl. Climatol.104 357–75
Ribes A, Thao S, Vautard R, Dubuisson B, Somot S, Colin J, Planton S and Soubeyroux J-M 2019 Observed increase in extreme daily rainfall in the French Mediterranean Clim.
Dyn.52 1095–114
Río S D, Herrero L, Fraile R and Penas A 2011 Spatial distribution of recent rainfall trends in Spain (1961-2006) Int. J.
Climatol.31 656–67
Rivoire P, Tramblay Y, Neppel L, Hertig E and Vicente-Serrano S M 2019 Impact of the dry-day definition on Mediterranean extreme dry-spell analysis Nat. Hazards Earth Syst. Sci.
19 1629–38
Sanju´an Y, Arn´aez J, Beguería S, Lana-Renault N, Lasanta T, G´omez-Villar A, ´Alvarez-Martínez J, Coba-P´erez P and García-Ruiz J M 2018 Woody plant encroachment following grazing abandonment in the subalpine belt: a case study in northern Spain Reg. Environ. Change18 1103–15
Schneider U, Becker A, Finger P, Meyer-Christoffer A, Ziese M and Rudolf B 2014 GPCC’s new land surface precipitation climatology based on quality-controlled in situ data and its role in quantifying the global water cycle Theor. Appl.
Climatol.115 15–40
Schumacher D L, Keune J, van Heerwaarden C C, de Arellano J V G, Teuling A J and Miralles D G 2019 Amplification of mega-heatwaves through heat torrents fuelled by upwind drought Nat. Geosci.12 712–7
Scorzini A R and Leopardi M 2019 Precipitation and temperature trends over central Italy (Abruzzo Region): 1951–2012
Theor. Appl. Climatol.135 959–77
Seager R, Osborn T J, Kushnir Y, Simpson I R, Nakamura J and Liu H 2019 Climate variability and change of
Serrano-Notivoli R, Beguería S, Saz M ´A and de Luis M 2018 Recent trends reveal decreasing intensity of daily precipitation in Spain Int. J. Climatol.38 4211–24
Sousa P M, Trigo R M, Aizpurua P, Nieto R, Gimeno L and Garcia-Herrera R 2011 Trends and extremes of drought indices throughout the 20th century in the Mediterranean
Nat. Hazards Earth Syst. Sci.11 33–51
Stagge J H, Kingston D G, Tallaksen L M and Hannah D M 2017 Observed drought indices show increasing divergence across Europe Sci. Rep.7 14045
Taylor K E, Stouffer R J and Meehl G A 2012 An overview of CMIP5 and the experiment design Bull. Am. Meteorol. Soc.
93 485–98
Trigo R, Valente M, Trigo I, Miranda P, Ramos A, Paredes D and García-Herrera R 2009 The impact of North Atlantic wind and cyclone trends on European precipitation and significant wave height in the Atlantic Ann. N. Y. Acad. Sci.
1146 212–34
Turco M and Llasat M C 2011 Trends in indices of daily precipitation extremes in Catalonia (NE Spain), 1951–2003
Nat. Hazards Earth Syst. Sci.11 3213–26
Vergni L, Di Lena B and Chiaudani A 2016 Statistical characterisation of winter precipitation in the Abruzzo region (Italy) in relation to the North Atlantic oscillation (NAO) Atmos. Res.178–179 279–90
Vicente-Serrano S et al 2020a Long term variability and trends of droughts in Western Europe (1851-2018) Int. J. Climatol. in preparation
Vicente-Serrano S et al 2017a Extreme hydrological events and the influence of reservoirs in a highly regulated river basin of northeastern Spain J. Hydrol. Reg. Stud.12 13–32
Vicente-Serrano S M, Mcvicar T, Miralles D, Yang Y and Tomas-Burguera M 2020b Unravelling the influence of atmospheric evaporative demand on drought under climate dynamics WIREs Clim Change11 e632
Vicente-Serrano S M et al 2019 Climate, irrigation, and land-cover change explain streamflow trends in countries bordering the Northeast Atlantic Geophys. Res. Lett.46 10821–33
Vicente-Serrano S M, Tomas-Burguera M, Beguería S, Reig F, Latorre B, Peña-Gallardo M, Luna M Y, Morata A and Gonz´alez-Hidalgo J C 2017b A high resolution dataset of drought indices for spain Data2 22