HAL Id: hal-02622898
https://hal.inrae.fr/hal-02622898
Submitted on 26 May 2020
HAL is a multi-disciplinary open access archive for the deposit and dissemination of sci-entific research documents, whether they are pub-lished or not. The documents may come from teaching and research institutions in France or abroad, or from public or private research centers.
L’archive ouverte pluridisciplinaire HAL, est destinée au dépôt et à la diffusion de documents scientifiques de niveau recherche, publiés ou non, émanant des établissements d’enseignement et de recherche français ou étrangers, des laboratoires publics ou privés.
Distributed under a Creative Commons Attribution| 4.0 International License
mosaic genomes in gene pools resulting from reticulate
evolution: a case study in diploid and polyploid citrus
Dalel Ahmed, Aurore Comte, Franck Curk, Gilles Costantino, François Luro,
Alexis Dereeper, Pierre Mournet, Yann Froelicher, Patrick Ollitrault
To cite this version:
Dalel Ahmed, Aurore Comte, Franck Curk, Gilles Costantino, François Luro, et al.. Genotyping by sequencing can reveal the complex mosaic genomes in gene pools resulting from reticulate evolution: a case study in diploid and polyploid citrus. Annals of Botany, Oxford University Press (OUP), 2019, 123 (7), pp.1231-1251. �10.1093/aob/mcz029�. �hal-02622898�
This is an Open Access article distributed under the terms of the Creative Commons Attribution License (http://creativecommons.org/licenses/ by/4.0/), which permits unrestricted reuse, distribution, and reproduction in any medium, provided the original work is properly cited. © The Author(s) 2019. Published by Oxford University Press on behalf of the Annals of Botany Company.
Genotyping by sequencing can reveal the complex mosaic genomes in gene pools
resulting from reticulate evolution: a case study in diploid and polyploid citrus
Dalel Ahmed1, Aurore Comte2,3, Franck Curk4, Gilles Costantino1, François Luro1, Alexis Dereeper2,3,
Pierre Mournet4,5, Yann Froelicher4,6 and Patrick Ollitrault4,6,*
1UMR AGAP, INRA, CIRAD, Montpellier SupAgro, Université de Montpellier, F-20230 San Giuliano, France, 2IRD, CIRAD,
Université de Montpellier, IPME, F-34394 Montpellier, France, 3South Green Bioinformatics Platform, Bioversity, CIRAD,
INRA, IRD, F-34394 Montpellier, France, 4UMR AGAP, INRA, CIRAD, Montpellier SupAgro, Université de Montpellier,
F-34398 Montpellier, France, 5CIRAD, UMR AGAP, F-34398 Montpellier, France and 6CIRAD, UMR AGAP, F-20230 San
Giuliano, France.
* For correspondence. E-mail [email protected]
Received: 6 November 2018 Returned for revision: 17 January 2019 Editorial decision: 12 February 2019 Accepted: 18 February 2019
• Background and Aims Reticulate evolution, coupled with reproductive features limiting further interspecific recombinations, results in admixed mosaics of large genomic fragments from the ancestral taxa. Whole-genome sequencing (WGS) data are powerful tools to decipher such complex genomes but still too costly to be used for large populations. The aim of this work was to develop an approach to infer phylogenomic structures in diploid, triploid and tetraploid individuals from sequencing data in reduced genome complexity libraries. The approach was applied to the cultivated Citrus gene pool resulting from reticulate evolution involving four ancestral taxa, C. maxima, C. medica, C. micrantha and C. reticulata.
• Methods A genotyping by sequencing library was established with the restriction enzyme ApeKI applying one base (A) selection. Diagnostic single nucleotide polymorphisms (DSNPs) for the four ancestral taxa were mined in 29 representative varieties. A generic pipeline based on a maximum likelihood analysis of the number of read data was established to infer ancestral contributions along the genome of diploid, triploid and tetraploid individuals. The pipeline was applied to 48 diploid, four triploid and one tetraploid citrus accessions.
• Key Results Among 43 598 mined SNPs, we identified a set of 15 946 DSNPs covering the whole genome with a distribution similar to that of gene sequences. The set efficiently inferred the phylogenomic karyotype of the 53 analysed accessions, providing patterns for common accessions very close to that previously established using WGS data. The complex phylogenomic karyotypes of 21 cultivated citrus, including bergamot, triploid and tetraploid limes, were revealed for the first time.
• Conclusions The pipeline, available online, efficiently inferred the phylogenomic structures of diploid, triploid and tetraploid citrus. It will be useful for any species whose reproductive behaviour resulted in an interspecific mosaic of large genomic fragments. It can also be used for the first generations of interspecific breeding schemes. Key words: Citrus, reticulate evolution, mosaic genome, GBS, polyploids, SNPs, phylogenomic karyotype.
INTRODUCTION
Reticulate evolution is recognized as a major evolutionary process of eukaryotes and as a source of genetic diversity (Arnold, 2006). Interspecific and introgressive hybridization, recombination between genes, horizontal gene transfer and infectious heredity are the main mechanisms involved (Posada and Crandall, 2001; Linder and Rieseberg, 2004; Makarenkov and Legendre, 2004). Hybridization of genetically distinguish-able populations, groups or taxa, leading to the production of viable hybrids (Barton and Hewitt, 1985; Mallet, 2005), has long been known to be involved in the emergence of plant species (Stebbins, 1950, 1959; Rieseberg, 1997; Abbott et al., 2010, 2013). Hybridization between species or subspecies has a significant weight in evolving processes including spe-ciation, adaptation and extinction (Dowling and Secor, 1997;
Barton, 2001; Yakimowski and Rieseberg, 2014). It can lead to rapid genomic changes (Baack and Rieseberg, 2007) and is
an important source of genetic variability. Stebbins (1959) sug-gested that a high degree of genetic variability was required for major evolutionary advances; hence interspecific hybridiza-tion appears to be a predominant evoluhybridiza-tionary force in plants. The evolutionary history of the concerned species cannot be correctly described using phylogenetic trees, but rather appears as a network (Stebbins, 1950; Grant, 1981; Arnold, 1997;
Doolittle, 1999; Otto and Whitton, 2000) or a ‘Web of life’ (Arnold and Fogarty, 2009), generating phylogenetic discord-ance between nuclear and cytoplasmic (mitochondrial and chlo-roplast) genomes, and between different regions of the same nuclear genome (Pamilo and Nei, 1988; Rieseberg and Soltis, 1991; Linder and Rieseberg, 2004; Beiko and Hamilton, 2006). Reticulations lead not only to faulty phylogenetic conclusions, but also to interspecific heterozygosity of large portions of the genome when vegetative propagation involving apomixes, bulbs, tubers, corms, suckers, etc. takes place immediately or
a few generations after reticulation events as described in fern (Dyer et al., 2012), banana (Perrier et al., 2009, 2011) or citrus (Curk et al., 2014). Deciphering this type of complex genome needs appropriate analytical approaches and tools based on a whole-genome scan.
The emergence of NGS (next-generation sequencing) tech-nologies has considerably changed ways of analysing plant evolution, moving from phylogenetics to phylogenomics. The analysis of whole-genome variability has become possible and has already provided new information on the history of domestication of some cereals (Mascher et al., 2016; Meyer et al., 2016; Ramos-Madrigal et al., 2016; Pankin et al., 2018) and fruit crops, including grapes (Zhou et al., 2017), apples (Duan et al., 2017) and citrus (Wu et al., 2014, 2018). However, whole-genome re-sequencing (WGS) remains costly for stud-ies of large populations. Therefore, cost-effective methods combining NGS and a reduction of the complexity of genomes have been developed, such as genotyping by sequencing (GBS) (Elshire et al., 2011), restriction site-associated DNA sequenc-ing (RADseq) (Miller et al., 2007; Baird et al., 2008; Davey and Blaxter, 2011; Peterson et al., 2012) and sequenced-based genotyping (SBG) (Truong et al., 2012). These methods allow sufficient coverage of the genomes and are robust means for sampling whole genomes. They enable the analysis of large segregating progenies and marker trait association studies based on linkage disequilibrium and even genomic selection (Baxter et al., 2011; Ma et al., 2012; Poland et al., 2012; Ward et al., 2013; Wang et al., 2016; Curtolo et al., 2017). The effi-ciency of these methods has been demonstrated not only by constructing genetic maps and conducting genetic associa-tions studies, but also by carrying out diversity analyses and revealing phylogenetically informative variation (Garcia et al., 2013; Escudero et al., 2014; Penjor et al., 2014, 2016; Hamon et al., 2017; Oueslati et al., 2017; Stetter and Schmid, 2017). More specifically, GBS has been used to perform genetic stud-ies of numerous diploid and polyploid specstud-ies, including maize (Crossa et al., 2013), wheat (Poland et al., 2012; Heslot et al., 2013), barley (Poland et al., 2012; Liu et al., 2014), rice (Huang et al., 2009; Courtois et al., 2013; Spindel et al., 2013), ryegrass (Byrne et al., 2013), soybean (Sonah et al., 2013), chickpea (Verma et al., 2015), sugarcane (Almeida Balsalobre et al., 2017), banana (Martin et al., 2016) and citrus (Oueslati et al., 2017). However, for polyploid species, due to the generally low read depths at individual single nucleotide polymorphism (SNP) loci, genotyping has been limited to the identification of homozygous genotypes (nulliplex or quadriplex for a tetra-ploid) or heterozygous genotypes, joining the different classes of heterozygosity (simplex, duplex, triplex for a tetraploid) in the same genotyping class (Clevenger et al., 2015; Rocher et al., 2015; Almeida Balsalobre et al., 2017; Yang et al., 2017). For tetraploid potatoes, a technical solution has been proposed to improve the individual SNP read depths by combining GBS with enriched cultivar-specific DNA sequencing libraries using an in-solution hybridization method (SureSelect), reducing the genome to 807 target genes distributed across the genomes (Uitdewilligen et al., 2013). New analytical methods have also been proposed to deal with the low read depths. Rather than calling genotypes, Ashraf et al. (2014) and Sverrisdóttir et al. (2017) directly used the variant allele frequencies at each data
point for association studies and genomic selection from GBS data. New pipelines have also been proposed to estimate allele doses at an individual locus (McKinney et al., 2018; Bastien et al., 2018), but it remains challenging.
The Citrus genus is a good example of a gene pool resulting from reticulate evolution, where apomixes and vegetative propa-gation have fixed ancient reticulation events and limited further interspecific recombination, resulting in mosaics of large genome fragments from different species (Nicolosi et al., 2000; Wu et al., 2014, 2018; Curk et al., 2016). Molecular marker analyses ena-bled the main lines of the phylogeny of the different cultivated species of Citrus to be drawn and the identification of the vari-ous domestication events (Federici et al., 1998; Nicolosi et al., 2000; Barkley et al., 2006; Li et al., 2010; Garcia-Lor et al., 2012, 2013; Ollitrault et al., 2012a, b; Ramadugu et al., 2013;
Curk et al., 2016). Four taxa [C. medica L. (citron), C. reticulata Blanco (mandarin), C. maxima (Burm.) Merr. (pummelo) and
C. micrantha Wester (papeda)] have been identified as being the ancestors of most of the cultivated citrus (Nicolosi et al., 2000;
Garcia-Lor et al., 2012; Ollitrault et al., 2012b; Ramadugu et al., 2013; Curk et al., 2014, 2015; Wu et al., 2018). These four ances-tral taxa, which are still sexually compatible, were differentiated by foundation effects and allopatric evolution in four South-east Asian geographic regions ranging from the southern Himalayas to Indonesia. Pummelos originated in the Malay Archipelago and Indonesia. Citrons evolved in north-eastern India and in the nearby areas of Myanmar and China. Mandarins were diversi-fied over a wide region which includes Vietnam, southern China and Japan, while C. micrantha is endemic to the Philippine islands (Wester, 1915; Tanaka, 1954; Webber et al., 1967; Scora, 1975). Secondary species [C. sinensis (L.) Osb. (sweet orange),
C. aurantium L. (sour orange), C. paradisi Macf. (grapefruit),
C. limon (L.) Burm. (lemon) and C. aurantiifolia (Christm.) Swing. (lime)] and modern cultivars are the result of hybridiza-tions between the four basic taxa (Nicolosi et al., 2000; Garcia-Lor et al., 2013; Curk et al., 2016) engendering the wide genetic and phenotypic diversity observed among them. In terms of morphological characteristics (Ollitrault et al., 2003), carotenoid compositions (Fanciullino et al., 2006) and the distribution of coumarins and furanocoumarins (Dugrand-Judek et al., 2015), the structure of phenotypic variability is closely linked with the reticulate evolution of the gene pool. Therefore, in parallel with the search for the origin of cultivated forms and the optimization of genetic resources management, deciphering the phylogenomic structures of modern cultivars will open the way for association studies based on ancestral haplotypes and phylogenomic-based reconstruction breeding strategies (Rouiss et al., 2018). The accurate study of citrus interspecific mosaic genomes started with the release of the first high-quality citrus reference hap-loid genome by the International Citrus Genomics Consortium (ICGC; Wu et al., 2014). WGS data revealed Citrus maxima introgressions in traditional mandarin genomes (Wu et al., 2014) and the interspecific mosaic structure of sweet orange (Xu et al., 2013; Wu et al., 2014), sour orange and clementine (Wu et al., 2014). More recently, WGS data (Wu et al., 2018), including the four Citrus ancestral species and modern varieties, revealed the mosaic genome structures of the other most important horticul-tural groups, such as grapefruit, lemon and lime, and confirmed
C. maxima introgressions in all domesticated mandarins.
A GBS approach was recently applied to analyse the inter-specific admixture of diploid secondary species and modern varieties resulting from two Citrus gene pools, C. reticulata and C. maxima (Oueslati et al., 2017). To date, the phylog-enomic structures of the citrus polyploid germplasm remain unpublished.
The objectives of the present work were to (1) develop a GBS approach in Citrus with a dense genotyping and a good depth, to decipher – at limited cost – the phylogenomic structures of large diploid and polyploid populations originating from a lim-ited number of interspecific recombinations between
C. reticu-lata, C. maxima, C. medica and C. micrantha gene pools; (2) provide a reference matrix of diagnostic SNP (DSNP) mark-ers for the four Citrus ancestral taxa; (3) implement a generic workflow for mosaic genome analysis from GBS data of dip-loid and polypdip-loid populations resulting from reticulate evo-lution; and (4) analyse the phylogenomic structure of modern varieties of the main citrus diploid and polyploid horticultural groups. As proof of concept, 53 citrus accessions, including several varieties already analysed using WGS (Wu et al., 2014,
2018), were sequenced in a single Illumina Hiseq 2000 line, using the restriction enzyme ApeKI and a selective PCR for GBS library preparation. Close to 16 000 DSNPs were identi-fied and successfully used to decipher the complex genomes of the 53 accessions, using a workflow based on maximum likelihood analysis of multilocus ancestral read numbers. The GBS approach we developed combined with the reference DSNP matrix will be useful for any study of germplasm and hybrids resulting from breeding within the Citrus genus. The implemented workflow for the analysis of mosaic genomes is available online and will be useful for species with any number of identified ancestral taxa, for diploid, triploid and tetraploid accessions.
MATERIALS AND METHODS
Plant material
The study covered 53 accessions from the collection of the Inra-Cirad Citrus Biological Resource Center in San-Giuliano, Corsica, France (Luro et al., 2018). The varieties belong to the Citrus genus, and 29 of them are representative of the four ancestral taxa: 15 mandarins, six pummelos, six citrons and two papedas. They were used to identify diagnostic markers of the basic taxa. The other varieties, which are diploid, trip-loid and tetraptrip-loid, came from admixtures of the four ances-tral taxa: two sour oranges (C. aurantium), two sweet oranges (C. sinensis), five lemons (C. limon, C. limonia Osb., C. meyeri Y. Tan. and C. jambhiri Lush.), eight limes (C. aurantiifolia,
C. latifolia Tan., C. excelsa Wester, C. limettioïdes Tan.), one ‘Alemow’ (C. macrophylla Wester), three grapefruits
(C. para-disi), one bergamot (C. bergamia Risso & Poit.), one clemen-tine (C. clementina Hort. ex Tan.) and one limonette (C. limetta Risso). In order to validate our method of deciphering the citrus interspecific mosaic structure, we included some acces-sions already described from WGS data by Wu et al. (2014,
2018). A summary list of the varieties analysed with their clas-sification in two widely used taxonomic systems [the Tanaka (1954) and Swingle and Reece (1967) systems] is available in
Supplementary Data Table S1. Recent genetic and genomic studies demonstrated the limits of both systems resulting from reticulate evolution of the citrus gene pool and vegetative prop-agation of interspecific combination by apomictic seeds (Curk et al., 2016; Wu et al., 2018). Herein we refer to the Tanaka system for the secondary species (the types issued from inter-specific combinations); indeed, although they cannot be consid-ered as true species, the Tanaka classification has the advantage of distinguishing secondary taxa that have arisen from different reticulation events. Supplementary Data Table S1 also speci-fies whether the phylogenomic structure of each accession has already been analysed from WGS (Wu et al., 2014, 2018) or GBS (Oueslati et al., 2017) or was analysed for the first time in the present study.
GBS analysis
Library preparation and sequencing. Following the protocol of Oueslati et al. (2017), genomic DNA was isolated using the Plant DNAeasy® kit (Qiagen), according to the
manufac-turer’s instructions. Several in silico tests were carried out using numerous types of restriction enzymes and selective primers. The method selected consists of using the restriction enzyme
ApeKI and adding a selective base (A) during the PCR step of GBS library preparation as it was found to provide a good combination of tag density and read numbers per tag. ApeKI also has the advantage of cutting DNA preferentially in gene sequences enabling better quality genotype calling (Oueslati et al., 2017). The genomic DNA concentration was adjusted to 20 ng μL–1, and ApeKI GBS libraries were prepared
follow-ing the protocol described by Eslhire et al. (2011). DNA of each sample (200 ng) was digested with ApeKI (New England Biolabs, Hitchin, UK). Digestion took place at 75 °C for 2 h and then at 65 °C for 20 min to inactivate the enzyme. The liga-tion reacliga-tion was completed in the same plate as the digesliga-tion, again using T4 DNA ligase (New England Biolabs) at 22 °C for 1 h, and the ligase was inactivated prior to pooling the samples by holding it at 65 °C for 20 min. Ligated samples were pooled and PCR-amplified in a single tube. Complexity was further reduced using PCR primers with one selective base (A) as per-formed by Sonah et al. (2013). Single-end sequencing was per-formed on a single lane of an Illumina HiSeq2000. The Illumina Hiseq 2000 sequencing raw data are available in the NCBI SRA (Sequence Read Archive), under the accession numbers SRP109295 for the 21 mandarin, pummelo, orange, grapefruit and clementine sequences already published in Oueslati et al. (2017; Supplementary Data Table S1) and PRJNA388540 for the 32 new citrus accessions. Keygene N.V. owns patents and patent applications protecting its Sequence Based Genotyping technologies.
SNP genotype calling for diploid germplasm
The Tassel 4.0 pipeline (Glaubitz et al., 2014) was used to call SNPs from the DNA sequence reads from the Illumina raw data (unfiltered fastq file). The Tassel 4.0 GBS pipeline identified good quality, unique, sequence reads with barcodes.
These sequence tags were aligned to the C. clementina 1.0 reference genome (https://phytozome.jgi.doe.gov/pz/portal. html#!info?alias=Org_Cclementina) using Bowtie2 v2.2.6 (Langmead and Salzberg, 2012). For genotype calling, five reads were considered as a minimum below which they were considered as missing data (Danecek et al., 2011). We finally only considered diallelic polymorphic positions with <30 % of missing data for the 29 representatives of C. reticulata,
C. max-ima, C. medica and C. micrantha, and a minor allele frequency (MAF) >0.05.
Genetic parameters
The following parameters were used to describe the genetic diversity within and between the ancestral taxa: Ho, the observed heterozygosity; He, the expected proportion of heterozygous loci per individual under Hardy–Weinberg equilibrium defined as He = 1 − Σpi2, with pi the frequency of a given allele in the
sub-population concerned or in the whole population; and Fw, the fixation index (Wright, 1951) defined as follows:
FW=1 − HHo e.
They were calculated using GENETIX v. 4.03 software (Belkhir et al., 1996–2004) based on the 43 598 diallelic selected markers.
The analysis consisting of identifying the diagnostic mark-ers of the four basic taxa was mainly based on GST parameter estimations (Nei, 1973). GST is the coefficient of gene differen-tiation which measures differendifferen-tiation among sub-populations. It is equivalent to Wright’s FST for two alleles and ranges from zero to one. The higher the value, the more differentiated the taxa. GST is defined as the ratio of inter-population diversity to total diversity: GST = HeTotH− Hs eTot = HeTot− H e n HeTot .
where HeTot is the total genetic diversity of the whole popula-tion, Hs the average diversity within sub-populations and n is the number of sub-populations. In our study, we had four sub-populations comprising representative varieties of the four ancestral taxa.
He is the expected proportion of heterozygous loci per indi-vidual under Hardy–Weinberg equilibrium (He = 1 − Σpi2, with
pi the frequency of a given allele in the sub-population con-cerned or in the whole population HeTot).
The search for diagnostic SNPs for each taxon was based on
GST parameter estimations for the taxa concerned considering two sub-populations: (1) the taxon concerned (Ti) and (2) a the-oretical population of the three other basic taxa (T–i). Analyses were performed from the estimated allele frequency of each taxon considering the same population size for each taxon to estimate the frequency of the two sub-populations (Ti and T–i) and the frequency of the whole population (Tot):
GST Taxoni= HeTot−
HeTi+HeT−i
2
HeTot
.
Allele frequencies and GST estimation were computed in Excel from the genotyping matrix.
Analysis of population organization
We analysed the organization of genetic diversity of the 48 diploid varieties used in the study. A principal component analysis (PCA) was performed on them based on the 43 598 selected diallelic markers using the {ade4} (Chessel et al., 2004) R package.
Hierarchical ascending clustering was carried out for the rep-resentative accessions of the four ancestral taxa from the same matrix of diallelic markers. We produced a dissimilarity matrix by calculating the Euclidean distances between each pair of markers and hierarchical clustering using Ward’s method applied to the square of distances. Data were computed using the {stats} (R Core Team, 2017) R package, and the result was visualized using the {dendextend} (Galili, 2015) R package.
Identification of interspecific introgressions in representative varieties of the ancestral taxa and selection of DSNPs of the ancestral taxa
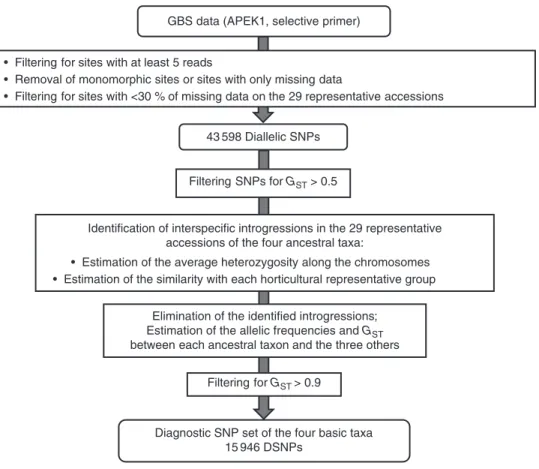
The identification of diagnostic markers of the four ancestral taxa from the GBS data is schematized in the workflow in Fig. 1. Some of the accessions cited above, mostly in the mandarin group, are already known to be non-pure (Curk et al., 2014;
Wu et al., 2014, 2018). They were the result of a domestication process of the real ancestors which led to interspecific intro-gressions. Consequently, implementing a diagnostic marker set required the identification of interspecific introgressions among the varieties considered as representatives of the ancestral taxa, and of removing these regions of the variety under consider-ation from the analysis. This process provided a better estima-tion of the allelic frequencies of the ancestral taxa and hence of the GST parameter in the four basic taxa. The identification of the interspecific introgressed areas was based on the pattern of two parameters along the genome using consecutive non-sliding 20 SNP windows: (1) the average heterozygosity esti-mated from the matrix of SNP positions and (2) the similarity of the accession to the centroid of each of the four horticultural representative groups (the allelic frequencies of the centroid being the average frequency of the varieties of the considered group). It was expected that introgressed areas would display significant discontinuity of these patterns according to the level of differentiation between the two taxa involved. Indeed, het-erozygous introgressions resulted in regions with an increase in heterozygosity and a decrease in the similarity, while homozy-gous introgressions resulted in a deep variation in the similarity patterns. To better visualize the pattern discontinuities, SNPs that were informative for the differentiation of one out of the four horticultural groups, representative of the ancestral taxon (GST >0.5), were filtered out. Once the interspecific introgres-sions were removed (considered as missing data), the allelic frequencies in the four ancestral taxa and the GST parameter be-tween each ancestral taxon and the three others were estimated again. We then considered SNPs with a GST value (the taxon
concerned relative to a sub-population of the three other ances-tral taxa) >0.9 as diagnostic markers of a given taxon.
Analysis of the interspecific mosaic structure of complex genomes
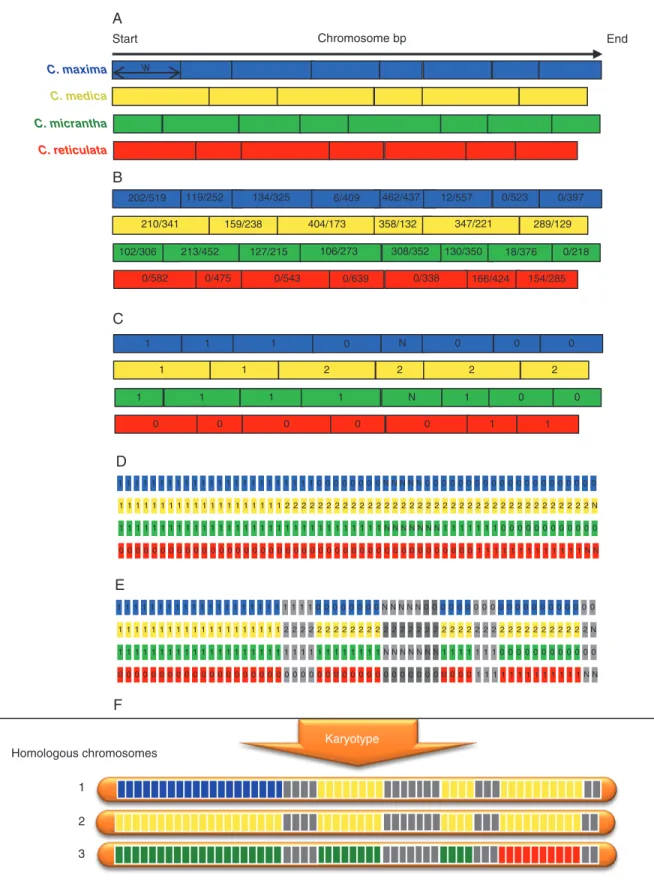
The objective was to develop a generic pipeline to deci-pher complex genomes resulting from reticulate evolution at diploid and polyploid levels, based on the availability of a set of diagnostic markers of the ancestral taxa involved (all along the genome) and GBS data of new populations obtained with the same experimental procedure as the reference DSNP set. According to our experimental data (see below) and reports in the literature (Bastien et al., 2018; McKinney et al., 2018), it is often difficult to estimate allelic doses at a single locus accurately in heterozygous polyploids from relative allele read frequencies resulting from GBS experiments. We developed an approach based on maximum likelihood analysis applied to multilocus numbers of reads of consecutive DSNPs of the same ancestor, that can be used for diploid, triploid and tetraploid plants. This approach is described below in the concrete case of citrus with four ancestral taxa, but the tool we developed can be used with models of any number of ancestral taxa. An illustra-tion of the process for a triploid plant is provided in Fig. 2.
The first step aims to estimate the doses of the ancestral genome fragment along the genome. For each ancestral taxon, the citrus genome was segmented in windows of w consecutive DSNPs (Fig. 2A) and the doses of the ancestral taxon consid-ered were estimated for each window by maximum likelihood
analysis (Fig. 2C). The detail for the maximum likelihood anal-ysis for diploid, triploid and tetraploid individuals is provided in Supplementary Data Text S1.
During the preceding step, the number and position of win-dows varied between the ancestral taxa according to the density and positions of the DSNPs. Therefore, the next step was to integrate the information obtained for the different ancestral taxa doses along the genome.
The genome was physically sub-divided into successive frag-ments of z kb (by default z = 100) (Fig. 2D). For each ancestor and for each genomic fragment, the corresponding window of
w DSNPs was identified and the ancestral dose of this window was attributed to the genomic fragment. A non-phased repre-sentation of karyotypes with two, three and four chromosomes for diploid, triploid and tetraploid plants, respectively, was then generated from the ancestral doses of each genome fragment (Fig. 2F). For a given genome fragment, if the sum of the allelic doses of the different ancestors differed from the ploidy level of the plant concerned, the phylogenomic origin of the fragment was considered as undefined. Likewise, if one of the doses of the different ancestors was undefined, the phylogenomic origin of the fragment was considered as undefined (Fig. 2E). When phased haplotypes were known for the parental genomes, we proposed manually phased karyotypes for the concerned acces-sion, assuming the lower number of recombination events as the best model.
The tool we developed (TraceAncestor) allows the user to define the number of DSNPs per window (by default: w = 10), the sequencing error rate (by default: e = 0.01) and the threshold for
GBS data (APEK1, selective primer)
• Filtering for sites with at least 5 reads
• Removal of monomorphic sites or sites with only missing data
• Filtering for sites with <30 % of missing data on the 29 representative accessions
Diagnostic SNP set of the four basic taxa 15 946 DSNPs
43 598 Diallelic SNPs
Identification of interspecific introgressions in the 29 representative accessions of the four ancestral taxa:
• Estimation of the average heterozygosity along the chromosomes • Estimation of the similarity with each horticultural representative group
Filtering SNPs for GST > 0.5
Elimination of the identified introgressions; Estimation of the allelic frequencies and GST
between each ancestral taxon and the three others
Filtering for GST > 0.9
Fig. 1. Workflow for the identification of diagnostic markers of the four ancestral taxa (C. maxima, C. reticulata, C. medica and C. micrantha) from GBS reads.
Chromosome bp 1 1 1 1 1 2 2 2 2 1 0 N 0 0 0 1 1 1 N 1 0 0 0 0 0 0 0 1 1 1 1 1 1 1 1 1 1 1 1 1 1 1 1 1 1 1 1 1 1 1 1 1 1 0 0 0 0 0 0 0 0 N N N N N 0 0 0 0 0 0 0 0 0 0 0 0 0 0 0 0 0 0 0 0 0 1 1 1 1 1 1 1 1 1 1 1 1 1 1 1 1 1 1 1 1 2 2 2 2 2 2 2 2 2 2 2 2 2 2 2 2 2 2 2 2 2 2 2 2 2 2 2 2 2 2 2 2 2 2 2 2 2 N 1 1 1 1 1 1 1 1 1 1 1 1 1 1 1 1 1 1 1 1 1 1 1 1 1 1 1 1 1 1 1 1 N N N N N N N 1 1 1 1 1 1 1 0 0 0 0 0 0 0 0 0 0 0 0 1 1 1 1 1 1 1 1 1 1 1 1 1 N N 0 0 0 0 0 0 0 0 0 0 00 0 0 0 0 0 0 0 0 0 0 0 00 0 0 0 0 0 0 0 0 0 0 0 0 0 0 0 0 0 0 1 1 1 1 1 1 1 1 1 1 1 1 1 1 1 1 1 1 1 1 1 1 1 1 0 0 0 0 0 0 0 0 N N N N N 0 0 0 0 0 0 0 0 0 0 0 0 0 0 0 0 0 0 0 0 0 1 1 1 1 1 1 1 1 1 1 1 1 1 1 1 1 1 1 1 1 2 2 2 2 2 2 2 2 2 2 2 2 2 2 2 2 2 2 2 2 2 2 2 2 2 2 2 2 2 2 2 2 2 2 2 2 2 N 1 1 1 1 1 1 1 1 1 1 1 1 1 1 1 1 1 1 1 1 1 1 1 1 1 1 1 1 1 1 1 1 N N N N N N N 1 1 1 1 1 1 1 0 0 0 0 0 0 0 0 0 0 0 0 1 1 1 1 1 1 1 1 1 1 1 1 1 N N 0 0 0 0 0 0 0 0 0 0 00 0 0 0 0 0 0 0 0 0 0 0 00 0 0 0 0 0 0 0 0 0 0 0 0 0 0 0 0 0 0 Karyotype Homologous chromosomes 1 2 3 Start End w C. maxima C. medica C. micrantha C. reticulata 119/252 202/519 134/325 6/409 462/437 12/557 0/523 0/397 289/129 347/221 358/132 404/173 159/238 210/341 102/306 213/452 127/215 106/273 308/352 130/350 18/376 0/218 154/285 166/424 0/338 0/639 0/543 0/475 0/582 A B C D E F
Fig. 2. Example of local ancestor allele dose estimation for a triploid accession. (A) Definition of non-overlapping windows of ten DNSPs for each ancestral taxon: w, window of ten DSNPs. (B) Number of reads of the considered ancestor allele/number of reads of the alternative allele. (C) Estimation of allelic dosage of each ancestor per window of ten DSNPs [each pair of dose hypotheses are compared by maximum likelihood (LOD) test; if, for a pair including the more prob-able hypothesis, –3 < LOD < 3 → indeterminacy]. (D) Division of the chromosome into non-overlapping windows of 100 kb; the allelic dosage of this window is deduced from that of the ten DSNPs window that include the 100 kb window. (E) If the sum of allelic dosage of the four classes of DSNPs is different from the expected ploidy (here 3) → indeterminacy (grey). (F) Unphased karyotype automatic drawings. Blue, C. maxima; yellow, C. medica; green, C. micrantha; red,
C. reticulata; grey, indeterminacy.
LOD values of the maximum likelihood test (by default: t = 3; the probability of the best hypothesis is >1000 times greater than the other one). There is no limit to the number of ancestral taxa considered (which is automatically defined by the reference matrix of DSNPs). This pipeline is available as a Galaxy work-flow at http://galaxy.southgreen.fr/galaxy/ and for download at
https://github.com/SouthGreenPlatform/galaxy-wrappers/tree/ master/Galaxy_SouthGreen/traceancestor.
RESULTS
Genotype calling and varietal diversity
Figure 1 shows the workflow for the identification of diag-nostic markers. The 53 varieties considered were part of two 55 plex libraries sequenced in two lanes of a Hiseq 2000 according to the Cornell GBS methodology (Elshire et al., 2011) using ApeKI as the restriction enzyme and a selective primer. A total of 344.8 million reads were obtained. The Tassel pipeline was used for genotype calling, and 314.2 mil-lion of these reads were validated (bar code, restriction site plus insert), and 290.7 million were mapped on the clemen-tine reference genome (Wu et al., 2014). The average number of reads per variety was 2.2 million, ranging from 609 890 for ‘Meyer’ lemon to 5.68 million for ‘Shekwasha’ mandarin (Supplementary Data Fig. S1). A total of 2.045 million tags (unique sequence with at least five reads) were identified, of which half were only mapped once on the clementine refer-ence genome. Genotype calling from the tags with a single hit map was undertaken considering a position with less than five reads as missing data. A total of 43 598 diallelic SNPs were selected, and filtered for sites with <30 % of missing data on the 29 representative accessions. The 35 and 84 % of the SNPs retained had, respectively, <5 % and <25 % of missing data (Supplementary Data Fig. S2A). At the individual level, 29.6 and 90.7 % of the varieties had, respectively, <5 % and <25 % of missing data (Supplementary Data Fig. S2B). ‘Meyer’ lemon had the highest rate of missing data: 35 %. The distri-bution of the read numbers per marker (Supplementary Data Fig. S3) appeared to be globally homogeneous among the nine chromosomes, with a mean value of 1024 reads. However, a decrease in the number of reads was observed in the middle of chromosomes 2, 4, 5, 8 and 9.
The distribution of the 43 598 mined polymorphisms on the nine chromosomes is reported in Table 1. The number of dial-lelic SNPs varied between 3611 SNPs on chromosome 8 and 7743 SNPs on chromosome 3. Little variation was observed among the expected heterozygosity values along the nine chromosomes, with an average of 0.309, or in the observed heterozygosity values which ranged between 0.197 (chromo-some 2) and 0.227 (chromo(chromo-some 6), with an average of 0.213. According to the Hardy–Weinberg equilibrium, the analysed population displayed a heterozygote deficiency with the Fw parameter equal to 0.282.
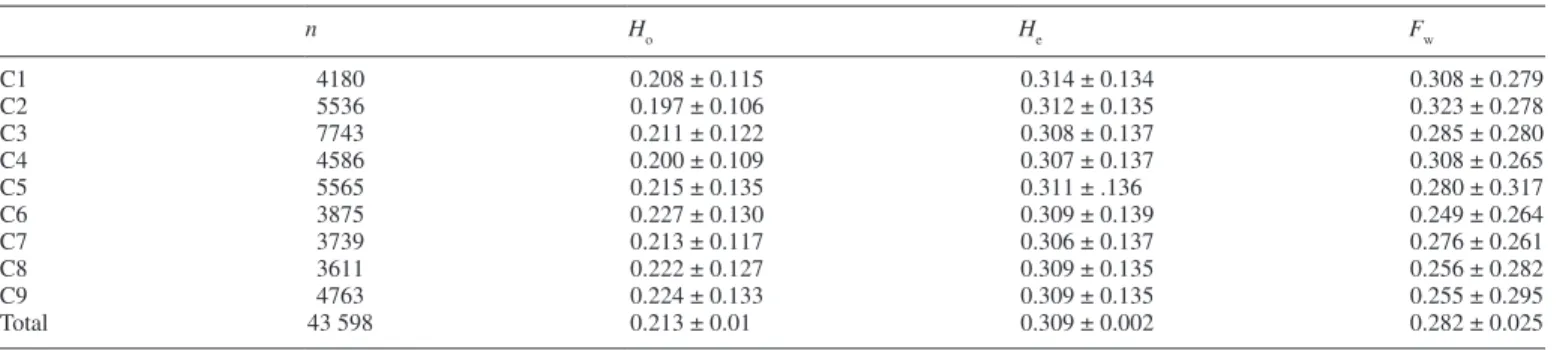
Based on the 43 598 diallelic SNPs, we performed a three-dimensional representation of the PCA to examine the genetic diversity of the 48 diploid citrus accessions (Fig. 3). The four main observed clusters corresponded to the four ancestral taxa (pummelos, mandarins, citrons and papedas). The first three axes represent 61.54 % of total diversity and clearly separate the four clusters of the ancestral taxa. Other clusters made of secondary species appeared between the ancestral clusters and revealed their genetic relationship. Lemons [‘Lisbon’ lemon (33), ‘Meyer’ lemon (34), ‘Eureka’ lemon (35), ‘Rough’ lemon (47) and ‘Volkamer’ lemon (48)], ‘Palestine’ sweet lime (38), ‘Marrakech’ limonette (39) and ‘Rangpur’ lime (46) were in an intermediate position between C. reticulata and C. medica clus-ters. Bergamot (30) was located close to the mandarin group but still in an intermediate position between the mandarin, pum-melo and citron groups. Grapefruits [‘Duncan’ (43), ‘Marsh’ (44) and ‘Star Ruby’ (45)], sour oranges [‘Seville’ (31) and ‘Bouquetier de Nice’ (32)] and sweet oranges [‘Valencia late’ (41) and ‘Washington navel’ (42)], rather logically given their origin revealed by markers (Curk et al., 2015), previous GBS studies (Oueslati et al., 2017) and WGS analysis (Wu et al., 2014, 2018), were in an intermediate position between
C. retic-ulata and C. maxima. ‘Nestour’ lime (36) and ‘Alemow’ (40) were located between C. medica and C. micrantha, in agree-ment with their origin proposed by Curk et al. (2016).
Diversity among the four ancestral taxa and search for diagnostic markers
Genetic parameters. Analyses of the diversity among the
29 representative accessions (Table 2) revealed a marked
Table 1. Polymorphisms mined from GBS data on 53 citrus varieties along the nine chromosome
n Ho He Fw C1 4180 0.208 ± 0.115 0.314 ± 0.134 0.308 ± 0.279 C2 5536 0.197 ± 0.106 0.312 ± 0.135 0.323 ± 0.278 C3 7743 0.211 ± 0.122 0.308 ± 0.137 0.285 ± 0.280 C4 4586 0.200 ± 0.109 0.307 ± 0.137 0.308 ± 0.265 C5 5565 0.215 ± 0.135 0.311 ± .136 0.280 ± 0.317 C6 3875 0.227 ± 0.130 0.309 ± 0.139 0.249 ± 0.264 C7 3739 0.213 ± 0.117 0.306 ± 0.137 0.276 ± 0.261 C8 3611 0.222 ± 0.127 0.309 ± 0.135 0.256 ± 0.282 C9 4763 0.224 ± 0.133 0.309 ± 0.135 0.255 ± 0.295 Total 43 598 0.213 ± 0.01 0.309 ± 0.002 0.282 ± 0.025
n, number of polymorphisms; Ho, observed heterozygosity; He, expected heterozygosity; Fw, Wright fixation index; C1–C9. the nine chromosomes of the refer-ence clementine genome (Wu et al., 2014).
Papedas 28 29 36 40 23 22 24 25 26 27 Citrons 16 17 19 21 18 20 44 Pummelos Mandarins 1 2 4 5 6 7 8 9 10 11 12 13 14 15 37 30 31 32 33 34 35 38 39 41 42 43 45 47 48 46 3 PC 3 (14.56 %) 300 200 100 100 200 –100 100 –100 –200 –300 –400 0 0 –100–200 0 PC 1 (29.12 %) PC 2 (17.86 %) Axis 1 Axis 3 Axis 2
Fig. 3. Principal component analysis (PCA) calculated from genotype data of the 48 diploid accessions corresponding to the 43 598 diallelic SNPs. 1, ‘Shekwasha’ mandarin; 2, ‘de Chios’ mandarin; 3, ‘Owari Satsuma’ mandarin; 4, ‘Nan feng mi chu’ mandarin; 5, ‘San Hu Hong Chu’ mandarin; 6, ‘Se Hui Gan’ mandarin; 7, ‘Szibat’ mandarin; 8, ‘Cleopatra’ mandarin; 9, ‘Dancy’ mandarin; 10, ‘Fuzhu’ mandarin; 11, ‘King’ mandarin; 12, ‘Ladu’ mandarin; 13, ‘Ponkan’ mandarin; 14, ‘Sunki’ mandarin; 15, ‘Willowleaf’ mandarin; 16, ‘Chandler’ pummelo; 17, ‘Timor’ pummelo; 18, ‘Deep red’ pummelo; 19, ‘Kao Pan’ pummelo; 20, ‘Pink’ pummelo; 21, ‘Tahitian’ pummelo; 22, ‘Corsican’ citron; 23, ‘Buddha’s Hand’ citron; 24, ‘Etrog’ citron; 25, ‘Humpang’ citron; 26, ‘Mac Veu de Montagne’ citron; 27, ‘Poncire commun’ citron; 28, ‘Small flower’ papeda 1; 29, ‘Small flower’ papeda 2; 30, Bergamot; 31, ‘Seville’ sour orange; 32, ‘Bouquetier de Nice’ sour orange; 33, ‘Lisbon’ lemon; 34, ‘Meyer’ lemon; 35, ‘Eureka’ lemon; 36, ‘Nestour’ lime; 37, ‘Nules’ clementine; 38, ‘Palestine’ sweet lime; 39, ‘Marrakech’ limonette; 40, ‘Alemow’; 41, ‘Valencia late’ sweet orange; 42, ‘Washington navel’ sweet orange; 43, ‘Duncan’ grapefruit; 44, ‘Marsh’ grapefruit; 45, ‘Star Ruby’
grapefruit; 46, ‘Rangpur’ lime; 47, ‘Rough’ lemon; 48, ‘Volkamer’ lemon.
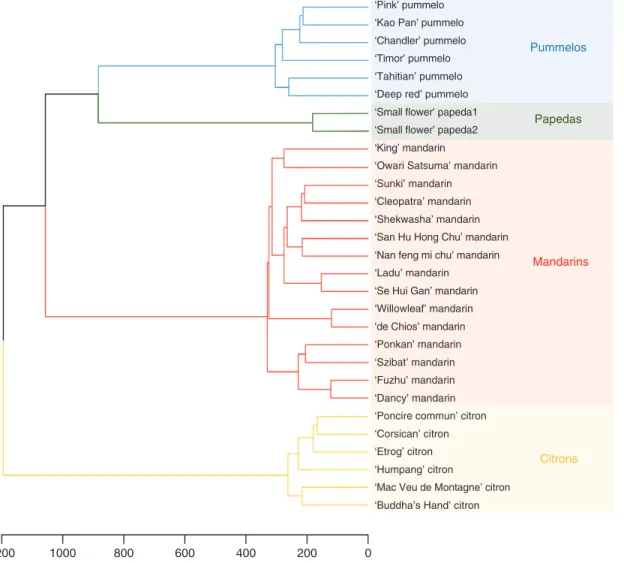
difference in the number of polymorphic positions within each horticultural group: 18 567, 7325, 7156 and 2285 for mandarins, pummelos, citrons and papedas, respectively. The expected heterozygosity values (0.11, 0.07, 0.04 and 0.03 for mandarins, pummelos, citrons and papedas, respectively) ranked in the same order as the number of polymorphic loci. Thus, the mandarin set is the most polymorphic of the four representative sets. Conversely, papedas present the low-est intraspecific diversity, probably due to the fact that they are represented by only two accessions. The deficit of het-erozygosity in citrons revealed by the positive Fw value can be explained by the cleistogamy of this group, while negative value observed in pummelos and mandarins could be related, respectively, to self-incompatibility and heterozygosity fixa-tion by apomixes. The average values of the differentiafixa-tion index (Fw = –0.12 and GST = 0.78) between the four represent-ative sets revealed, as expected, marked genetic differentia-tion among the four populadifferentia-tions. Hierarchical cluster analysis (Fig. 4), computed from the 43 598 diallelic SNPs, confirmed strong clustering of the four ancestral taxa and revealed greater differentiation between citrons and the other groups, and a closer relationship between pummelos and papedas.
Search for ancestral taxa diagnostic markers (DSNPs).
Removing the interspecific introgressed areas from the varieties representative of the four ancestral taxa was an important step to estimate effectively the allelic frequencies of the ancestral taxa and the differentiation parameter (GST) between the four ancestral taxa at each polymorphic position. The introgressions were identified through the analysis of the discontinuity in the pattern of two parameters along the genome: the heterozygosity and the similarity between the accession and the centroids of each horticultural group, representative of the ancestral taxa.
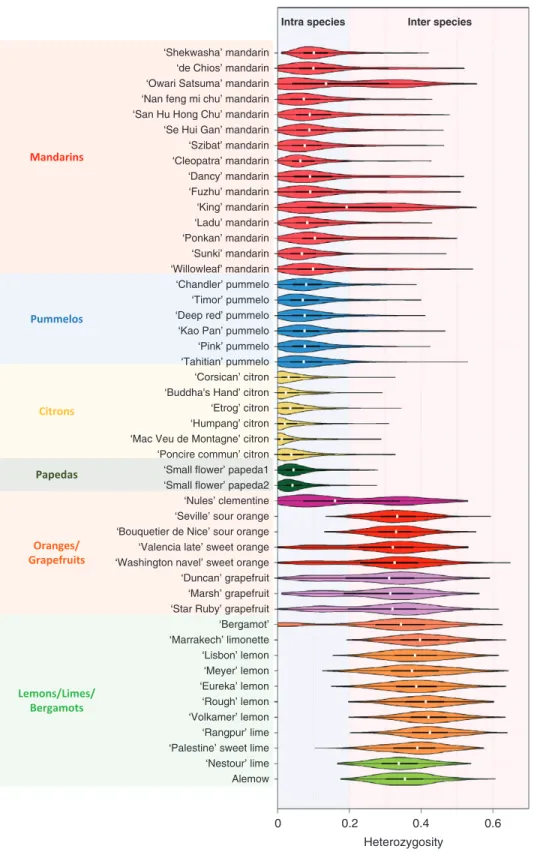
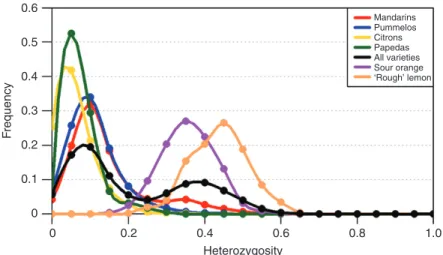
We examined the distribution of the observed heterozygo-sity of the diploid accessions with 100 polymorphic positions per window. Two main modes of distribution were observed among the varieties plotted individually (Fig. 5) or in sets (Fig. 6). These two modes correspond to intraspecific and interspecific heterozygosity, with values ranging between 0 and 0.2 and 0.2 and 0.7, respectively. Three distinct types of accessions were highlighted. The first type displayed a uni-modal distribution with a high value (the average value of each accession was between 0.3 and 0.4) corresponding to interspe-cific heterozygosity. Accessions of this type probably result from direct two-way or three-way interspecific hybridization.
Sour oranges, all lemons, ‘Marrakech’ limonette, ‘Rangpur’, ‘Palestine’ and ‘Nestour’ limes, as well as ‘Alemow’ displayed this pattern. A higher mid-value was observed for ‘Rough’ lemon than for sour orange [explained by the greater differ-entiation of C. reticulata (mandarins) with C. medica (citrons) than C. maxima (pummelos)]. Indeed, from WGS data, Wu et al. (2014, 2018) concluded that ‘Rough’ lemon and sour orange resulted from direct interspecific hybrids of
C. reticu-lata with C. medica and C. maxima, respectively. The second
type grouped the representative accessions of the basic taxa, except for the majority of mandarins. Pummelos, citrons and papedas displayed unimodal distribution, with average values of 0.09, 0.04 and 0.05, respectively. The representative man-darins belong to the third type of accessions with a bimodal distribution of heterozygosity, such as sweet orange, grapefruit, clementine and bergamot. The interspecific admixture among these accessions was highlighted. The same pattern of distribu-tion of heterozygosity in sweet orange was reported in Wu et al.
Table 2. Diversity of the 29 accessions representative of the four ancestral taxa
n Ho He Fw GST Mandarins (Na = 15) 18 567 0.121 ± 0.200 0.110 ± 0.162 –0.107 Pummelos (Na = 6) 7325 0.086 ± 0.212 0.070 ± 0.154 –0.001 Citrons (Na = 6) 7156 0.041 ± 0.163 0.044 ± 0.128 0.52 Papedas (Na = 2) 2285 0.016 ± 0.068 0.028 ± 0.113 –0.907 Total (Na = 29) 35 333 0.066 ± 0.04 0.063 ± 0.031 –0.1237 0.7831139
n, number of polymorphisms; Ho, observed heterozygosity; He, expected heterozygosity; Fw, Wright fixation index; GST, interpopulation differentiation param-eter; Na, number of accessions per taxon.
Mandarins Pummelos
Citrons Papedas ‘Pink’ pummelo
‘Kao Pan’ pummelo ‘Chandler’ pummelo ‘Timor’ pummelo ‘Tahitian’ pummelo ‘Deep red’ pummelo ‘Small flower’ papeda1 ‘Small flower’ papeda2 ‘King’ mandarin
‘Owari Satsuma’ mandarin ‘Sunki’ mandarin ‘Cleopatra’ mandarin ‘Shekwasha’ mandarin ‘San Hu Hong Chu’ mandarin ‘Nan feng mi chu’ mandarin ‘Ladu’ mandarin ‘Se Hui Gan’ mandarin ‘Willowleaf’ mandarin ‘de Chios’ mandarin ‘Ponkan’ mandarin ‘Szibat’ mandarin ‘Fuzhu’ mandarin ‘Dancy’ mandarin ‘Poncire commun’ citron ‘Corsican’ citron ‘Etrog’ citron ‘Humpang’ citron
‘Mac Veu de Montagne’ citron ‘Buddha’s Hand’ citron
1200 1000 800 600 400 200 0
Fig. 4. Hierarchical cluster analysis of the 29 representative accessions computed from the 43 598 diallelic SNPs.
Mandarins Pummelos Citrons Papedas Oranges/ Grapefruits Lemons/Limes/ Bergamots ‘Shekwasha’ mandarin ‘de Chios’ mandarin ‘Owari Satsuma’ mandarin ‘Nan feng mi chu’ mandarin ‘San Hu Hong Chu’ mandarin ‘Se Hui Gan’ mandarin
‘Corsican’ citron ‘Buddha's Hand’ citron ‘Etrog’ citron ‘Humpang’ citron ‘Mac Veu de Montagne’ citron ‘Poncire commun’ citron ‘Small flower’ papeda1 ‘Small flower’ papeda2 ‘Nules’ clementine ‘Seville’ sour orange ‘Bouquetier de Nice’ sour orange ‘Valencia late’ sweet orange ‘Washington navel’ sweet orange ‘Duncan’ grapefruit ‘Marsh’ grapefruit ‘Star Ruby’ grapefruit ‘Bergamot’ ‘Marrakech’ limonette ‘Lisbon’ lemon ‘Meyer’ lemon ‘Eureka’ lemon ‘Rough’ lemon ‘Volkamer’ lemon ‘Rangpur’ lime ‘Palestine’ sweet lime ‘Nestour’ lime Alemow ‘Chandler’ pummelo ‘Timor’ pummelo ‘Deep red’ pummelo ‘Kao Pan’ pummelo ‘Pink’ pummelo ‘Tahitian’ pummelo ‘Szibat’ mandarin ‘Cleopatra’ mandarin ‘Dancy’ mandarin ‘Fuzhu’ mandarin ‘King’ mandarin ‘Ladu’ mandarin ‘Ponkan’ mandarin ‘Sunki’ mandarin ‘Willowleaf’ mandarin Heterozygosity 0 0.2 0.4 0.6
Intra species Inter species
Fig. 5. Violin plots of the heterozygosity distribution in the 48 diploid accessions computed from the average values in successive windows of 100 polymorphic positions along the genome. White dot, median; bar limits; upper and lower quartiles; whiskers, 1.5× interquartile range; light blue, intraspecies; light pink,
interspecies.
(2014, 2018) from WGS data and in Oueslati et al. (2017) from GBS data. More specifically, the set of mandarins showed a first peak around 0.1, close to the peak of the set of pummelos, and
a second slight peak with a mode of approx. 0.3–0.35 (Fig. 6), as observed by Oueslati et al. (2017). At the individual level, the bimodal distribution in ‘Owari Satsuma’ mandarin and
‘King’ mandarin was particularly clear, a result consistent with those of Wu et al. (2018). As proposed by Wu et al. (2014)
and adopted by Oueslati et al. (2017), when examining the representative accessions, we considered that regions with low heterozygosity represent diploid segments which combine two haplotypes from the same species, while regions with high het-erozygosity were considered to be hybrid segments combining two haplotypes from two different species. Thus, regions with heterozygosity values >0.2 were assumed to be introgressed and were removed.
The patterns of similarity between each accession and the centroid of the four horticultural groups were also examined. The regions with an increase in heterozygosity were associated with a decrease in similarity to their representative horticultural group and an increase in similarity to the horticultural group involved in the introgression. An example is given for chromo-some 2 of the ‘King’ mandarin (Supplementary Data Fig. S4). A heterozygous introgression was clearly identified at the end of the chromosome. Heterozygosity increased with a decrease in similarity, starting at 25 Mb and continuing to the end of the chromosome. Similarity analysis was particularly useful to identify homozygous introgressions as described by Oueslati et al. (2017) for the ‘Ponkan’ variety. Indeed, respective similar-ity with the reference taxa and the introgressed taxa decreased and increased abruptly. The search for introgressions, based on the patterns of heterozygosity and similarities with centroids of the horticultural groups, was systematically performed on the nine chromosomes of the 29 representative accessions.
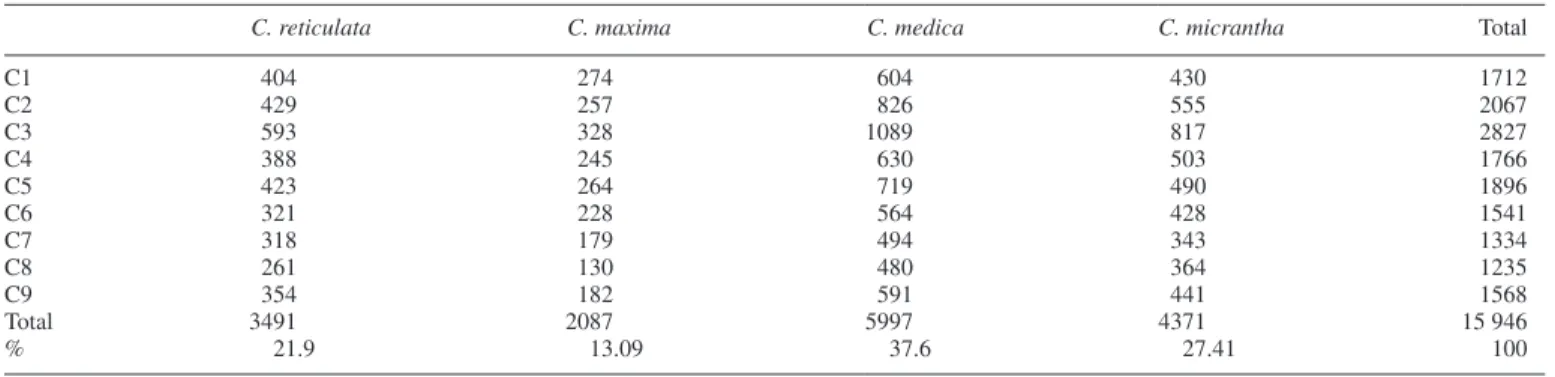
Allelic frequencies of the ancestral taxa and the differentiation parameter (GST) were then re-estimated considering the intro-gressed areas as missing data. All SNPs with GST >0.9 for one ancestral taxon compared with all others were considered as diagnostic of the taxon concerned. A total of 15 946 DSNPs of the four ancestral taxa distributed along the nine chromosomes (Table 3; Supplementary Data Table S2) were then identified. DSNPs of C. medica represented more than one-third (37.60%) of the total number of DSNPs. The low intraspecific heterozy-gosity of C. medica described above explains the higher number of diagnostic SNPs in this taxon (5997), and the same is true for the C. micrantha taxon whose DSNPs represent 27.41 % of the
total. Citrus reticulata and C. maxima are represented by 21.9 and 13.09 %, respectively, of the total number of DSNPs. The distri-bution of the 15 946 DSNPS along the nine chromosomes closely resembled the distribution of the whole set of polymorphisms and is closely linked with the distribution of the gene sequences (Supplementary Data Fig. S5). The selected DSNPs were used to decipher the phylogenomic mosaic structures of the 53 varieties.
Phylogenomic structure of modern varieties
Our main objective was to develop a pipeline for the analysis of GBS data which would make it possible to establish the phy-logenomic karyotype in diploid, triploid and tetraploid germ-plasm. For polyploid germplasm, this requires the ability to estimate allelic doses for heterozygous genotypes. Looking at individual SNP loci for the DSNPs of C. medica in the triploid ‘Persian’ lime (Supplementary Data Fig. S6), the frequency of
C. medica allele reads per locus did not display a clear bimodal distribution for heterozygous loci (Supplementary Data Fig. S6A) and, consequently, estimated allelic doses are subject to high uncertainty. When working with all reads of ten con-secutive loci, the bimodal distribution of the C. medica allele frequency was much clearer (Supplementary Data Fig. S6B), enabling efficient estimation of the dose of C. medica (1/3 and 2/3) in the genomic fragment corresponding to the ten markers considered. For the analysis of diploid and triploid Citrus germ-plasm, we kept ten DSNPs per window as default to estimate the doses for each ancestral taxon.
Using the TraceAncestor tool that we developed, we inferred the unphased phylogenomic karyotypes of the 53 accessions (Fig. 7). The average phylogenomic contributions of
C. reticu-lata, C. maxima, C. medica and C. micrantha to the modern varieties are presented in Supplementary Data Text S2.
Validation of the karyotypes inferred from GBS data
We compared karyotypes obtained from GBS data with those proposed by Wu et al. (2014, 2018) from WGS data
0 0 Heterozygosity 0.1 0.2 0.2 0.3 0.4 0.8 1.0 0.5 0.6 0.4 0.6 Frequency Mandarins Pummelos Citrons Papedas Sour orange ‘Rough’ lemon All varieties
Fig. 6. Distribution of the heterozygosity in mandarins, pummelos, citrons, papedas, all the diploid varieties, the ‘Seville’ sour orange and the ‘Rough’ lemon computed from the average values in successive windows of 100 polymorphic positions along the genome.
Table 3. Distribution of the 15 946 diagnostic SNPs (DSNPs) per taxon and per chromosome along the nine chromosomes
C. reticulata C. maxima C. medica C. micrantha Total
C1 404 274 604 430 1712 C2 429 257 826 555 2067 C3 593 328 1089 817 2827 C4 388 245 630 503 1766 C5 423 264 719 490 1896 C6 321 228 564 428 1541 C7 318 179 494 343 1334 C8 261 130 480 364 1235 C9 354 182 591 441 1568 Total 3491 2087 5997 4371 15 946 % 21.9 13.09 37.6 27.41 100
C1–C9, the nine chromosomes of the reference clementine genome (Wu et al., 2014); %, percentage of DSNPs for the taxon.
for four citrons (‘Buddha’s Hand’, ‘Corsican’, ‘Humpang’ and ‘Mac Veu de Montagne’), C. micrantha, seven man-darins (‘Ponkan’, ‘Owari Satsuma’, ‘King’, ‘Dancy’, ‘Sunki’, ‘Cleopatra’ and ‘Willowleaf’), ‘Chandler’ pum-melo, ‘Washington Navel’ sweet orange, ‘Seville’ sour orange, ‘Nules’ clementine, Marsh’ grapefruit, ‘Rough’ lemon, ‘Rangpur’ lime and ‘Eureka’ lemon. For example,
Supplementary Data Fig. S7A shows the phylogenomic karyotypes of the ‘Washington Navel’ sweet orange and the ‘Owari Satsuma’ mandarin inferred from our GBS data and from WGS data (Wu et al., 2014). As concluded by
Wu et al. (2018), the four citrons common to both studies and the two ‘small flower’ papeda were fully homozygous with C. medica and C. micrantha, respectively. Regarding ‘Chandler’ pummelo, only a small genomic area considered by Wu et al. (2014, 2018) to be introgressed in heterozygo-sity by C. reticulata on chromosome 2 (C2) coincided with an undetermined area in our karyotype generated from GBS data (Fig. 7A; Wu et al., 2018). For the rest of the genome, like Wu et al. (2014, 2018), we concluded homozygosity for
C. maxima. For the representative mandarins, the karyotypes inferred from GBS data completely matched those inferred from WGS (Wu et al., 2014, 2018) except for two small genomic regions. A small C. reticulata homozygous frag-ment in the C6 of ‘Owari Satsuma’ mandarin and a small heterozygous introgression of C. maxima at the beginning of the C2 of ‘Willow leaf’ mandarin were not detected by the GBS analysis. Focusing on the areas determined in our GBS analysis, we detected no differences between our results for sweet orange, sour orange, clementine, grapefruit, lime and lemons common to both analyses (Fig. 7B, C) and those obtained by Wu et al. (2018). Moreover, we checked the repeatability of the analysis through three experimental rep-licates (three independent samples during preparation of the GBS library) of ‘Nules’ clementine. The determined areas of the three replicates displayed exactly the same pattern (Supplementary Data Fig. S7B). Overall, phylogenomic kar-yotypes were successfully inferred from GBS data but with more undetermined regions than those inferred from WGS data. Given these positive results, we considered that our GBS workflow was validated and the karyotypes inferred for all the remaining varieties as a good approximation of the phylogenomic structure.
New karyotypes of diploid varieties
The analysis of the additional varieties representative of the four ancestral taxa revealed introgressions of C. maxima frag-ments in all mandarins except ‘Shekwasha’ mandarin. It varied between 1.39 % for ‘Se Hui Gan’ mandarin to 4.41 % in ‘San Hu Hong Chu’ mandarin, with variable introgression posi-tions in C2, C3, C4, C6, C8 and C9. ‘Shekwasha’ mandarin displayed a small introgression of C. micrantha in C3. In the case of pummelos, GBS data identified a small introgressed area by C. medica in the C7 of ‘Timor’ pummelo, while ‘Pink’, ‘Tahitian’, ‘Kao Pan’ and ‘Deep red’ pummelos appeared fully homozygous for C. maxima (Fig. 7A). In the same way, the two
C. medica not analysed in the study of Wu et al. (2018) (‘Etrog’ and ‘Poncire commun’ citrons) appeared fully homozygous for
C. medica.
For the secondary species, ‘Bouquetier de Nice’ sour orange displayed the same karyotype as ‘Seville’ sour orange with full
C. reticulata/C. maxima heterozygosity. Examining the deter-mined areas, ‘Valencia late’ sweet orange was found to be iden-tical to ‘Washington navel’, displaying C. reticulata/C. maxima heterozygosity or C. reticulata homozygosity all along the genome except on two fragments on C2 and C8, which appeared in C. maxima homozygosity. In the same way, ‘Duncan’ and ‘Star Ruby’ grapefruits were found to be identical to ‘Marsh’ (Fig. 7B). ‘Volkamer’ lemon appeared to be fully heterozy-gous for C. reticulata/C. medica along the nine chromo-somes, as previously observed for ‘Rangpur’ lime and ‘Rough’ lemon (Wu et al., 2018; this study). Karyotypes of ‘Palestine’ sweet lime, ‘Marrakech’ limonette, and ‘Meyer’ and ‘Lisbon’ lemons displayed interspecific heterozygous fragments of
C. medica/C. reticulata and C. medica/C. maxima (Fig. 7B) as previously described for ‘Eureka’ lemon (Wu et al., 2018; our present results from GBS). Moreover ‘Lisbon’ and ‘Eureka’ lem-ons were strictly identical in their determined areas. Bergamot displayed a much more complex admixture of C. maxima,
C. reticulata and C. medica genomes. Indeed, in addition to the
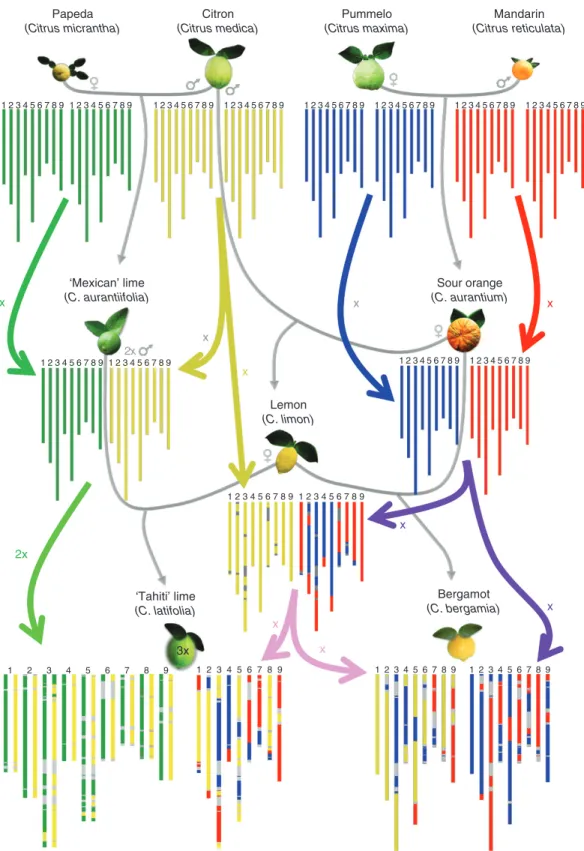
C. medica/C. reticulata and C. medica/C. maxima heterozygo-sity regions, we found fragments in C. reticulata/C. maxima heterozygosity, C. reticulata homozygosity (C7) and C. maxima homozygosity (C3, C4, C6 and C7). Referring to the hypoth-esis that the bergamot comes from a hybridization between a sour orange and a lemon (Gallesio, 1811; Curk et al., 2016), we examined the ancestor allelic dosage of the 100 kb windows of
this variety and its assumed parents. A total of 99.12 % of them completely fit with the hypothesis, each parental gamete bringing the ancestor allelic doses observed in the bergamot. The remain-ing 0.88 % corresponds to C. reticulata/C. maxima heterozygo-sity regions located in the C1 and C6 undetermined in lemon. Considering this origin hypothesis and the haplotype structure of the parental genomes, we have been able to draw the ber-gamot phased karyotype (Fig. 8; Supplementary Data Fig. S8). ‘Alemow’ and ‘Nestour’ lime displayed
C. micrantha/C. med-ica heterozygosity for the nine chromosomes. It should be noted that ‘Alemow’ presented a relatively high proportion of undeter-mined areas (39.46 %), probably due to a low sequencing cover-age (65 % of missing data at the SNP level).
Karyotypes of polyploid varieties
The phylogenomic structures of ‘Tanepao’, ‘Coppenrhad’, ‘Tahiti’ and ‘Persian’ triploid limes (Fig. 7C) and ‘Giant Key’ tetraploid lime were also inferred with the ‘TraceAncestor’ tool (Fig. 7D). ‘Tahiti’ and ‘Persian’ limes involving the
contribution of the four basic taxa and, excluding undetermined areas, noticeably had the same phylogenomic karyotype. The quasi-systematic single dose of C. micrantha, the frequent double dose of C. medica and the occurrence of a double dose of C. micrantha (C3 and C5) and a triple dose of C. medica (C5) on small fragments, while C. reticulata and C. maxima were found only in single doses, fit the hypothesis that these limes derive from the union of a diploid ovule of ‘Mexican’ lime (C. aurantiifolia = C. micrantha × C. medica) and hap-loid pollen of lemon [C. limon = (C. maxima × C. reticulata) × C. medica] as proposed by Curk et al. (2016) and Rouiss et al. (2018). Therefore, following this hypothesis, we propose a phased karyotype identifying the haploid and diploid gametes from which this triploid lime originated (Fig. 8). For all the chromosomes, except C3 and C5, we observed a total restitu-tion of the ‘Mexican’ lime-like parent by the diploid gamete. The representation of chromosomes 3 and 5 is just one of the different possibilities of C. medica and C. micrantha fragment phases in the diploid gamete. The interspecific recombination points in the diploid C. aurantiifolia and haploid C. limon gam-etes were clearly identified (Fig. 7C).
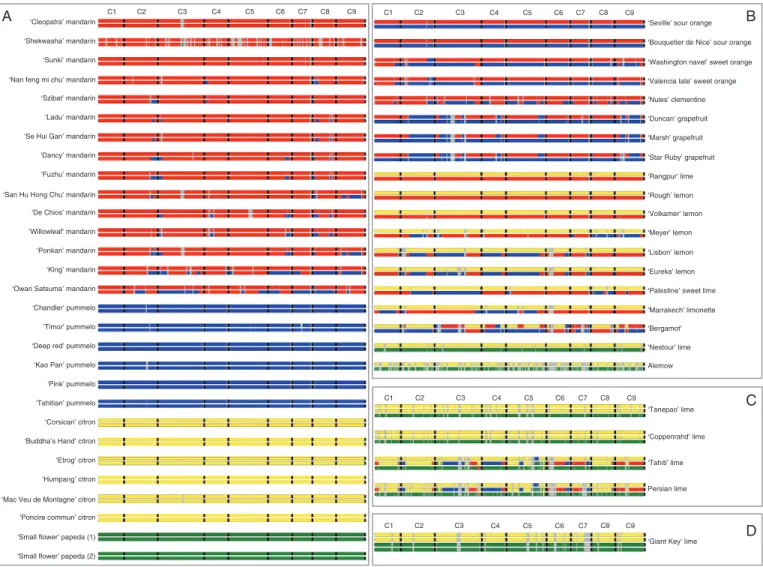
A
‘Shekwasha’ mandarin
‘De Chios’ mandarin
‘Owari Satsuma’ mandarin ‘Nan feng mi chu’ mandarin
‘San Hu Hong Chu’ mandarin ‘Se Hui Gan’ mandarin ‘Szibat’ mandarin ‘Cleopatra’ mandarin ‘Dancy’ mandarin ‘Fuzhu’ mandarin ‘King’ mandarin ‘Ladu’ mandarin ‘Ponkan’ mandarin ‘Sunki’ mandarin ‘Willowleaf’ mandarin ‘Chandler’ pummelo ‘Timor’ pummelo ‘Deep red’ pummelo ‘Kao Pan’ pummelo ‘Pink’ pummelo ‘Tahitian’ pummelo ‘Corsican’ citron ‘Buddha’s Hand’ citron ‘Etrog’ citron ‘Humpang’ citron ‘Mac Veu de Montagne’ citron ‘Poncire commun’ citron ‘Small flower’ papeda (1) ‘Small flower’ papeda (2)
C1 C2 C3 C4 C5 C6 C7 C8 C9 B
‘Seville’ sour orange ‘Bouquetier de Nice’ sour orange ‘Washington navel’ sweet orange ‘Valencia late’ sweet orange ‘Nules’ clementine ‘Duncan’ grapefruit ‘Marsh’ grapefruit ‘Star Ruby’ grapefruit ‘Rangpur’ lime ‘Rough’ lemon ‘Volkamer’ lemon
‘Palestine’ sweet lime ‘Marrakech’ limonette ‘Lisbon’ lemon ‘Meyer’ lemon ‘Eureka’ lemon ‘Bergamot’ Alemow ‘Nestour’ lime C1 C2 C3 C4 C5 C6 C7 C8 C9 ‘Coppenrahd’ lime Persian lime ‘Tahiti’ lime ‘Tanepao’ lime C C1 C2 C3 C4 C5 C6 C7 C8 C9
‘Giant Key’ lime D
C1 C2 C3 C4 C5 C6 C7 C8 C9
Fig. 7. Unphased phylogenomic karyotypes of the 53 varieties of the study. (A) Karyotypes of the representative accessions of the four ancestral taxa. (B) Karyotypes of the secondary admixture species. (C) Karyotypes of the triploid hybrids. (D) Karyotype of the tetraploid hybrid lime. Red, C. reticulata; blue,
C. maxima; yellow, C. medica; green, C. micrantha; grey, indeterminacy; black, separation between chromosomes.
For determined areas, ‘Coppenrhad’ and ‘Tanepao’ limes displayed an identical pattern involving only C. medica and
C. micrantha with single doses of C. micrantha and double doses of C. medica all along the nine chromosomes.
For the tetraploid ‘Giant key’ lime, the phylogenomic analysis with ten DSNPs per window produced many unde-termined regions (60.58 %), due to a relatively low coverage (Supplementary Data Fig. S1) and the higher difficulty to
Pummelo (Citrus maxima) Mandarin (Citrus reticulata) Citron (Citrus medica) Papeda (Citrus micrantha) Sour orange (C. aurantium) Bergamot (C. bergamia) Lemon (C. limon) 3x ‘Tahiti’ lime (C. latifolia) ‘Mexican’ lime (C. aurantiifolia) 1 2 3 4 5 6 7 8 9 1 2 3 4 5 6 7 8 9 1 2 3 4 5 6 7 8 9 1 2 3 4 5 6 7 8 9 1 2 3 4 5 6 7 8 9 1 2 3 4 5 6 7 8 9 1 2 3 4 5 6 7 8 9 1 2 3 4 5 6 7 8 9 1 2 3 4 5 6 7 8 9 1 2 3 4 5 6 7 8 9 1 2 3 4 5 6 7 8 9 1 2 3 4 5 6 7 8 9 2x 1 2 3 4 5 6 7 8 9 1 2 3 4 5 6 7 8 9 1 2 3 4 5 6 7 8 9 1 2 3 4 5 6 7 8 9 1 2 3 4 5 6 7 8 9 1 2 3 4 5 6 7 8 9 x 2x x x x x x x x x
Fig. 8. Phylogenetic origin and phased phylogenomic karyotypes of the sour orange (C. aurantium), the lemon (C. limon), the bergamot (C. bergamia) and the ‘Tahiti’ lime (C. latifolia). Red, C. reticulata; blue, C. maxima; yellow, C. medica; green, C. micrantha; grey, indeterminacy. The grey arrows indicate the cross
between species, and the coloured arrows indicate whether the species contributes with x or 2x gametes.
distinguish 1/3, 2/2 and 3/1 doses for heterozygous genotypes. Therefore, we tested the inference with 20 and 30 DSNPs (Supplementary Data Fig. S9). The karyotype we obtained with 30 DSNP windows allowed a better estimation of the allelic doses and was able to reduce the undetermined regions to only 20 %. It showed full C. medica/C. micrantha heterozygosity along the genome.
DISCUSSION
The DSNP-based approach is powerful to decipher the admixture genomic structure in Citrus
Recent studies based on NGS (WGS and GBS) analysed the admixture of modern citrus varieties. They were based on the identification of diagnostic polymorphism (mainly SNPs) of the ancestral taxa considered. Wu et al. (2014) were the first to develop the DSNP approach to decipher the genomic struc-tures of modern varieties originating from two ancestral taxa,
C. reticulata and C. maxima, from WGS data. They used a small panel of mandarins (three varieties) and pummelos (two varieties), as representative of C. reticulata and C. maxima, to identify SNPs that distinguish these two ancestral taxa. The pat-terns of heterozygosity and similarity to the other mandarins and pummelos were used to identify introgressed areas in the different varieties in the two panels. The study revealed unex-pected C. maxima introgressions in ‘Ponkan’ and ‘Willowleaf’ mandarins which were previously believed to be pure repre-sentatives of the C. reticulata taxon. The very large set of iden-tified DSNPs was highly efficient to decipher the phylogenomic structures of clementine, sweet and sour oranges and ‘Afourer’ mandarin (W Murcott). Oueslati et al. (2017) showed that a similar approach can be used with GBS data using the ApeKI restriction enzyme. They expanded the phylogenomic analysis to 55 citrus varieties composed of representatives of
C. max-ima and C. reticulata taxa and hybrids assumed to derive from the admixture of these two taxa (mandarins, tangors, tangelos, orangelos and grapefruits). From a larger panel of representa-tive mandarins (11 varieties) and pummelos (six varieties), these authors identified a set of 11 133 diagnostic polymor-phisms, mostly SNPs (89 %), with a very similar pattern of distribution along the genome to those of gene sequences. This allowed them to infer the phylogenomic karyotypes of all the accessions by analysing the relative proportion of diagnostic markers homozygous for C. reticulata or C. maxima, or het-erozygous in successive windows of 20 diagnostic markers.
Curk et al. (2015) were the first to publish sets of DSNPs for the four Citrus ancestral taxa. They identified 273 DSNPs from 454 amplicon sequencing data of 57 gene fragments dispersed on the nine chromosomes. They then developed allele competi-tive PCR markers (using KASPar technology) for 105 of these DSNPs and successfully analysed the interspecific origin of >200 Citrus accessions (Curk et al., 2015, 2016) and revealed systematic introgression of C. maxima in edible mandarins. However, the low number of DSNPs used in these studies did not make it possible to infer the phylogenomic karyotypes of the analysed varieties.
Wu et al. (2018) mined DSNPs which differentiate three of the four basic taxa (C. maxima, C. medica and C. reticulata) using only two pure Chinese mandarins, two citrons and three
pummelos. They identified a total of 588 583 DSNPs (169 963 for C. reticulata, 116 803 for C. maxima and 301 817 for
C. medica) and used them to decipher the phylogenomic karyo-type of 47 Citrus varieties.
Whether the studies dealt with WGS (Wu et al., 2014, 2018), GBS (Oueslati et al., 2017) or DSNP markers (Curk et al., 2015, 2016), the analyses have always identified C. maxima introgressions in most cultivated mandarins. If the correspond-ing sequences are taken into account when estimatcorrespond-ing the allelic frequencies of the ancestral taxa, this introduces a bias in the estimation of the diversity parameters (allelic frequencies of the ancestral taxa and GST) and hence in the detection of diagnostic polymorphisms of the four ancestral taxa. This is why Wu et al. (2018) drastically limited their representative panel to only two pure genetically close mandarins. However, such a small panel could result in considering specific SNPs of the considered acces-sions as diagnostic of C. reticulata, whereas in fact polymor-phisms existed within the species. Therefore, for our analysis, we preferred to keep the panel of representatives of the ancestral taxa as large as possible and used 15 mandarins, six pummelos, six citrons and two ‘small flowered’ papeda as representative of
C. reticulata, C. maxima, C. medica and C. micrantha, respec-tively. Therefore, like Oueslati et al. (2017), we first identified introgression areas along the genome of the 29 representative accessions of the basic taxa according to the pattern along the genome of heterozygosity and to similarity with centroids of mandarins, pummelos, citrons and papedas. After removing the identified introgression regions, we computed the differentiation parameters again and filtered for polymorphic positions with
GST >0.9. We selected 15 946 DSNPs and developed a pipeline to infer the phylogenomic structures of the 53 citrus accessions. Taking into account the difficulty involved in correctly estimat-ing the allelic doses in triploid and tetraploid accessions at indi-vidual SNP loci (McKinney et al., 2018; Bastien et al., 2018; our data) and according to our choice of using the same ana-lytical approach for diploids, triploids and tetraploids, we based our pipeline on the relative number of reads of each ancestor in windows of ten DSNPs of the considered taxon (while Wu et al., 2014, 2018 and Oueslati et al., 2017 performed their analysis in diploid accessions from genotyping data at individual loci) and on maximum likelihood analysis.
For diploid accessions common to both studies, our GBS data produced highly similar results to those obtained from WGS data (Wu et al., 2014, 2018), apart from the undetermined genomic areas, which were more frequent for GBS data, due to a lower density of DSNPs.
Therefore, GBS combined with our analytic pipeline proves to be a powerful approach to correctly analyse the phylogenomic admixture of diploid, triploid and tetraploid citrus varieties along the genome at significantly lower cost than the WGS approach. The panel of DSNPs can be used as reference for further GBS analyses using the same protocol (ApeKI; selection base A) to decipher the phylogenomic karyotypes in large citrus popula-tions (germplasm or recombining populapopula-tions). It opens the way for genetic association studies, quantitaive trait locus (QTL) analyses and genomic selection based on phylogenomics.
We developed a generic pipeline to decipher admixture in diploid, triploid and tetraploid genomes from an unlimited number of ancestors, allowing the user to define the number of DSNPs per window for the analysis of the dose contributed by