HAL Id: hal-02613340
https://hal.archives-ouvertes.fr/hal-02613340
Submitted on 9 Sep 2020HAL is a multi-disciplinary open access archive for the deposit and dissemination of sci-entific research documents, whether they are pub-lished or not. The documents may come from teaching and research institutions in France or abroad, or from public or private research centers.
L’archive ouverte pluridisciplinaire HAL, est destinée au dépôt et à la diffusion de documents scientifiques de niveau recherche, publiés ou non, émanant des établissements d’enseignement et de recherche français ou étrangers, des laboratoires publics ou privés.
Behavioural inference from signal processing using
animal-borne multi-sensor loggers: a novel solution to
extend the knowledge of sea turtle ecology
Lorène Jeantet, Víctor Planas-Bielsa, Simon Benhamou, Sebastien Geiger,
Jordan Martin, Flora Siegwalt, Pierre Lelong, Julie Gresser, Denis Etienne,
Gaëlle Hiélard, et al.
To cite this version:
Lorène Jeantet, Víctor Planas-Bielsa, Simon Benhamou, Sebastien Geiger, Jordan Martin, et al.. Behavioural inference from signal processing using animal-borne multi-sensor loggers: a novel solution to extend the knowledge of sea turtle ecology. Royal Society Open Science, The Royal Society, 2020, 7 (5), pp.200139. �10.1098/rsos.200139�. �hal-02613340�
Behavioural inference from signal processing using animal-borne
multi-sensor loggers: a novel solution to extend the knowledge of sea
turtle ecology
Lorène Jeantet1, Víctor Planas-Bielsa2, Simon Benhamou3, Sebastien Geiger1, Jordan
1
Martin1, Flora Siegwalt1, Pierre Lelong1, Julie Gresser4, Denis Etienne4, Gaëlle Hiélard5,
2
Alexandre Arque5, Sidney Regis1, Nicolas Lecerf1, Cédric Frouin1, Abdelwahab
3
Benhalilou6, Céline Murgale6, Thomas Maillet6, Lucas Andreani6, Guilhem
4
Campistron6, Hélène Delvaux7, Christelle Guyon7, Sandrine Richard8, Fabien Lefebvre1,
5
Nathalie Aubert1,Caroline Habold1,Yvon le Maho1,2, Damien Chevallier1.
6 7 8
1Institut Pluridisciplinaire Hubert Curien, CNRS–Unistra, 67087 Strasbourg, France.
9
2Centre Scientifique de Monaco, Département de Biologie Polaire, 8 quai Antoine Ier, MC
10
98000 Monaco. 11
3Centre d’Écologie Fonctionnelle et Évolutive, CNRS, Montpellier, France & Cogitamus Lab.
12
4DEAL Martinique, Pointe de Jaham, BP 7212, 97274 Schoelcher Cedex, France.
13
5Office de l’Eau Martinique, 7 Avenue Condorcet, BP 32, 97201 Fort-de-France, Martinique,
14
France. 15
6Association POEMM, 73 lot papayers, Anse a l'âne, 97229 Les Trois Ilets, Martinique.
16
7 DEAL Guyane, Rue Carlos Finley, CS 76003, 97306 Cayenne Cedex, France.
17
8Centre National d'Etudes Spatiales, Centre Spatial Guyanais, BP 726, 97387 Kourou Cedex,
18
Guyane. 19
20 21
*Corresponding author: Lorène Jeantet lorene.jeantet@iphc.cnrs.fr 22
23
Keywords: supervised learning algorithms, accelerometer, sea turtle, animal-borne 24
camera, behavioural classification, marine ecology 25
Abstract 27
28
The identification of sea turtle behaviours is a prerequisite to predicting the activities and 29
time-budget of these animals in their natural habitat over long term. However, this is 30
hampered by a lack of reliable methods that enable the detection and monitoring of certain 31
key behaviours such as feeding. This study proposes a combined approach that automatically 32
identifies the different behaviours of free-ranging sea turtles through the use of animal-borne 33
multi-sensor recorders (accelerometer, gyroscope and time-depth recorder), validated by 34
animal-borne video-recorder data. We show here that the combination of supervised learning 35
algorithms and multi-signal analysis tools can provide accurate inferences of the behaviours 36
expressed, including behaviours that are of crucial ecological interest for sea turtles, such as 37
feeding and scratching. Our procedure uses multi-sensor miniaturized loggers that can be 38
deployed on free-ranging animals with minimal disturbance. It provides an easily adaptable 39
and replicable approach for the long-term automatic identification of the different activities 40
and determination of time-budgets in sea turtles. This approach should also be applicable to a 41
broad range of other species and could significantly contribute to the conservation of 42
endangered species by providing detailed knowledge of key animal activities such as feeding, 43
travelling and resting. 44 45 46 47 48 49 50 51 52 53 54 55 56 57 58 59 60
61
1 Introduction 62
It is essential to assess the feeding behaviours of free-ranging animals in order to estimate 63
their time budgets, and thus understand how these animals maximise their fitness [1,2]. 64
However, investigating the foraging behaviour of sea turtles in their natural environment 65
remains a significant challenge as it is impossible to obtain long-term behavioural data 66
through visual observations alone. Although some studies have provided relevant information 67
on sea turtle diet through post-mortem stomach content analysis or the deployment of animal-68
borne video-recorders [3–5], the proportion of time that sea turtles allocate to feeding 69
activities on the long term remains unknown. Time-depth recorders (TDR) have been used to 70
record the dive profiles and durations of free-ranging sea turtles and have provided insights 71
into their underwater activities [6–8]. However, a number of authors have underlined the 72
limits of focussing on dive profile, as foraging activity cannot be distinguished from transit or 73
resting phases [9,10]. The joint use of TDR and video recorders revealed that the typical dive 74
types described in [11,12] could not be associated with specific activities such as travelling, 75
resting or foraging [13,14]. 76
Devices combining miniaturised tri-axial accelerometers and TDR were described as a 77
powerful tool to improve the identification of fine-scale behaviours in animals that cannot be 78
easily monitored by visual observation [15–17]. Such devices have been deployed to study the 79
behaviour and dive patterns of loggerheads (Caretta caretta, 18), green turtles (Chelonia 80
mydas,19) and leatherbacks (Dermochelys coriacea, 20) during the inter-nesting period. 81
However, the interpretation of the acceleration signals used in these studies to identify sea 82
turtle behaviours in water was not validated by simultaneous visual observation, possibly 83
resulting in misidentification and significant biases in the interpretation of the data. 84
A new approach was therefore necessary to reliably identify the underwater behaviours 85
of free-ranging sea turtles without using direct visual observation (which is usually 86
impossible) or video recordings, which are limited to short-term studies (a few hours) because 87
of their high power consumption. Accelerometers permit the identification of feeding activity 88
and time budget in marine animals such as seals and penguins by recording head movements 89
that are likely to correspond to prey captures [21–23]. For the same purpose, accelerometers 90
have been placed on the beak [24–27] or the top of the head [28] of sea turtles to record beak-91
openings and capture attempts. However, the position of the device was a significant 92
disturbance for the individuals and could not be considered for long-term use (up to several 93
weeks). It was therefore crucial to develop a protocol for the long-term recording and 94
identification of sea turtle feeding activities that minimizes disturbance to the animals whilst 95
making optimal use of the subtle variations in data acquired by loggers that are mounted on 96
the carapace rather than the head. 97
Further work is needed to validate the identification of sea turtle underwater behaviours 98
by data acquired by animal-borne sensors. In particular, before attempting to provide new 99
insights about the at-sea behaviours of sea turtles in natural conditions, one needs is to 100
automatically and correctly identify these behaviours, including those that are hard to detect 101
but play a key role such as feeding, from data acquired in a way that minimizes the 102
disturbance of equipped animal. The aim of our study is therefore to develop a new approach 103
fulfilling this need. In this framework, we will use the results we obtained about turtles' 104
behaviours only to illustrate the output of our approach without giving them any biological 105
significance. Although sea turtle behaviours have mainly been inferred from combined 106
acceleration and depth data, the additional use of a gyroscope (which records angular 107
velocity) can provide further relevant information in remote behavioural identification [29– 108
31]. Thus, we deployed loggers combining an accelerometer, a gyroscope and a TDR on the 109
carapace of free-ranging immature green turtles. This equipment was linked to a video-110
recorder that was mounted in the logger device to provide visual evidence that could validate 111
logger interpretations of behaviours, given that our approach ultimately aims to infer 112
behaviours solely through logger use. Surface behaviours were identified separately from 113
depth data. The study tested a set of methods to infer diving behaviours from the signals 114
provided by the accelerometer, gyroscope and TDR, including automatic segmentation and 115
supervised learning algorithms. The validity of our approach was tested through the use of 116
confusion matrices and by comparing the inferred activity budgets with those obtained from 117
video recordings. 118
119
2 Material and Methods 120
2.1 Ethics statements 121
This study meets the legal requirements of the countries in which the work was carried out 122
and follows all institutional guidelines. The protocol was approved by the “Conseil National 123
de la Protection de la Nature” (http://www.conservation-nature.fr/acteurs2.php?id= 11), and 124
the French Ministry for Ecology, Sustainable Development and Energy (permit number: 125
2013154-0037), which acts as an ethics committee in Martinique. The fieldwork was carried 126
out in strict accordance with the recommendations of the Prefecture of Martinique in order to 127
minimize the disturbance of animals (Authorisation n°201710-0005). 128
129
2.2 Data collection from free-ranging green turtles 130
The field work was carried out from February 2018 to May 2019 in Grande Anse d’Arlet 131
(14°50’N, 61°09’W), Martinique, France. We deployed CATS (Customized Animal Tracking 132
Solutions, Germany) devices for periods ranging from several hours to several days on free-133
ranging immature green turtles. A CATS device is comprised of a video-recorder (1920 x 134
1080 pixels at 30 FPS) combined with a tri-axial accelerometer, a tri-axial gyroscope and a 135
TDR (Supplementary Material, Fig. 1). The maximum battery capacity was considered to 136
provide a recording capacity of 18 h of video footage and 48 h for other data. These devices 137
were programmed to record acceleration and angular velocity (gyroscope) at a frequency of 138
20 or 50 Hz according to the recording capacity of the logger (the 50 Hz data were 139
subsampled at 20 Hz using a linear interpolation to homogenise the sample). Depth was 140
recorded at 1 Hz using a pressure sensor with a range from 0 to 2000 m and 0.2m accuracy. 141
The relatively shallow depths of the area allowed free divers to capture the turtles 142
manually, as described in Nivière et al. (2018) [32]. Once an individual had been caught, it 143
was placed on a boat and identified by scanning its PIT (Passive Integrated Transponder) or 144
tagged with a new PIT if it was unknown. It was then weighed and its carapace length was 145
measured (Supplementary Material, Table S1). The device was attached to the carapace using 146
four suction cups. Air was manually expelled from the cups, which were held in place by the 147
use of a galvanic timed release system. The eventual dissolving of these releases by sea water 148
and the positive buoyancy of the device (23.3 x 13.5 x 4 cm for 0.785 kg) led to the remote 149
release of the device several hours later. Devices were recovered by geolocation of their 150
Argos SPOT-363A tag (MK10, Wildlife Computers Redmond, WA, USA) with a goniometer 151
(RXG-134, CLS, France). Instruments were deployed on 37 individuals, but complete datasets 152
including video, acceleration, gyroscope and depth values were only recovered for 13 153
individuals (Supplementary Material, Table S1). 154
155
2.3 Processing of video data and behavioural labelling 156
The video footage was watched to identify the various behaviours and determine their starting 157
and ending times to the closest 0.01 s. Acceleration, angular velocity and depth data 158
corresponding to each behavioural phase were visualized using R software (version 3.5.3) and 159
the package rblt (Fig 1 & 2; 33). The 46 resulting behaviours were clustered into categories 160
according their similarities (the definition of the various behaviours is available in 161
Supplementary Material, Table S2). We retained seven main expressed categories for the 162
multi-sensor signals, namely “Breathing”, “Feeding”, “Gliding”, “Swimming”, “Resting”, 163
“Scratching” and “Staying at the surface”. All other behaviours were very infrequent and 164
were grouped in an eighth category labelled “Other”. 165
166
2.4 Analysis of the angular velocity and acceleration data 167
The device was installed on the carapace in a tilted position along a longitudinal axis to obtain 168
video images of the head. This results in biased values of accelerations and angular speeds for 169
the surge (i.e. back-to-front) and heave (bottom-to-top) body axes, which therefore had to be 170
corrected (see R-script in Supplementary Material). The static acceleration vector (i.e. the 171
component due to gravity) a (ax,ay,az) was obtained by separately averaging the 172
acceleration values (ax, ay and az) on the surge, sway (right-to-left) and heave axes,
173
respectively, over a centred running temporal window set to t = 2 s. which was the smallest 174
window resulting in a norm, a that remains close to 1 g (9.98 m/s2) for almost all measures.
175
The Dynamic Body Acceleration was then computed as DBA = d2, where d a a is the
176
dynamic acceleration vector [34]. Similarly the Rotational Activity was computed as RA = 177
g2, where g = (g
x, gy, gz) is the angular velocity (gx, gy, and gz correspond respectively to the
178
values of roll, pitch and yaw per unit time provided by the gyroscope). 179
180
2.5 Segmentation of the multi-sensor dataset 181
The automatic identification of the labelled behaviours from the multi-sensor signals required 182
the segmentation of the dataset into homogenous behavioural bouts with respect to a given 183
variable. We started by relying on the depth data to distinguish the dives, defined as depths 184
exceeding 0.3 m for at least 5 s, from the surface periods. We attributed the surface periods to 185
either "Breathing” or “Staying at the surface”, according to whether the turtle remained at the 186
surface for less or more than 6 s, respectively. We then distinguished between the various 187
possible diving behaviours by using a changepoint algorithm, the Pruned Exact Linear Time 188
(PELT) algorithm (R package changepoint; 35), in which the "pen.value" parameter, which 189
corresponds to the additional penalty in the cost function for each additional partition of the 190
data, can be manually adjusted. We tested different values and retained those which resulted 191
in the best balance between obtaining homogenous behavioural bouts and limiting over-192
segmentation. We first detected depth changes over 3 s of each dive (function cpt.mean, 193
penalty = "Manual”, pen.value = 5) to obtain segments which were labelled as "ascending", 194
"descending" or "flat" depending on whether the vertical speed was > 0.1 m.s-1, <–0.1 m.s-1 or
195
between these two values, respectively. These ascending and descending segments were 196
further segmented based on the DBA mean and variance (function cpt.meanvar, penalty = 197
"Manual”, pen.value = 50) in order to distinguish between the swimming and gliding phases 198
of these segments. The green turtle is a grazing herbivore which mainly feed on seagrass and 199
algae [36]. The head movements occurring during feeding activities are easily detected by 200
gyroscopes and/or accelerometers set directly on the head, but are rarely detected when these 201
sensors are placed on the carapace. We did however note that the carapace tended to display 202
pitch oscillations when the turtle pulled on the seagrass, an activity that we refer to hereafter 203
as “Grabbing” (Fig 2). Accordingly, we further segmented the "flat" segments based on the 204
variance of gy (angular speed in the animal's sagittal plane; function cpt.var, penalty =
205
"Manual”, pen.value = 20) to pinpoint this behaviour. Each segment was then labelled as 206
either the behavioural category that was expressed for at least 3/5 of its duration, or as 207
“Transition” if several behaviours were involved with none of them occurring for 3/5 of the 208
behavioural bout. Thus, the overall procedure classified multi-sensor signals into nine 209
categories comprised of surface behaviours (“Breathing” and “Staying at the surface”) which 210
were identified using depth data alone, diving behaviours (“Feeding, “Gliding”, “Resting”, 211
“Scratching” and “Swimming”) and also “Other” and “Transition”, for which supervised 212
learning algorithms were required. 213
214
2.6 Identification of the diving behaviours by supervised learning algorithms 215
We trained five supervised machine learning algorithms – (1) Classification And Regression 216
Trees (CART), (2) Random Forest (RF), (3) Extreme Gradient Boosting (EGB), (4) Support 217
Vector Machine (SVM), and (5) Linear Discriminant Analysis (LDA) – to associate the eight 218
diving behaviour categories with the corresponding patterns of different input variables. They 219
are the most commonly used classifiers in behaviour recognition and are considered to be 220
relevant in ecology studies [17,37,38]. These algorithms were applied to our data using the R 221
packages rpart [39] for CART, randomForest [40] for RF (n=300, mtry=14), xgboost [41] for 222
EGB (num_class=8, eta=0.3, max_depth=3), e1071 [42] for SVM and MASS [43] for LDA. 223
For each segment, the algorithms were fed with four descriptive statistics (mean, 224
minimum, maximum, and variance) computed for the three linear acceleration values (ax, ay
225
and az), for the three angular speeds values (gx, gy and gz), and for DBA and RA. We also
226
included the difference between the last and first depth values, and the duration of each 227
segment. The fact that "Feeding" was characterised by high-frequency oscillations, in 228
particular in terms of pitch speed (Fig 2), but also (although less obviously) in terms of roll 229
speed and surge/sway accelerations, enabled us to distinguish this behaviour from the others. 230
To do so, we filtered the raw values of gx,gy, ax and ay through a running window of 1 s and
231
subtracted the obtained smoothed values from the respective raw values, then calculated the
232
local mean of the obtained high frequency signals. We then computed the squared differences 233
between the high frequency values and their respective local means in order to characterize 234
these oscillations. The mean and the maximum value of these squared differences for each 235
segment were then added to the list of variables used to feed the algorithms, i.e. 42 variables 236
for each segment. Such a number of variables may be characterised numerous correlations. 237
However, machine learning algorithms are less sensitive than classical regression methods to 238
correlation in the explanatory variables. Nevertheless, for a simpler interpretation purpose, we 239
looked for some possible reduced set of variables that may reach the same accuracy as the full 240
data set, but we did not find any convincing one that had a close performance to the full data 241
set. As the focus was more on predictability than interpretability (as is usual the case in 242
machine learning), we kept all the 42 variables. 243
244
2.7 Validation of the automatic behavioural inferences 245
To estimate the ability of our procedure to correctly infer the behaviours of sea turtles based 246
on acceleration, angular velocity and depth data, we repeatedly performed 2/3:1/3 splits of the 247
sample of 13 individuals, with nine individuals retained for the learning phase and the 248
remaining four individuals used to validate the outcome. From the 715 possible combinations, 249
we retained the 358 combinations in which “Feeding” and “Scratching” were not under-250
represented in the training dataset (i.e. when more than 60% of total feeding and scratching 251
segments were present, i.e. 1145 and 868, respectively). Nevertheless, the number of 252
“Feeding” and “Scratching” segments was much lower than those attributed to “Resting” and 253
“Swimming” (17325 and 9795 segments, respectively). As an unbalanced training dataset can 254
hinder the performance of supervised learning algorithms [44], we set an upper limit at 1000 255
segments per behaviour for the training dataset. These segments were randomly selected for 256
the over-expressed categories at each training trial. 257
For each trial, we evaluated the efficiency of the different methods by computing the 258
number of well-identified behaviours (true positive, TP, and true negative, TN) and of 259
behaviours considered to be misclassified (false negative, FN, and false positive, FP) into a 260
confusion matrix. We calculated three indicators for each behaviour: (1) "Sensitivity" = 261
TP/(TP+FN), also called true positive rate, hit rate or recall, measures the ability of a method 262
to detect the target behaviour among other behaviours; (2) "Precision" = TP/(TP+FP), also 263
called positive predictive value, measures the ability of a method to correctly identify the 264
target behaviour; and (3) "Specificity" = TN/(TN+FP), also called selectivity or true negative 265
rate, measures the ability of a method to avoid wrongly considering other behaviours as the 266
target behaviour. We also computed "Accuracy" = (TP+TN)/(TP+TN+FP+FN), which 267
measures the ability of a method to correctly identify all behaviours as a whole. 268
Furthermore, to possibly improve the performance and/or minimise the variance of 269
behavioural inferences, we also relied on the "Ensemble Methods" [45,46], which consisted of 270
combining the results obtained with the five supervised machine learning algorithms. We 271
tested two such methods. The first was the "Voting Ensemble" (VE), which retained the most 272
frequently predicted behaviour. The second involved a "Weighted Sum" (WS), where weights 273
were given to the different predicted behaviours, based on "Precision" (weighting based on 274
Sensitivity and Specificity was also tested but gave poor results). In order to highlight the best 275
method to automatically identify the diving behaviours and particularly the feeding 276
behaviours, we used Anova to compare the mean global accuracy obtained for the 375 277
combinations of the seven classifiers (CART, SVL, LDA, RF, EGB, VE and WE). As the 278
result of the Anova showed significant effects, we ran pairwise comparisons of mean 279
performance using the Tukey HSD test. 280
Finally, the individual activity budgets were inferred by computing the proportion of 281
time involved in the various surface behaviours (“Breathing” and “Staying at the surface”) 282
inferred from depth data, and the proportion of time dedicated to diving behaviours 283
(“Feeding”, “Gliding”, “Other”, “Resting”, “Scratching”, and “Swimming”), inferred using 284
the best classifier (Fig. 3). The inferred activity budgets were compared to those observed in 285
video recordings. 286
3 Results 288
A total of 66.2 hours of video were recorded, with a maximum of 14.6 hours for one 289
individual (Table 1). The seven specific behavioural categories retained for the analysis 290
(“Breathing”, “Feeding”, “Gliding”, “Resting”, “Scratching”, “Staying at the surface” and 291
“Swimming”) represented 99% of the total duration. Only the two shortest deployments were 292
not associated with a feeding event while the maximum duration of feeding represented only 293
8% of the recording time of the individual. The catching of jellyfish was observed only 294
occasionally in three individuals. This behaviour represented only 0.1% of the total feeding 295
duration of the thirteen individuals, whilst the rest of the feeding time for those individuals 296
was used for grazing on seagrass. For the others, feeding consisted only of grazing on 297
seagrass. “Scratching” was particularly expressed by one turtle, and represented 13% of its 298
observed time. 299
The seven classifiers identified the five specific behavioural categories on which we 300
focused (“Feeding”, “Gliding”, “Resting”, “Scratching” and “Swimming”) and two additional 301
categories, “Transition” and “Other”, with an accuracy ranging from 0.91 to 0.95. The highest 302
score was obtained with WS and the lowest one with SVM. The Tuckey HSD test indicated 303
that the RF, VE and EGB outputs were not significantly different (0.935, 0.932 and 0.932, 304
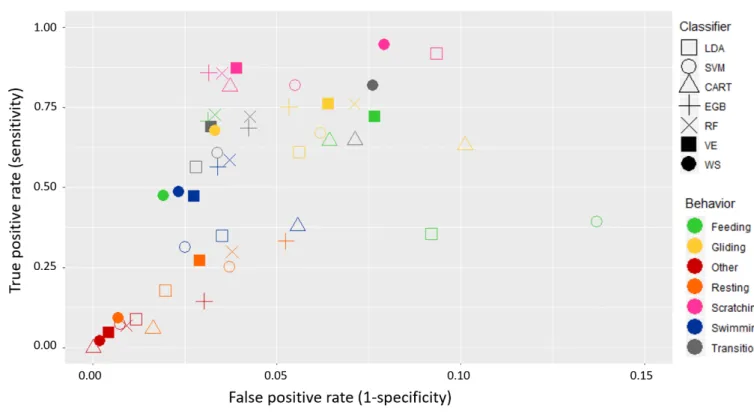
respectively). All classifiers identified the behavioural category with a low false positive rate 305
(< 0.1 for the best classifiers; Fig.4). Few segments were wrongly identified as “Feeding” 306
with the WS method, which thus obtained the lowest false positive rate (with respect to other 307
classifiers) for this behaviour. The best true positive rates, for the seven classifiers, were 308
obtained in the “Scratching” category despite its low occurrence in the dataset, meaning that 309
this behaviour was relatively well identified when it occurred. 310
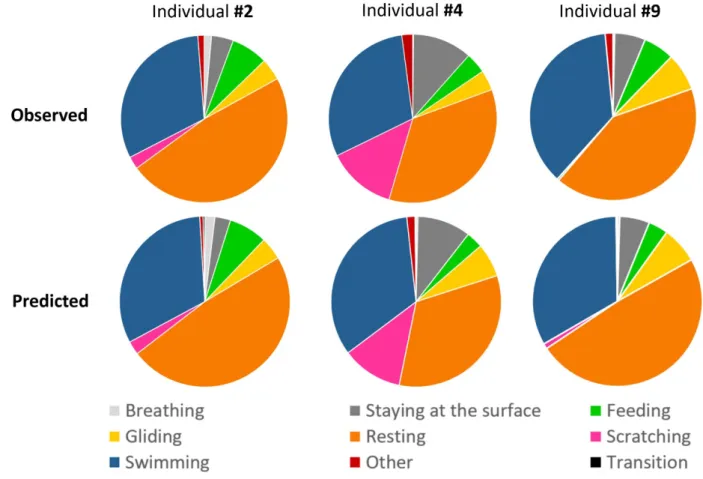
The activity budget, representing the percentage of the total mean time allocated to each 311
behavioural category, showed similar proportions between the predictions and the 312
observations (Fig. 5 & 6). This result highlights the ability of our method and the WS model 313
to predict the behaviours of immature green turtle in natural conditions. The main differences 314
between the observed and predicted activity budgets were seen in the “Resting” and 315
“Swimming” behaviours (Fig. 5 & 6). These differences were small and represented less than 316
3% of the total observed time (Table 2). “Feeding” and “Scratching” were under-represented 317
in our models and consequently their difference between predicted–actual time represent 318
roughly 1% of the total observed time. Their low expression for some individuals led to an 319
important percentage difference with respect to the observed time of the behaviour even if 320
they were predicted in small proportion. The results obtained for each individual are available 321
in supplementary material (Supplementary Material, Table S3). With a very low true positive 322
rate, the predicted time of “Transition” represented on average 0.2% of the total observation 323
time. Thus the overall procedure was able to reliably infer the seven mainly expressed 324
behaviours of the immature green turtles. 325
326
4 Discussion 327
This is the first study to validate the use of acceleration, gyroscope and TDR signals for 328
inferring free-ranging green turtle behaviours. In previous studies, carapace-mounted 329
accelerometers were used to describe swimming behaviours and buoyancy regulation in sea 330
turtles [19,20,47,48] in specific contexts where signals associated to “Swimming” and 331
“Gliding” could be visually identified, or were used to estimate sea turtle activity levels in 332
terms of DBA [18,49]. The possibility to rely on accelerometers and other carapace-mounted 333
sensors such as TDRs and gyroscopes to infer behaviours of free-ranging sea turtles had not 334
been explored in detail until now due to the lack of a validation process, which is critically 335
important for this kind of approach [50]. The validation process described in the present study 336
has enabled us to provide an overall procedure permitting the reliable inference of the seven 337
most commonly expressed behaviours of the free-ranging green turtle (namely “Breathing”, 338
“Feeding”, “Gliding”, “Resting”, “Scratching”, “Staying at the Surface” and “Swimming”), 339
and thus inferring the fine-scale activity budgets of animals whose populations are currently 340
under anthropogenic pressures which jeopardize their future [51,52]. This inference is 341
essential if we wish to compare how these animals allocate their time between different 342
activities according to natural and anthropogenic pressures such as available resources, 343
environmental changes or tourism. When combined with GPS data, this protocol could 344
identify the areas where sea turtles concentrate their activities and thus help to delineate 345
protected areas in order to limit human disturbances. 346
We tested seven classifiers (LDA, SVM, CART, RF, EGB, VE and WS) to compare 347
their strengths and weaknesses in automatic behavioural identification based on TDR, 348
acceleration and gyroscopic data. The classifiers identified the seven behavioural classes with 349
a global accuracy ranging from 0.91 to 0.95, which is comparable to the accuracy reached in 350
other similar studies [17,53,54]. The WS classifier performed better than the base and VE 351
classifiers: clearly, assigning precision-based weights to the base classifier’ predictions 352
improved the behavioural classification. The decrease we observed in the false positive rate 353
for rare behaviours through the use an ensemble method for "Feeding" in this study has also 354
been highlighted by Brewster et al. (2018) [37]. Ensemble methods are mainly used because 355
they reduce the variance of behaviour classification [53,55] and thus increase the global 356
accuracy. However, they involve a higher computational cost and require a reliable setting up 357
of base learners. 358
The use of supervised machine-learning has become common to automatically identify 359
behaviours from data provided by animal-borne loggers [17,50,56]. Indeed, the development 360
of fast personal computers and of free user-friendly computing libraries made it possible to 361
easily apply these ‘black box’ algorithms to huge amounts of data. The machine-learning 362
approach has thus turned out to be a very powerful tool for identifying well-characterized 363
behaviours (in terms of signal) such as locomotion [56–58] and resting [59–61]. However, it 364
appears to be rather inefficient when seeking to identify behaviours with confusing signal 365
characteristics. Examples include feeding and grooming in pumas [62], pecking in plovers 366
[63] or foraging in fur seals [64]. Although one could expect that feeding machine-learning 367
algorithms with big data should provide the most accurate predictive rules [16,65,66], Wilson 368
et al. (2018) [67] showed that a classification method based on a good understanding and 369
careful examination of the acceleration signal actually gives better results in terms of 370
computational time and of accuracy than non-optimized machine learning. Accordingly, the 371
mixed approach developed in this study fed machine-learning algorithms with a number of 372
derived signals which were specifically elaborated to pinpoint specific hard-to-detect 373
behaviours when alternative simpler means based on a single or a few parameters appeared to 374
be effective. This method allowed us to identify key behaviours such as feeding and 375
scratching, which had previously been either misidentified or not identified at all due to the 376
lack of discriminative signals in the raw data obtained from raw acceleration and/or 377
gyroscopic data obtained with loggers fixed to the carapace of the turtle. Although our choice 378
of derived signals makes our approach specific to sea turtles, this principle can be applied to 379
numerous species if the different signals are considered with care before the study. 380
When carrying out automatic behavioural identification from multi-sensor data using 381
supervised learning algorithms, one of the main difficulties is the segmentation of the multi-382
sensor data to obtain homogeneous segments that are representative of the various 383
behavioural categories. To date, most studies divided the multi-sensor data into segments 384
using fixed-time segments [68–70] or a sliding sample window with a fixed length [38,71]. 385
However, several studies testing the size of the window showed that it influences 386
classification accuracy and the identification of short behaviours [53,72–74]. Indeed, an 387
individual can express both short and long behaviours, such as burst swimming in lemon 388
sharks or a prey capture in Adélie penguins compared to normal swimming behaviour [37,75]. 389
Whilst the use of long fixed segments dramatically increases the proportion of 390
inhomogeneous segments, using short segments may prevent the detection of certain key 391
signals such as low-frequency oscillations. A hierarchical, adapted segmentation procedure 392
therefore seems to be a more judicious choice. This consists of splitting behaviours into 393
groups based on signals that are easily interpretable in a dichotomic way (variables such as 394
depth were used to attain this in our study). A change-point algorithm can be used to achieve 395
a more specific segmentation based on other signals, with a possible ad hoc adjustment of the 396
contrast is required to evaluate whether two successive values do or do not belong to the same 397
segment (such as the manual penalty of the PELT algorithm). In this paper, we demonstrate 398
this approach for the green turtle (Fig. 3, R-script in Supplementary Material), but there is no 399
reason it could not be easily adapted for other species. This will certainly necessitate the 400
identification of the optimal hyper-parameters as well as the informative signals for the 401
segmentation according to the species, but the approach of combining automated 402
segmentation and machine learning methods with well thought out descriptive variables 403
should apply as well. 404
The approach we proposed thus offers promising perspectives for inferring behaviours 405
of animals that cannot be easily observed in the wild though the automatic analysis of large 406
amounts of raw data acquired over long periods by miniaturised (low disturbance) loggers 407
such as high-frequency tri-axial accelerometers and gyroscopes. It provides a number of 408
adaptable principles that enable the efficient use of machine learning algorithms to 409
automatically identify fine-scale behaviours in sea turtles, and may be used for a wide range 410
of species. The automated and reliable identification of the various behaviours permits a rapid 411
inference of the time budget of the animals under study. Identifying how much time the 412
studied animals dedicate to activities such as feeding, travelling and resting can be of 413
relevance when seeking to understand how individuals attempt to maximise their fitness in a 414
given environment. This approach could therefore be a key tool in understanding the ecology 415
of endangered species and make a significant contribution to their conservation. 416
417
5 Data accessibility statement 418
The R-script to visualize the raw acceleration, gyroscope and depth profile associated with the 419
observed behaviours of the immature green turtles have been uploaded as part of the 420
supplementary material. The same is true for the R-script to automatically identify sea turtle 421
behaviour from the labelled data. The datasets containing the acceleration, gyroscope and 422
depth recordings of the 13 immature green turtles as well as their observed behaviours are 423
available within the Dryad Digital Repository: https://doi.org/10.5061/dryad.hhmgqnkd9. 424
URL for reviewer: 425 https://datadryad.org/stash/share/j3x2UusNTI1OWqLsJ1mUOq7wMm3t3PAGMzwAMuYM 426 FO0 427 428 6 Author contributions 429
DC, HD and SR contributed conception and design of the study. LJ, DC, JM, FS, JG, DE, 430
GH, AA, YLM, PL, SR, FL, NL, NA, CF, FV, ES, MB, FF, AB, CM, TM, MD, CG, SB and 431
AB contributed to data acquisition. LJ, SG and SB performed the data acceleration analysis 432
and LJ and VPB the statistical analysis. LJ wrote the first draft of the manuscript and SB, 433
VPB, FS and DC contributed critically to subsequent versions. 434
435
7 Funding 436
This study was co-financed by the FEDER Martinique (European Union, Conventions 437
2012/DEAL/0010/4-4/31882 & 2014/DEAL/0008/4-4/ 32947), DEAL Martinique 438
(Conventions 2012/DEAL/0010/4-4/31882 & 2014/DEAL/0008/4-4/32947), the ODE 439
Martinique (Convention 014-03-2015), the CNRS (Subvention Mission pour 440
l’Interdisciplinarité), the ERDF fund (Convention CNRS-EDF- juillet2013) and the Fondation 441
de France (Subvention Fondation Ars Cuttoli Paul Appell). Lorene Jeantet’s Ph.D scholarship 442
was supported by DEAL Guyane and CNES Guyane. 443
444
8 Acknowledgments 445
This study was carried out within the framework of the Plan National d'Action Tortues 446
Marines de Martinique et Guyane Française. The authors also appreciate the support of the 447
ANTIDOT project (Pépinière Interdisciplinaire Guyane, Mission pour l'Interdisciplinarité, 448
CNRS). The authors would like to thank the DEAL Martinique and Guyane, the CNES, the 449
ODE Martinique, the ONCFS Martinique and Guyane, the ONEMA Martinique and Guyane, 450
the SMPE Martinique and Guyane, the ONF Martinique, the PNR Martinique, the Surfrider 451
Foundation, Carbet des Sciences, Plongée-Passion, the Collège Cassien Sainte-Claire and the 452
Collège Petit Manoir for their technical support and field assistance. We are also grateful to 453
the numerous volunteers and free divers for their participation in the field operations. Results 454
obtained in this paper were computed on the vo.grand-est.fr virtual organization of the EGI 455
Infrastructure through IPHC resources. We thank EGI, France Grilles and the IPHC 456
Computing team for providing the technical support, computing and storage facilities. We are 457
also grateful to the three anonymous reviewers for their helpful corrections and comments. 458
459 460
9 References 461
1. Stephens DW, Krebs JR. 1987 Foraging Theory. Princeton University Press. 462
(doi:10.2307/2260475) 463
2. Stephens DW, Brown JS, Ydenberg RC. 2007 Foraging : behavior and ecology. 464
University of Chicago Press. 465
3. Colman LP, Sampaio CLS, Weber MI, de Castilhos JC. 2014 Diet of Olive Ridley Sea 466
Turtles, Lepidochelys olivacea, in the Waters of Sergipe, Brazil. Chelonian Conserv. 467
Biol. 13, 266–271. (doi:10.2744/CCB-1061.1) 468
4. Arthur K, O’Neil J, Limpus CJ, Abernathy K, Marshall G. 2007 Using animal-borne 469
imaging to assess green turtle (Chelonia mydas) foraging ecology in Moreton Bay, 470
Australia. Mar. Technol. 41, 9–13. 471
5. Wildermann NE, Barrios-Garrido H. 2013 First Report of Callinectes sapidus 472
(Decapoda: Portunidae) in the Diet of Lepidochelys olivacea . Chelonian Conserv. 473
Biol. 11, 265–268. (doi:10.2744/ccb-0934.1) 474
6. Lennox RJ et al. 2017 Envisioning the Future of Aquatic Animal Tracking: 475
Technology, Science, and Application. Bioscience 67, 884–896. 476
(doi:10.1093/biosci/bix098) 477
7. Hussey NE et al. 2015 Aquatic animal telemetry: A panoramic window into the 478
underwater world. Science (80-. ). 348, 1255642. (doi:10.1126/science.1255642) 479
8. Houghton JDR, Broderick AC, Godley BJ, Metcalfe JD, Hays GC. 2002 Diving 480
behaviour during the internesting interval for loggerhead turtles Caretta caretta nesting 481
in Cyprus. Mar. Ecol. Prog. Ser. 227, 63–70. (doi:10.3354/meps227063) 482
9. Chambault P, de Thoisy B, Kelle L, Berzins R, Bonola M, Delvaux H, Le Maho Y, 483
Chevallier D. 2016 Inter-nesting behavioural adjustments of green turtles to an 484
estuarine habitat in French Guiana. Mar. Ecol. Prog. Ser. 555, 235–248. 485
(doi:10.3354/meps11813) 486
10. Chambault P et al. 2016 The influence of oceanographic features on the foraging 487
behavior of the olive ridley sea turtle Lepidochelys olivacea along the Guiana coast. 488
Prog. Oceanogr. 142, 58–71. (doi:10.1016/j.pocean.2016.01.006) 489
11. Hays GC, Adams CR, Broderick AC, Godley BJ, Lucas DJ, Metcalfe JD, Prior AA. 490
1999 The diving behaviour of green turtles at Ascension Island. Anim. Behav. 59, 577– 491
586. (doi:10.1006/anbe.1999.1326) 492
12. Hochscheid S, Godley BJ, Broderick AC, Wilson RP. 1999 Reptilian diving: Highly 493
variable dive patterns in the green turtle Chelonia mydas. Mar. Ecol. Prog. Ser. 185, 494
101–112. (doi:10.3354/meps185101) 495
13. Seminoff JA, Jones TT, Marshall GJ. 2006 Underwater behaviour of green turtles 496
monitored with video-time-depth recorders: What’s missing from dive profiles? Mar. 497
Ecol. Prog. Ser. 322, 269–280. (doi:10.3354/meps322269) 498
14. Thomson JA, Heithaus MR, Dill LM. 2011 Informing the interpretation of dive profiles 499
using animal-borne video: A marine turtle case study. J. Exp. Mar. Bio. Ecol. 410, 12– 500
20. (doi:10.1016/j.jembe.2011.10.002) 501
15. Laich AGG, Wilson RP, Quintana F, Shepard ELC. 2010 Identification of imperial 502
cormorant Phalacrocorax atriceps behaviour using accelerometers. Endanger. Species 503
Res. 10, 29–37. (doi:10.3354/esr00091) 504
16. Graf PM, Wilson RP, Qasem L, Hackländer K, Rosell F. 2015 The use of acceleration 505
to code for animal behaviours; a case study in free-ranging Eurasian beavers Castor 506
fiber. PLoS One 10, 1–18. (doi:10.1371/journal.pone.0136751) 507
17. Nathan R, Spiegel O, Fortmann-Roe S, Harel R, Wikelski M, Getz WM. 2012 Using 508
tri-axial acceleration data to identify behavioral modes of free-ranging animals: general 509
concepts and tools illustrated for griffon vultures. J. Exp. Biol. 215, 986–96. 510
(doi:10.1242/jeb.058602) 511
18. Fossette S, Schofield G, Lilley MKS, Gleiss AC, Hays GC. 2012 Acceleration data 512
reveal the energy management strategy of a marine ectotherm during reproduction. 513
Funct. Ecol. 26, 324–333. (doi:10.1111/j.1365-2435.2011.01960.x) 514
19. Yasuda T, Arai N. 2009 Changes in flipper beat frequency, body angle and swimming 515
speed of female green turtles Chelonia mydas. Mar. Ecol. Prog. Ser. 386, 275–286. 516
(doi:10.3354/meps08084) 517
20. Fossette S, Gleiss AC, Myers AE, Garner S, Liebsch N, Whitney NM, Hays GC, 518
Wilson RP, Lutcavage ME. 2010 Behaviour and buoyancy regulation in the deepest-519
diving reptile: the leatherback turtle. J. Exp. Biol. 213, 4074–4083. 520
(doi:10.1242/jeb.048207) 521
21. Viviant M, Trites AW, Rosen DAS, Monestiez P. 2009 Prey capture attempts can be 522
detected in Steller sea lions and other marine predators using accelerometers. Polar 523
Biol. 33, 713–719. (doi:10.1007/s00300-009-0750-y) 524
22. Watanabe YY, Ito M, Takahashi A. 2014 Testing optimal foraging theory in a penguin-525
krill system. Proc. R. Soc. B Biol. Sci. 281. (doi:10.1098/rspb.2013.2376) 526
23. Gallon S, Bailleul F, Charrassin JB, Guinet C, Bost CA, Handrich Y, Hindell M. 2013 527
Identifying foraging events in deep diving southern elephant seals, Mirounga leonina, 528
using acceleration data loggers. Deep. Res. Part II Top. Stud. Oceanogr. 88–89, 14–22. 529
(doi:10.1016/j.dsr2.2012.09.002) 530
24. Fossette S, Gaspar P, Handrich Y, Maho Y Le, Georges JY. 2008 Dive and beak 531
movement patterns in leatherback turtles Dermochelys coriacea during internesting 532
intervals in French Guiana. J. Anim. Ecol. 77, 236–246. (doi:10.1111/j.1365-533
2656.2007.01344.x) 534
25. Hochscheid S, Maffucci F, Bentivegna F, Wilson RP. 2005 Gulps, wheezes, and sniffs: 535
How measurement of beak movement in sea turtles can elucidate their behaviour and 536
ecology. J. Exp. Mar. Bio. Ecol. 316, 45–53. (doi:10.1016/j.jembe.2004.10.004) 537
26. Myers AE, Hays GC. 2006 Do leatherback turtles Dermochelys coriacea forage during 538
the breeding season? A combination of data-logging devices provide new insights. 539
Mar. Ecol. Prog. Ser. 322, 259–267. (doi:10.3354/meps322259) 540
27. Okuyama J, Kawabata Y, Naito Y, Arai N, Kobayashi M. 2009 Monitoring beak 541
movements with an acceleration datalogger: A useful technique for assessing the 542
feeding and breathing behaviors of sea turtles. Endanger. Species Res. 543
(doi:10.3354/esr00215) 544
28. Okuyama J et al. 2013 Ethogram of Immature Green Turtles : Behavioral Strategies for 545
Somatic Growth in Large Marine Herbivores. PLoS One 8(6): e65783. 546
(doi:10.1371/journal.pone.0065783) 547
29. Wilson M, Tucker AD, Beedholm K, Mann DA. 2017 Changes of loggerhead turtle ( 548
Caretta caretta ) dive behavior associated with tropical storm passage during the inter-549
nesting period. J. Exp. Biol. 220, 3432–3441. (doi:10.1242/jeb.162644) 550
30. Tyson RB, Piniak WED, Domit C, Mann D, Hall M, Nowacek DP, Fuentes MMPB. 551
2017 Novel Bio-Logging Tool for Studying Fine-Scale Behaviors of Marine Turtles in 552
Response to Sound. Front. Mar. Sci. 4. (doi:10.3389/fmars.2017.00219) 553
31. Noda T, Okuyama J, Koizumi T, Arai N, Kobayashi M. 2012 Monitoring attitude and 554
dynamic acceleration of free-moving aquatic animals using a gyroscope. Aquat. Biol. 555
16, 265–276. (doi:10.3354/ab00448) 556
32. Nivière M et al. 2018 Identification of marine key areas across the Caribbean to ensure 557
the conservation of the critically endangered hawksbill turtle. Biol. Conserv. 223, 170– 558
180. (doi:10.1016/j.biocon.2018.05.002) 559
33. Geiger S. 2019 Package ‘rblt’. , 1–12. 560
34. Wilson RP et al. 2020 Estimates for energy expenditure in free-living animals using 561
acceleration proxies: A reappraisal. J. Anim. Ecol. 89, 161–172. (doi:10.1111/1365-562
2656.13040) 563
35. Killick R, Fearnhead P, Eckley IA. 2012 Optimal detection of changepoints with a 564
linear computational cost. J. Am. Stat. Assoc. 107, 1590–1598. 565
(doi:10.1080/01621459.2012.737745) 566
36. Reich KJ, Bjorndal KA, Bolten AB. 2007 The ‘lost years’ of green turtles: using stable 567
isotopes to study cryptic lifestages. Biol. Lett. 3, 712–714. 568
37. Brewster LR, Dale JJ, Guttridge TL, Gruber SH, Hansell AC, Elliott M, Cowx IG, 569
Whitney NM, Gleiss AC. 2018 Development and application of a machine learning 570
algorithm for classification of elasmobranch behaviour from accelerometry data. Mar. 571
Biol. 165, 62. (doi:10.1007/s00227-018-3318-y) 572
38. Ladds MA, Thompson AP, Slip DJ, Hocking DP, Harcourt RG. 2016 Seeing it all: 573
Evaluating supervised machine learning methods for the classification of diverse 574
otariid behaviours. PLoS One 11, 1–17. (doi:10.1371/journal.pone.0166898) 575
39. Therneau T, Atkinson B. 2018 rpart: Recursive Partitioning and Regression Trees. R 576
Packag. version 4.1-13. , https://CRAN.R-project.org/package=rpart. 577
40. Liaw A, Wiener M. 2002 Classification and Regression by randomForest. R news 2, 578
18–22. (doi:10.1177/154405910408300516) 579
41. Chen T et al. 2018 xgboost: Extreme Gradient Boosting. R Packag. version 0.71.2. , 580
https://CRAN.R-project.org/package=xgboost. 581
42. Meyer D, Dimitriadou E, Hornik K, Weingnessel A, Leisch F. 2017 e1071: Misc 582
Functions of the Department of Statistics, Probability Theory Group (Formerly: 583
E1071). R Packag. version 1.6-8 , https://CRAN.R-project.org/package=e1071. 584
43. Venables W, Ripley B. 2002 Modern Applied Statistics with S. Fourth. New York: 585
Springer. See http://www.stats.ox.ac.uk/pub/MASS4. 586
44. Japkowicz N. 2000 The Class Imbalance Problem: Significance and Strategies. In 587
Proceedings of the 2000 International Conference on Artificial Intelligence (IC-588
AI’2000): Special Track on Inductive Learning, Las Vegas, Nevada. 589
(doi:10.1.1.35.1693) 590
45. Opitz DW, Maclin R. 1999 Popular Ensemble Methods: An Empirical Study. J. Artif. 591
Intell. Res. 11, 169–198. (doi:10.1613/jair.614) 592
46. Rokach L. 2010 Ensemble-based classifiers. Artif. Intell. Rev. 33, 1–39. 593
(doi:10.1007/s10462-009-9124-7) 594
47. Hays GC, Marshall GJ, Seminoff JA. 2007 Flipper beat frequency and amplitude 595
changes in diving green turtles, Chelonia mydas. Mar. Biol. 150, 1003–1009. 596
(doi:10.1007/s00227-006-0412-3) 597
48. Okuyama J, Kataoka K, Kobayashi M, Abe O, Yoseda K, Arai N. 2012 The regularity 598
of dive performance in sea turtles: A new perspective from precise activity data. Anim. 599
Behav. 84, 349–359. (doi:10.1016/j.anbehav.2012.04.033) 600
49. Enstipp MR, Ballorain K, Ciccione S, Narazaki T, Sato K, Georges JY. 2016 Energy 601
expenditure of adult green turtles (Chelonia mydas) at their foraging grounds and 602
during simulated oceanic migration. Funct. Ecol. 30, 1810–1825. (doi:10.1111/1365-603
2435.12667) 604
50. Brown DD, Kays R, Wikelski M, Wilson R, Klimley AP. 2013 Observing the 605
unwatchable through acceleration logging of animal behavior. Anim. Biotelemetry 1, 606
20. (doi:10.1186/2050-3385-1-20) 607
51. Koch V, Nichols WJ, Peckham H, De La Toba V. 2006 Estimates of sea turtle 608
mortality from poaching and bycatch in Bahía Magdalena, Baja California Sur, 609
Mexico. Biol. Conserv. 128, 327–334. (doi:10.1016/j.biocon.2005.09.038) 610
52. Wallace BP, Kot CY, Dimatteo AD, Lee T, Crowder LB, Lewison RL. 2013 Impacts 611
of fisheries bycatch on marine turtle populations worldwide: Toward conservation and 612
research priorities. Ecosphere 4, 1–49. (doi:10.1890/ES12-00388.1) 613
53. Ladds MA, Thompson AP, Kadar JP, Slip D, Hocking D, Harcourt R. 2017 Super 614
machine learning: Improving accuracy and reducing variance of behaviour 615
classification from accelerometry. Anim. Biotelemetry 5, 1–10. (doi:10.1186/s40317-616
017-0123-1) 617
54. Ellis K, Godbole S, Marshall S, Lanckriet G, Staudenmayer J, Kerr J. 2014 Identifying 618
Active Travel Behaviors in Challenging Environments Using GPS, Accelerometers, 619
and Machine Learning Algorithms. Front. public Heal. 2, 36. 620
(doi:10.3389/fpubh.2014.00036) 621
55. Ali KM, Pazzani MJ. 1996 Error Reduction through Learning Multiple Descriptions. 622
Mach. Learn. 24, 173–202. 623
56. Resheff YS, Rotics S, Harel R, Spiegel O, Nathan R. 2014 AcceleRater: a web 624
application for supervised learning of behavioral modes from acceleration 625
measurements. Mov. Ecol. 2, 27. (doi:10.1186/s40462-014-0027-0) 626
57. Shepard ELC et al. 2008 Identification of animal movement patterns using tri-axial 627
accelerometry. Endanger. Species Res. 10, 47–60. (doi:10.3354/esr00084) 628
58. Yoda K, Sato K, Niizuma Y, Kurita M, Naito Y. 1999 Precise monitoring of 629
porpoising behaviour of Adélie penguins determined using acceleration data loggers. J. 630
Exp. Biol. 202, 3121–3126. 631
59. Moreau M, Siebert S, Buerkert A, Schlecht E. 2009 Use of a tri-axial accelerometer for 632
automated recording and classification of goats’ grazing behaviour. Appl. Anim. Behav. 633
Sci. 119, 158–170. (doi:10.1016/j.applanim.2009.04.008) 634
60. Jeantet L et al. 2018 Combined use of two supervised learning algorithms to model sea 635
turtle behaviours from tri-axial acceleration data. J. Exp. Biol. 221. 636
(doi:10.1242/jeb.177378) 637
61. Shuert CR, Pomeroy PP, Twiss SD. 2018 Assessing the utility and limitations of 638
accelerometers and machine learning approaches in classifying behaviour during 639
lactation in a phocid seal. Anim. Biotelemetry 6. (doi:10.1186/s40317-018-0158-y) 640
62. Wang Y, Nickel B, Rutishauser M, Bryce CM, Williams TM, Elkaim G, Wilmers CC. 641
2015 Movement, resting, and attack behaviors of wild pumas are revealed by tri-axial 642
accelerometer measurements. Mov. Ecol. 3, 1–12. (doi:10.1186/s40462-015-0030-0) 643
63. Bom RA, Bouten W, Piersma T, Oosterbeek K, van Gils JA. 2014 Optimizing 644
acceleration-based ethograms: The use of variable-time versus fixed-time 645
segmentation. Mov. Ecol. 2, 6. (doi:10.1186/2051-3933-2-6) 646
64. Ladds MA, Salton M, Hocking DP, McIntosh RR, Thompson AP, Slip DJ, Harcourt 647
RG. 2018 Using accelerometers to develop time-energy budgets of wild fur seals from 648
captive surrogates. PeerJ 6, e5814. (doi:10.7717/peerj.5814) 649
65. Bidder OR, Campbell HA, Gómez-Laich A, Urgé P, Walker J, Cai Y, Gao L, Quintana 650
F, Wilson RP. 2014 Love thy neighbour: Automatic animal behavioural classification 651
of acceleration data using the k-nearest neighbour algorithm. PLoS One 9. 652
(doi:10.1371/journal.pone.0088609) 653
66. Campbell HA, Gao L, Bidder OR, Hunter J, Franklin CE. 2013 Creating a behavioural 654
classification module for acceleration data: using a captive surrogate for difficult to 655
observe species. J. Exp. Biol. 216, 4501–6. (doi:10.1242/jeb.089805) 656
67. Wilson RP et al. 2018 Give the machine a hand: A Boolean time-based decision-tree 657
template for rapidly finding animal behaviours in multi-sensor data. Methods Ecol. 658
Evol. 2018, 1–10. (doi:10.1111/2041-210X.13069) 659
68. Lagarde F, Guillon M, Dubroca L, Bonnet X, Ben Kaddour K, Slimani T, El mouden 660
EH. 2008 Slowness and acceleration: a new method to quantify the activity budget of 661
chelonians. Anim. Behav. 75, 319–329. (doi:10.1016/j.anbehav.2007.01.010) 662
69. Martiskainen P, Järvinen M, Skön J-P, Tiirikainen J, Kolehmainen M, Mononen J. 663
2009 Cow behaviour pattern recognition using a three-dimensional accelerometer and 664
support vector machines. Appl. Anim. Behav. Sci. 119, 32–38. 665
(doi:10.1016/j.applanim.2009.03.005) 666
70. Shamoun-Baranes J et al. 2012 From sensor data to animal behaviour: An 667
oystercatcher example. PLoS One 7, e37997. (doi:10.1371/journal.pone.0037997) 668
71. McClune DW, Marks NJ, Wilson RP, Houghton JDR, Montgomery IW, McGowan 669
NE, Gormley E, Scantlebury M. 2014 Tri-axial accelerometers quantify behaviour in 670
the Eurasian badger (Meles meles): Towards an automated interpretation of field data. 671
Anim. Biotelemetry 2, 1–6. (doi:10.1186/2050-3385-2-5) 672
72. Lush L, Wilson RP, Holton MD, Hopkins P, Marsden KA, Chadwick DR, King AJ. 673
2018 Classification of sheep urination events using accelerometers to aid improved 674
measurements of livestock contributions to nitrous oxide emissions. Comput. Electron. 675
Agric. 150, 170–177. (doi:10.1016/j.compag.2018.04.018) 676
73. Robert B, White BJ, Renter DG, Larson RL. 2009 Evaluation of three-dimensional 677
accelerometers to monitor and classify behavior patterns in cattle. Comput. Electron. 678
Agric. 67, 80–84. (doi:10.1016/j.compag.2009.03.002) 679
74. Allik A, Pilt K, Karai D, Fridolin I, Leier M, Jervan G. 2019 Optimization of physical 680
activity recognition for real-timewearable systems: Effect ofwindow length, sampling 681
frequency and number of features. Appl. Sci. 9. (doi:10.3390/app9224833) 682
75. Watanabe YY, Takahashi A. 2013 Linking animal-borne video to accelerometers 683
reveals prey capture variability. Proc. Natl. Acad. Sci. U. S. A. 110, 2199–2204. 684
(doi:10.1073/pnas.1216244110) 685
76. Jeantet L. et al. 2020, Raw acceleration, gyroscope and depth profiles associated with 686
the observed behaviours of free-ranging immature green turtles in Martinique, v2, 687
Dryad, Dataset, https://doi.org/10.5061/dryad.hhmgqnkd9
688 689
10 Tables 690
691
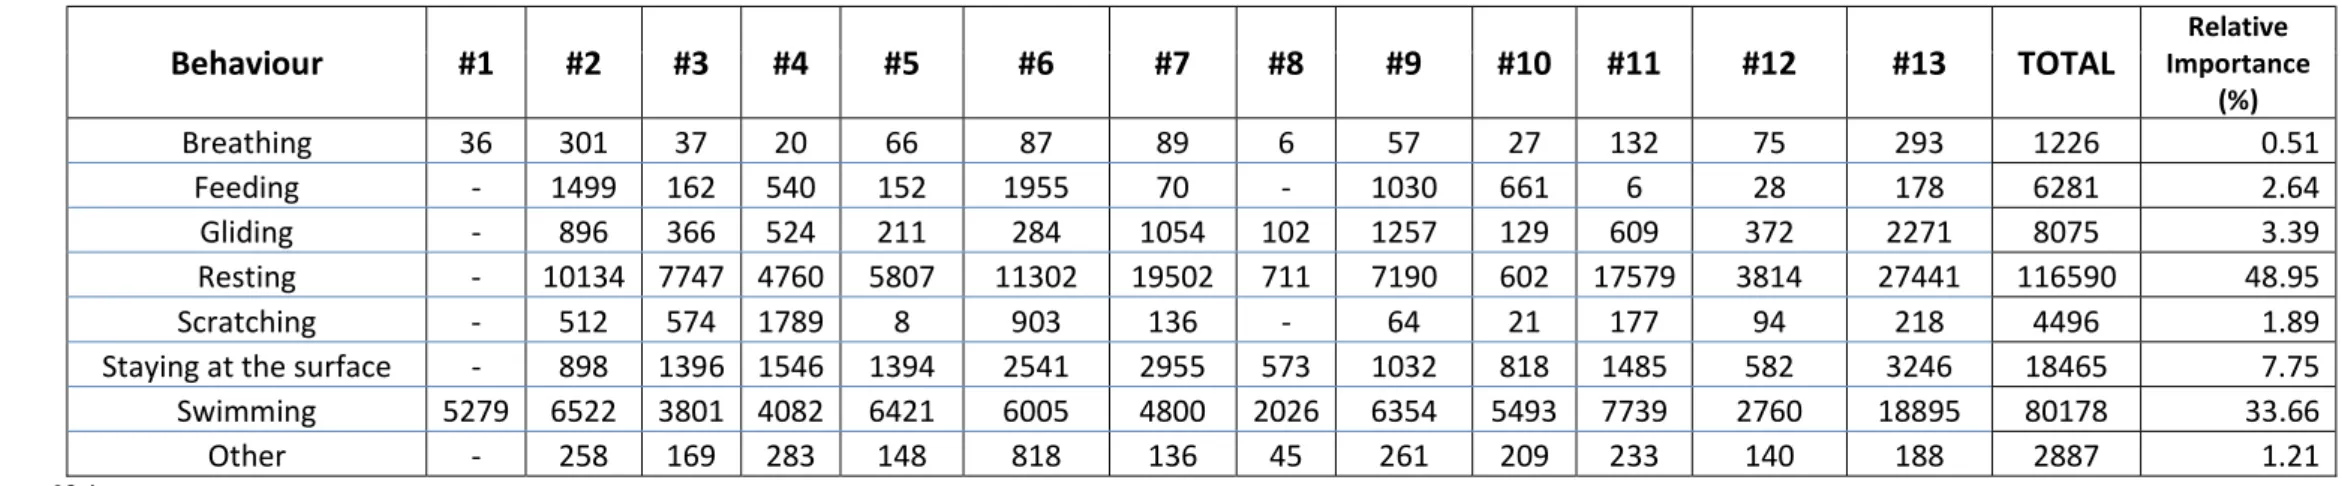
Table 1: Total duration (seconds) of the observed sequences of behavioural categories for the thirteen free-ranging immature green 692
turtles 693
694
Behaviour #1 #2 #3 #4 #5 #6 #7 #8 #9 #10 #11 #12 #13 TOTAL Importance Relative
(%) Breathing 36 301 37 20 66 87 89 6 57 27 132 75 293 1226 0.51 Feeding - 1499 162 540 152 1955 70 - 1030 661 6 28 178 6281 2.64 Gliding - 896 366 524 211 284 1054 102 1257 129 609 372 2271 8075 3.39 Resting - 10134 7747 4760 5807 11302 19502 711 7190 602 17579 3814 27441 116590 48.95 Scratching - 512 574 1789 8 903 136 - 64 21 177 94 218 4496 1.89
Staying at the surface - 898 1396 1546 1394 2541 2955 573 1032 818 1485 582 3246 18465 7.75 Swimming 5279 6522 3801 4082 6421 6005 4800 2026 6354 5493 7739 2760 18895 80178 33.66
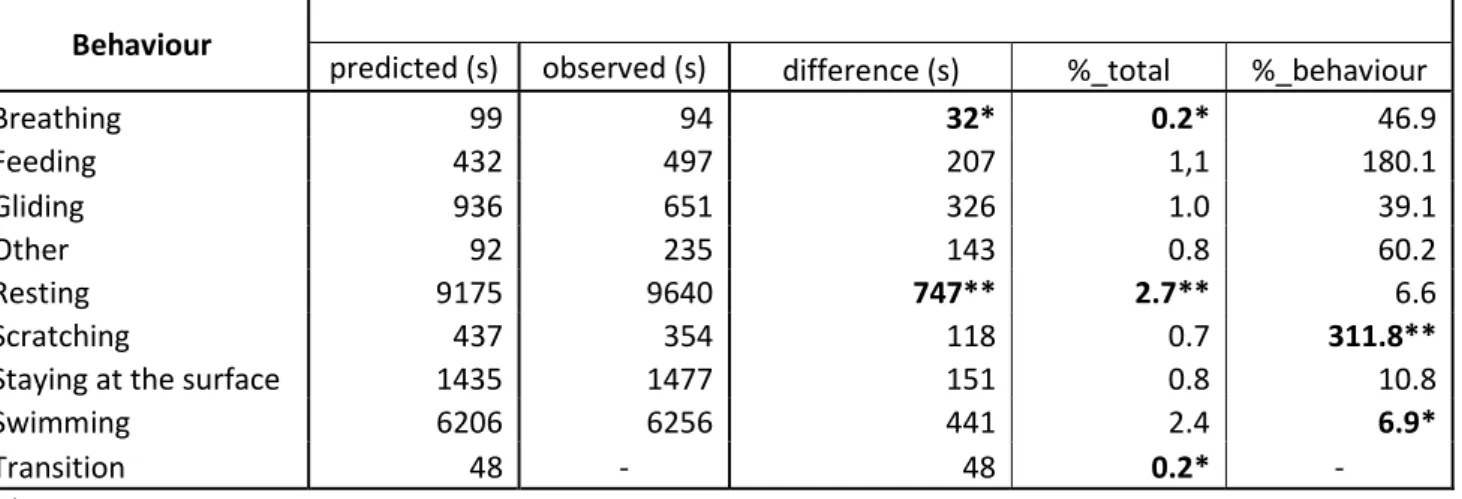
Table 2: Average duration of each behaviour shown by the 13 immature green turtles) 695
predicted time vs. observed time. The percentages are expressed with respect to the total 696
individual recorded video duration or to the time the behaviour in question was expressed. 697
The predicted durations of the diving behaviours were obtained using the WS method, and the 698
surfacing behaviours were predicted using depth values. 699
700
Behaviour
predicted (s) observed (s) difference (s) %_total %_behaviour
Breathing 99 94 32* 0.2* 46.9 Feeding 432 497 207 1,1 180.1 Gliding 936 651 326 1.0 39.1 Other 92 235 143 0.8 60.2 Resting 9175 9640 747** 2.7** 6.6 Scratching 437 354 118 0.7 311.8**
Staying at the surface 1435 1477 151 0.8 10.8
Swimming 6206 6256 441 2.4 6.9*
Transition 48 - 48 0.2* -
701
* The lowest difference obtained among the nine behavioural categories 702
** The highest difference obtained among the nine behavioural categories 703
705
11 Figures 706
707 708
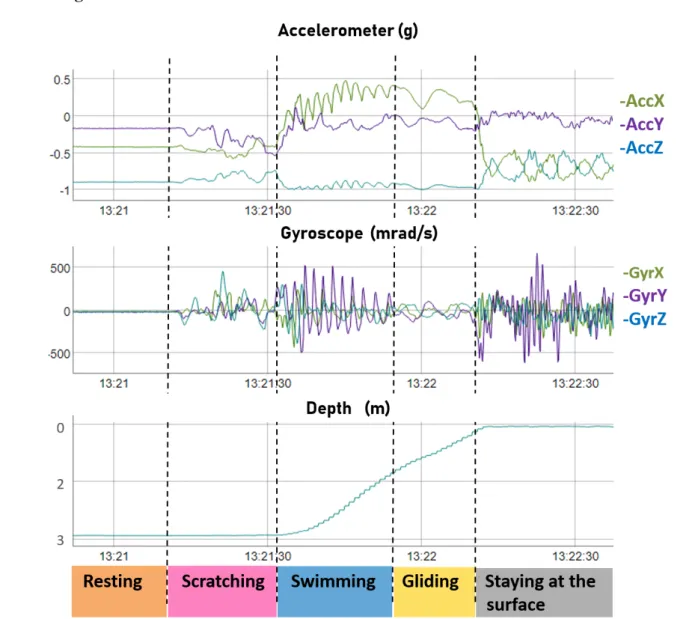
Figure 1. Raw acceleration, gyroscope and depth profiles for several behaviours 709
expressed by turtle #12. 710
712
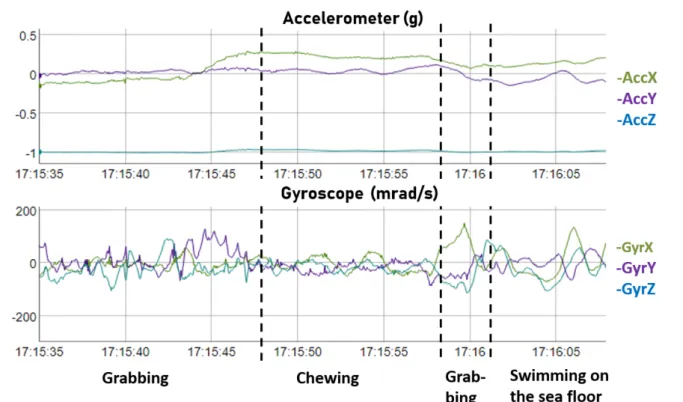
Figure 2: Raw acceleration and gyroscope signals obtained for the feeding behaviours 713
expressed by turtle #6. The definitions of the behaviours are available in Supplementary 714
Material (Table S2). 715
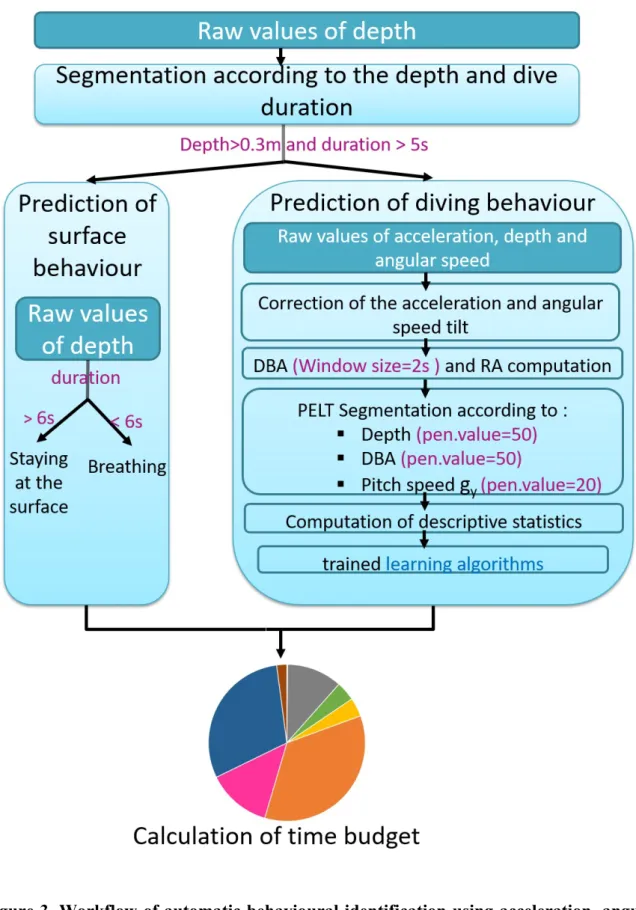
716
Figure 3. Workflow of automatic behavioural identification using acceleration, angular 717
speed and depth data, as adapted to the green turtle. The hyper-parameters set up 718
specifically for green turtle data are highlighted in purple. The application of this workflow 719
for other marine species would necessitate the identification of the optimal hyper-parameter 720
values for each species. 721
722 723
724 725
Figure 4. True positive rate vs. the false positive rate obtained with the seven classifiers 726
for the seven diving categories. The symbols show the mean values obtained from 371 727
combinations of splitting the sample of thirteen individuals into two sub-groups (one of nine 728
individuals for learning and one of four individuals for testing). 729
731
Figure 5. Pie chart of the observed (determined from the video) vs. predicted mean 732
durations of the various behaviours displayed by three free-ranging immature green 733
turtles. The predicted durations of the diving behaviours were obtained using the WS 734
classifier. 735
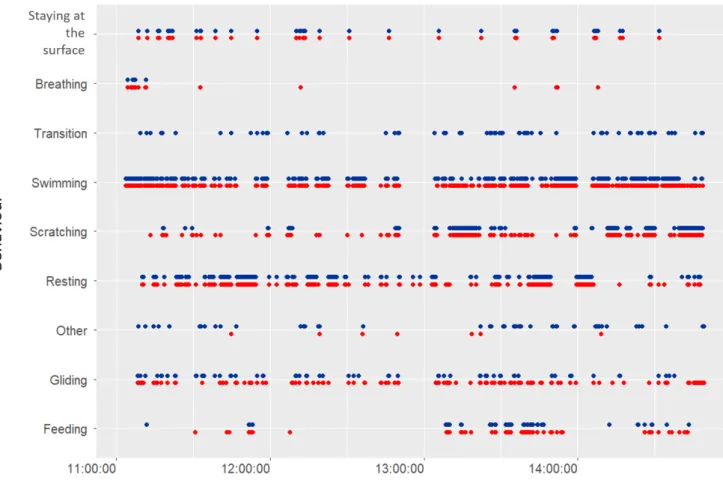
737 738
Figure 6. Comparison of the nine main inferred behavioural categories (in red) and of 739
the actually observed ones (in blue) for a few hours for immature green turtle #1. The 740
predicted occurrences of the diving behaviours were obtained using the WS classifier. 741 742 743 744 745 746 747 748 749 750 751 752 753