Connecting and Teaching Students via
Web Services for an Online Laboratory
by
Marc
Q.
Knight
Submitted to the Department of Electrical Engineering and Computer Science in Partial Fulfillment of the Requirements for the Degree of
Master of Engineering in Electrical Engineering and Computer Science at the
Massachusetts Institute of Technology
_May 21, 2003,
@2003 Marc Q. Knight. All rights reserved.
The author hereby grants to MIT permission to reproduc-and to distribute publicly paper reproduc-and electronic copies of this thesis document in whole or in part.
MASSACHUSETTS INSTITUTE OF TECHNOLOGY
JUL 3 0 2003
LIBRARIES
Department of Electrica) Engineering and Comp er Science
.. , 21 2003i Certified by: Accepted by: Chairman, 2~ I) IClark k. Colton hWs Supervisor N-4rthur C. Smith
Department Committee on Graduate Theses
BARKER
Author:
-Connecting and Teaching Students via Web
Services for an Online Laboratory
by
Marc
Q.
Knight
Submitted to the
Department of Electrical Engineering and Computer Science on May 21, 2003 in Partial Fulfillment of the
Requirements for the Degree of Master of Engineering in Electrical Engineering and Computer Science
Abstract
The I-Lab heat exchanger is a remotely controlled heat exchanger experiment that has been used on the Internet by students in a variety of chemical engineering courses. The hardware consists of a general service unit, custom designed and fabricated (HT-30XC, Armfield, Ltd., England), on which is mounted a heat exchanger (flat plate, shell-and-tube, or double pipe). Both fluid flowrates, their direction (cocurrent or countercurrent), and the inlet hot temperature are monitored and are under the control of the students. Monitoring and control is carried out with a computer/web server using LabVIEW 6.1 software (National Instruments, USA). Data is published to web-accessible LabVIEW graphical user interfaces (GUI) or via a DataSocket server to a Java2 GUI. A database (Microsoft SQL) and ASP.NET web forms are used for registering, authentication, and scheduling. The database is also used for collaboration management software (Java2). Student response has been favorable in general, and students appreciate the ability to take data from real equipment, especially in engineering science courses that otherwise
contain no laboratory component.
Thesis Supervisor: Clark K. Colton Title: Professor of Chemical Engineering
ACKNOWLEDGMENTS
First of all, I would like to thank God for providing me with the strength that has enabled me to make it this far in my life. Second of all, I would like to thank my parents, Bert and Shirley, for providing me with the inspiration and encouragement to continue working towards my masters.
My special thanks to Professor Clark Colton for enabling me to work on this project and for his guidance and supervision over the past year. Also, I would like to thank Dr. Dalzell who was always willing to lend a helping hand.
A lot of this work would not have been possible without Sarah Ibrahim, an exceptional UROP student working on the project. Amin Khan and Richard West, students who were responsible for the initial development of the system, were valuable resources when I encountered problems.
Additionally, I would like to thank John and Steve who were always there when I needed help with something in the lab. Finally, thanks to my family and friends who were
TABLE OF CONTENTS
I
INTRODUCTION ... 91.1 I-LABS AT M IT ... 9
1.2 MOTIVATION FOR THE I-LAB HEAT EXCHANGER PROJECT ... 10
1.3 PROBLEM STATEMENT ... 11
1.4 THESIS ROADMAP ... 12
2 I-LAB HEAT EXCHANGER OVERVIEW...13
2.1 EQUIPMENT DESCRIPTION ... 13
2.1.1 HT30XC Service Unit... 14
2.1.2 Heat Exchanger Types ... 17
2.2 COMPUTER CONTROL OF THE HEAT EXCHANGER ... 20
2.2.1 LabVIEW 6i ... 21
2.2.2 DataSocket Server ... 26
2.3 JAVA CLIENT INTERFACE ... 28
3 I-LAB HEAT EXCHANGER IMPROVEMENTS...29
3.1 COLLABORATION UTILITY ... 32 3.1.1 Client Application ... 33 3.1.2 Server Application... 35 3.2 LABVIEW 6.1 GUI ... 37 3.2.1 Parameter Controls... 39 3.2.2 Temperature Data ... 39
3.2.3 Flow Rate Data ... 40
3.2.4 Real-Time Data Table ... 40
3.3 PROCESS CONTROL ... 41
3.3.1 PID Control Overview ... 42
3.3.2 PID Tuning... 43
3.4 USER M ANAGEMENT SYSTEM ... 46
3.4.2 User Registration and Authentication...49 3.4.3 Team Management ... 51 3.4.4 Scheduling ... 53 3.4.5 Message Board ... 55 3.4.6 Assessment Questionnaire... 56 3.4.7 Administrator Features ... 58
3.5 REMOTE WATER RECYCLING ... 62
4 STUDENT FEEDBACK...65
4.1 10.302 (TRANSPORT PROCESSES) - FALL 2002 ... 66
4.1.1 Part One - Java Interface ... 66
4.1.2 Part Two - LabVIEW 6.1 Interface... 69
4.2 10.26 (CHEMICAL ENGINEERING PROJECTS LABORATORY) - SPRING 2003 ... 71
4.3 NOTABLE STUDENT SUGGESTIONS ... 74
5 CONCLUSION AND FUTURE IMPROVEMENTS...74
5.1 SUMMARY OF ACCOMPLISHMENTS...74
5.2 FUTURE WORK... 75
APPENDIX ...---...-- 78
LIST OF FIGURES
FIGURE 2-1: HT30XC SERVICE UNIT (A) SIDE VIEW (B) ToP VIEW ... 15
FIGURE 2-2: (A) DOUBLE-PIPE HEAT EXCHANGER MANUFACTURED BY ARMFIELD LTD., (B) SCHEMATIC DIAGRAM SHOWING COUNTERCURRENT FLOW ... 18
FIGURE 2-3: (A) SHELL AND TUBE HEAT EXCHANGER MANUFACTURED BY ARMFIELD LTD., (B) SCHEMATIC DIAGRAM SHOWING COUNTERCURRENT FLOW ... 19
FIGURE 2-4: (A) PLATE HEAT EXCHANGER MANUFACTURED BY ARMFIELD LTD, (B) SCHEMATIC DIAGRAM SHOWING COUNTERCURRENT FLOW ... 19
FIGURE 2-5: I-LAB HEAT EXCHANGER SCHEMATIC DIAGRAM ... 21
FIGURE 2-6: CALL LIBRARY FUNCTION BLOCK DIAGRAM... 22
FIGURE 2-7: CALL LIBRARY FUNCTION SETUP DIALOG BOX ... 23
FIGURE 2-8: LABVIEW USER GUI (SERVER CONTROL) ... 24
FIGURE 2-9: DATASOCKET WRITE VI... 27
FIGURE 2-10: DATASOCKET READ VI... 27
FIGURE 2-11: JAVA CLIENT INTERFACE (SPRING 2002) ... 29
FIGURE 3-1: I-LAB HEAT EXCHANGER SOFTWARE OVERVIEW: JANUARY 2002... 30
FIGURE 3-2: I-LAB HEAT EXCHANGER SOFTWARE OVERVIEW: JANUARY 2003 ... 32
FIGURE 3-3: JAVA CLIENT INTERFACE (FALL 2002)... 34
FIGURE 3-4: COLLABORATION SERVER ... 36
FIGURE 3-5: LABV IEW 6.1 G U I ... 38
FIGURE 3-6: LABVIEW 6.1 GUI DATA TABLE ... 41
FIGURE 3-7: OSCILLATION IN HOT WATER TEMPERATURE ... 44
FIGURE 3-8: RELATIONSHIP BETWEEN PBu, Tu AND FLOWRATE ... 45
FIGURE 3-9: LOGIN PAGE ... 50
FIGURE 3-10: USER REGISTRATION PAGE ... 50
FIGURE 3-11: EXPERIMENT HOMEPAGE ... 51
FIGURE 3-12: JOIN A TEAM ... 52
FIGURE 3-13: COURSES, TEAMS, & MEMBERS ... 53
FIGURE 3-14: CALENDAR OF USE... 54
FIGURE 3-16: M ESSAGE BOARD... ... ... 56
FIGURE 3-17: ASSESSMENT QUESTIONNAIRE ... 57
FIGURE 3-18: QUESTIONNAIRE RESULTS... 59
FIGURE 3-19: STUDENT COMMENTS... 59
FIGURE 3-20: MANAGE COURSES AND TEAMS... 60
FIGURE 3-21: EDIT TIMESLOTS ... 61
FIGURE 3-22: ALL REGISTERED USERS ... 62
FIGURE 3-23: ELECTRONICALLY CONTROLLED VALVES... 63
FIGURE 3-24: DATA ACQUISITION BOARD & CONNECTOR BLOCK ... 64
FIGURE 3-25: INTERFACE FOR REMOTE WATER RECYCLING ... 65
FIGURE 4-1: STUDENT ASSESSMENT OF I-LAB HEAT EXCHANGER: COMPARISON OF 10.302 (TRANSFER PROCESSES) IN FALL 2001 AND FALL 2002 USING THE JAVA 2 INTERFACE ... 68
FIGURE 4-2: STUDENT ASSESSMENT OF I-LAB HEAT EXCHANGER: COMPARISON OF EVALUATIONS IN DIFFERENT CLASSES... 73
LIST OF TABLES
TABLE 3-1: PID CONVERSION FACTORS ... 44
TABLE 4-1: 10.302 PART ONE QUESTIONNAIRE RESULTS ... 67
TABLE 4-2: 10.302 PART Two QUESTIONNAIRE RESULTS ... 70
1
INTRODUCTION
Web-accessible laboratory experiments are gaining popularity because they provide remote access to measurements with real equipment while making very efficient use of resources. More and more laboratories are becoming web-accessible as Internet technology is becoming more advanced. The need for these virtual labs fit perfectly into the modem methods of assembly, delivery, and access to educational technology resources adopted by educational institutions around the world.
The I-Campus initiative, a MIT-Microsoft collaborative project, is aimed at using information technology to improve education. One project in particular under the I-Campus umbrella, the Heat Exchanger Project, allows students to remotely control a heat transfer experiment for use in 10.302 and other chemical engineering courses.
1.1 I-LABS
ATMIT
The I-Lab Heat Exchanger Project (http://heatex.mit.edu) is one of several I-Labs under the I-Campus framework at MIT. Other I-Labs include:
" The Microelectronics Weblab (http://weblab.mit.edu)
" The Photovoltaic Weather Station (http://pvbase.mit.edu/index.html) * The Flagpole Remote Instrumentation Laboratory (http://flagpole.mit.edu) " The Polymer Crystallization I-Lab (http://fujicam.mit.edu/)
These online laboratories can be divided into three groups:
* Batched Experiment Laboratories: The Microelectronics Weblab is considered to be a batched experiment laboratory since it is a "load and go" experiment where initial parameters are chosen and data is returned immediately.
" Sensor Laboratories: The Photovoltaic Weather Station and the Flagpole
Remote Instrumentation Laboratory are considered to be sensor laboratories since they use a publish/subscribe architecture to stream data from their sensors over the web.
" Hybrid Laboratories: The Polymer Crystallization I-Lab and the I-Lab Heat Exchanger Project are examples of Hybrid Laboratories. They are a combination of a batched experiment and a sensor laboratory and can be thought of as multiple batched experiment and sensor labs taking place sequentially. For example, a user would first submit data to the server, which would be followed by results being returned from the sensors. Data submissions and updates from the sensors happen multiple times during the course of the experiment. In between data submissions, sensor data is streamed over the web.
These laboratories promote the goals of the I-Campus project at MIT, which are to: " Monitor real world systems
" Create an interface between engineering and information technology
" Develop an educational environment to provide higher learning for students * Investigate and implement advances in monitoring technology
* Effectively use virtual environments
1.2
MOTIVATION FOR THE I-LAB HEAT EXCHANGER PROJECTThe main objective of the I-Lab Heat Exchanger Project was to design and implement a real-time, robust and scaleable software system around a laboratory heat exchanger for
use in chemical engineering courses to provide students with:
" hands-on experience with a heat transfer experiment for them to compare measured characteristics with theoretical predictions and reflect on discrepancies, limitations, and design criteria.
The I-Lab Heat Exchanger project was designed to be different than a computer simulation and was intended to offer students an enhanced learning experience. On the heat exchanger website, there are numerous pictures of the equipment as well as a QuickTime movie describing its operation. However, when operating the heat exchanger, students sometimes experience unexpected behavior. Furthermore, performing the experiment two separate times with identical parameters will not produce exactly the same results. This unpredictability provides students with a great learning experience, but also makes designing a robust and reliable system more difficult.
1.3
PROBLEM STATEMENTAfter the initial implementation of the software system was completed in the spring of 2002, system development has been driven by student suggestions and properties of the equipment. First, the durability of the equipment made it infeasible to have it running 24 hours a day, 7 days a week. The hot water pump only has a lifetime of a couple thousand hours, and the water in the hot water reservoir needs daily recycling to avoid evaporation and fouling. Second, control of the equipment needed to be improved. Students complained when the flowrates and temperatures took a long time to reach steady state, or never reached steady state at all. Third, students complained that the experiment was similar to a simulation and did not know what the equipment looked like, despite the information being available on the webpage.
To reduce wear and tear on the equipment, we decided that students collaborating in teams could perform the experiment. Performing experiments in teams could have the result of enhancing the learning experience for the students. To support this new, team based approach, additional features had to be added to the existing interface and the project website.
These new features would include of a collaboration utility that contained a chat window and a "Pass the Token" capability to determine which student would have control of the equipment. The web services provided at http://heatex.mit.edu needed a new registration and signup system that would allow students to be assigned to teams. The website could also include a message board and a live pictures of the equipment.
To address student complaints regarding flowrate and temperature control, we needed to obtain optimal parameters for each of the flowrate and temperature controllers. These parameters were needed for each of the three heat exchanger types (flat plate, shell and tube, or double pipe) in each of the two flow configurations (cocurrent and countercurrent). Additionally, to further differentiate the experiment from a simulation, developing a new interface using LabVIEW 6.1 could be explored.
Furthermore, to make the heat exchanger continuously accessible over a period of several days, there needed to be a method to recycle the water in the hot water reservoir remotely.
These improvements are discussed in the upcoming sections of the thesis.
1.4 THEsIs ROADMAP
The purpose of this thesis is two-fold. First, to serve as documentation for the I-Lab Heat Exchanger Project, and second, to explain the details of how these improvements were implemented.
Chapter 2 gives an overview of the I-Lab Heat Exchanger Project as it stood in the spring of 2002, before improvements were made. First, it describes the three heat exchanger types and the service unit on which they are mounted. Second, it describes the USB interface and DLL file used to control the service unit. Furthermore, it describes the use of LabVIEW and Java to develop interfaces for the Heat Exchanger.
Chapter 3 describes all the improvements made to the I-Lab Heat Exchanger during the past year. It describes the implementation of the collaboration capability and the usage of LabVIEW 6.1 to create a new client interface. Furthermore, it gives an overview of the I-Lab Heat Exchanger website and the new web services that were implemented. Finally, it describes how optimal process control parameters were obtained for the various heat exchanger types and how recycling the water in the hot water reservoir can be done remotely.
Chapter 4 summarizes student feedback about the I-Lab Heat Exchanger. Students in MIT courses 10.302 (Transport Processes) and 10.26 (Chemical Engineering Projects Laboratory) performed different experiments on the heat exchanger during Fall 2002 and
Spring 2003, respectively.
Chapter 5 concludes the thesis with a discussion on lessons learned and future work
2
I-LAB HEAT ExCHANGER OVERVIEW
2.1
EQUIPMENT DESCRIPTIONWe have worked with Armfield Ltd. (Hampshire, England) to develop a remotely controlled experiment. Armfield markets a range of small-scale heat exchangers that represent the common types found in industry for indirect transfer of heat from one fluid stream to another. We acquired three heat exchangers, double-pipe or tubular (HT31), flat plate (HT32) and shell-and-tube (HT33) and one service unit (HT30XC), which was modified by Armfield for remote control by a computer. The majority of information contained in this section has been borrowed from the Armfield Manual for the HT30XC service unit [2], and a previous thesis about the I-Lab Heat Exchanger Project [4]. Details on these three heat exchanger types will be discussed in Section 2.1.2.
2.1.1
HT30XC SERVICE UNITThe service unit (HT30XC) is a bench-top apparatus on which one of the heat exchangers may be mounted. The service unit provides the necessary services and measurement facilities for investigation and comparison of the different heat exchanger working principles and operating characteristics. These services include providing streams of hot water (heating fluid) and cold water (process fluid) at variable flowrates to the heat exchanger under evaluation. The service unit can also control flow direction by operating in either cocurrent or countercurrent mode. The ability to change the type of exchanger quickly, without the use of tools, and the fast response of the system under optimal control to changes in water flow rate or temperature allow the steady-state experiments to be carried out in a relatively short period of time.
The HT30XC is connected to the computer through a universal serial bus (USB) port and comes equipped with a software driver for the Windows operating system. It is designed to operate from a Windows computer, and all the parameters are computer controlled with no manual intervention other than setting the equipment up and switching it on.
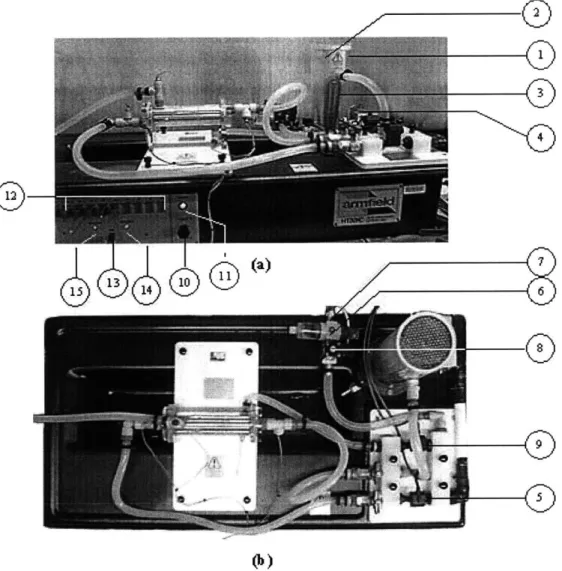
The service unit is equipped with a standard mounting arrangement and service connections for any one of the interchangeable heat exchangers. Figure 2-1 shows several views of the HT30XC Service Unit. The figure shows the HT33 type Shell-and Tube Heat Exchanger with 4 thermocouple sensors mounted on the service unit.
Below are descriptions of the service unit's key components:
1. Hot Water Reservoir: This reservoir (1) is situated on top of the service unit. The water in this reservoir is electrically heated. The heating element incorporates an over-temperature thermostat that prevents the water being heated beyond a nominal 85 'C.
Also in the hot water reservoir is a conductivity level sensor (2) that prevents either the heater or pump being turned on unless the reservoir is sufficiently full of water.
(b)
Figure 2-1: HT30XC Service Unit (a) Side View (b) Top View
2. Heater: The electric supply to the heater (3) is modulated by a solid state relay (SSR) which is located inside the plinth base. The modulation signals to the SSR are provided directly by the computer, via the USB interface. This modulation signal is transmitted through a digital channel, which means that the only values that can be passed are 0(heater off) and 1(heater on). This requires the need for a PID algorithm (see Section 3.3) in the controlling software in order to keep the hot fluid inlet temperature steady.
3. Pump and Flow meter: Mounted by the side of the hot water reservoir is the gear pump (4), driven by an electric motor, which is used to circulate the water through the heat exchanger and back to the reservoir. The rotational speeds of the motor/gear pump, and hence the hot water flow rate can be controlled from the computer. The hot water flow rate is measured by the in-line flow meter (5) and displayed on the computer. The hot water system includes a strainer on each side of the flow meter, contained within the acrylic mounting blocks. These strainers protect the delicate paddle wheel mechanism of the flow meter from any particles, dirt, hair etc., which may find their way into the water.
Using the computer to control a changeover relay mounted in the plinth base can change the direction of rotation of the pump. This relay reverses the polarity of the electrical voltage applied to the motor, producing a cocurrent or a countercurrent flow.
4. Cold water pressure regulator: The cold water flow (the process flow) for the heat exchanger is derived from the local tap water supply. A pressure regulator (6) complete with integral filter/strainer isolates the HT30XC from the minor variations in the pressure of this supply. The cold water supply is connected to the inlet (7) of the pressure regulator. The flow rate through the heat exchanger is then controlled using an electronically driven proportioning solenoid valve (8). Again, this valve is controlled from the computer. A second in-line flow meter (9) measures the cold flow rate.
5. Flexible tubes: Flexible tubes are used to connect the circulator to each heat exchanger and quick release fittings allow rapid connection. Red collars identify the hot water connections and a blue collar identifies the cold water connection.
6. Others: A panel on the front of the Service unit contains the 'Standby/Enable' switch (10) with 'Control' indicator (11), the 'Emergency Stop' switch with 'Process' indicator and input connectors (12) for up to 10 standard 'k' type thermocouples, labeled Ti to T1O. The thermocouples are supplied with the individual heat exchangers and appropriately connected and marked. Also mounted on the panel is the connector (13)
for the USB interface for connection to the computer, and two USB status indicators. A red 'power' LED (14) lights when the unit is connected to the PC and a green 'active' LED (15) lights when the unit has been recognized by the PC. The USB interface is located behind the front panel.
2.1.2 HEAT EXCHANGER TYPES
2.1.2.1 BACKGROUND
Heat exchangers are typically classified according to flow arrangements and type of construction.
There are two types of flow arrangements available
" parallel-flow or cocurrent: hot and cold fluid flow in the same directions " counterflow or countercurrent: hot and cold fluid flow in opposite directions
Several types of heat exchangers are available according to type of construction. Some common types are [3]:
" Concentric tube or double-pipe " Shell-and-tube
" Flat plate
The HT30XC is able to support all three heat exchanger types and comes with quick disconnect pipe fittings so different exchangers can be connected to the system easily.
2.1.2.2
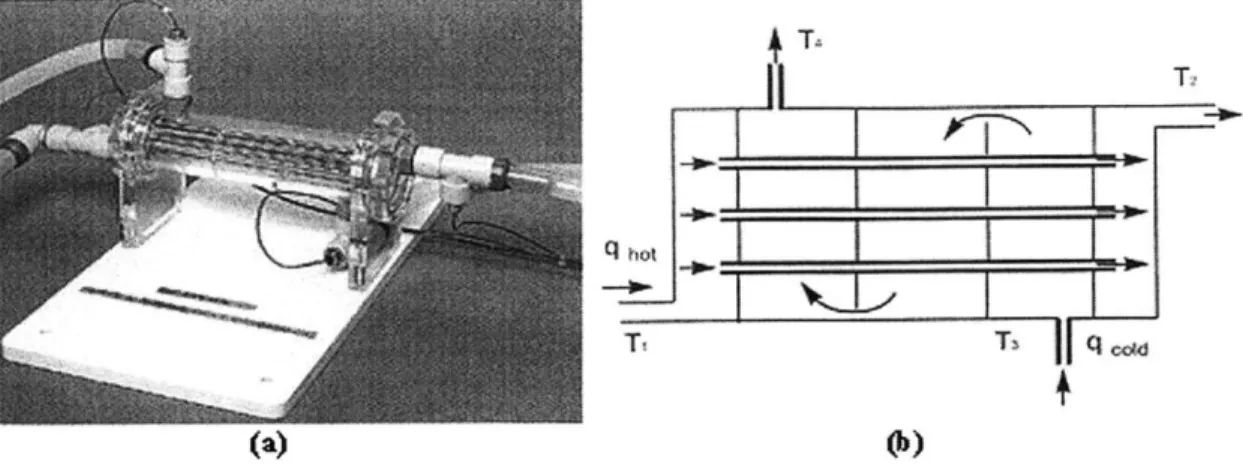
CONCENTRIC TUBE OR DOUBLE-PIPE HEAT EXCHANGERThis is the simplest type of heat exchanger, which has a long, small-diameter tube placed concentrically within a larger tube (Figure 2-2). One fluid passes through the inner tube,
and the other fluid passes through the outer tube. This type of heat exchanger is capable of handling high pressures and wide temperature differences, but it provides rather poor thermal performance because of a small heat-transfer area.
TI
4 T4
(b)
Figure 2-2: (a) Double-pipe heat exchanger manufactured by Armfield Ltd., (b) Schematic diagram showing countercurrent flow
2.1.2.3 SHELL AND TUBE HEAT ExCHANGER
Shell and tube heat exchangers (Figure 2-3) consist of a bundle of parallel tubes that provide the heat transfer surface separating two fluid streams. The tube-side fluid passes axially through the inside of the tubes; the shell side fluid passes over the outside of the tubes. Specific forms differ according to the number of shell-and-tube passes, and the simplest form, involves single tube and shell passes. Baffles external and perpendicular to the tubes are usually installed to direct the flow across the tubes, to provide tube support and also to increase the convection coefficient of the shell-side fluid by inducing turbulence and a cross-flow velocity component. The thermal performance of such an exchanger usually surpasses a tubular type but is less than a plate type. The pressure capability of shell-and-tube exchangers is generally higher than a plate type but lower than a tubular type.
+T.
(a)(b
Figure 2-3: (a) Shell and tube heat exchanger manufactured by Armfield Ltd., (b) Schematic diagram showing countercurrent flow
2.1.2.4 PLATE HEAT ExCHANGER
Plate heat exchangers (Figure 2-4) consist of a stack of parallel thin plates that lie between heavy end plates. Each fluid stream passes alternately between adjoining plates in the stack, exchanging heat through the plates. The plates are corrugated for strength and to enhance heat transfer by directing the flow and increasing turbulence. These exchangers have high heat-transfer coefficients and area, the pressure drop is also typically low, and they often provide very high effectiveness. However, they have relatively low pressure capability.
(a) (b)
Figure 2-4: (a) Plate heat exchanger manufactured by Armfield Ltd, (b) Schematic diagram showing countercurrent flow
2.2 COMPUTER CONTROL OF THE HEAT ExCHANGER
In order for the heat exchanger to be web-accessible, there needed to be a bridge between the HT30XC service unit and the server. The HT30XC service unit comes equipped with a USB cable and software for controlling the exchanger and for monitoring temperatures from a PC. This software uses a Dynamic Link Library file (DLL) driver, allowing access to one or more particular functions from the controlling program.
The DLL file provides a means to access the input and output parameters of the HT30XC service unit, and is critical for system development since the bundled software package is not designed for web-based control of the unit. If web-based control of the heat exchanger were to be offered, new software would have to be developed that utilized the functions already contained in the DLL file.
Figure 2-5 is a schematic diagram of the heat exchanger flow circuit on the service unit and its interaction with computer software for monitoring and control. The single pass cold water stream is controlled by a pressure regulator, and the recirculated hot water stream is controlled by a bi-directional gear pump that allows the exchanger to be configured for cocurrent or countercurrent operation. Four k-type thermocouples monitor the inlet and outlet temperatures of the hot and cold water streams. There are also two flowmeters that measure the flowrates of the hot and cold water streams. The thermocouples, flowmeters, pressure regulator, and pump all interface with the computer via the software driver. Additionally, feedback mechanisms use input from the thermocouples and flowmeters to control the flowrates and the inlet hot water temperature by heating in the hot water reservoir.
Computer Cold W erPressure Qc Regulator Tj _iTho Hot Water Heat Resevoir -Exchanger Heater Waste r Gear Pump Figure 2-5: I-Lab Heat Exchanger Schematic Diagram
2.2.1
LABVIEW 6i
To utilize the functions in the DLL file, the LabVIEW programming language and DataSocket server [7] were used. This enabled data and commands to be transmitted and
received via the web.
LabVIEW 6i is a graphical programming language developed by National Instruments that is designed for faster development of programs. The DataSocket server is another product by National Instrumen that allows a program to publish and subscribe to data via a specific URI (Universal Resource Indicator), thus making the data web accessible. More detail on the DataSocket server is contained in Section 2.2.2.
In LabVIEW, block diagrams or VIs (Virtual Instruments) are used to develop a Graphical User Interface (GUI) to monitor and control parameters. This programming language contains a very large library of Graphical Instrument control tools, such as knobs, dials, and charts, which make creating user GUIs very easy. It also has built in functions that allow for easy use of the DLL file for the HT30XC service unit. In LabVIEW, this is accomplished via the Call Library Function, which can provide access
to a particular function in a specified DLL. The Call Library Function block diagram is shown in Figure 2-6. The column on the left corresponds to the function inputs, while the column on the right corresponds to the function outputs. The component labeled Value is an indicator so that the value returned by the function will display on the GUI front panel. Through the use of this function and the DLL file, the LabVIEW software is able to read from and write to both the analog and digital channels of the HT30XC service unit. Analog channels are used for transmitting temperature and flowrate data whereas digital channels are used to turn on and enable the service unit.
Figure 2-6: Call Library Function Block Diagram
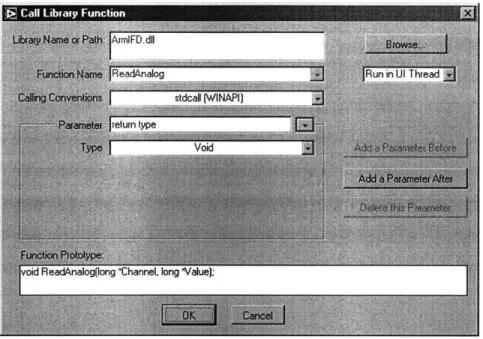
Figure 2-7 shows the call library function setup dialog box. Of interest are the Library Name and Function Prototype fields. In the Library Name field, we are able to specify the .dll file that contains the function we wish to use; in this case ArmIFD.dll. The Function Prototype field contains the syntax for the function that we wish to use. In this case, we are trying to read one of the analog data channels coming from the heat exchanger and display the result in an indicator named Value. The heat exchanger has 15 analog channels that can be used to monitor the temperature at any one of the thermocouples or the flowrate at any of the two flowmeters.
Figure 2-7: Call Library Function Setup Dialog Box
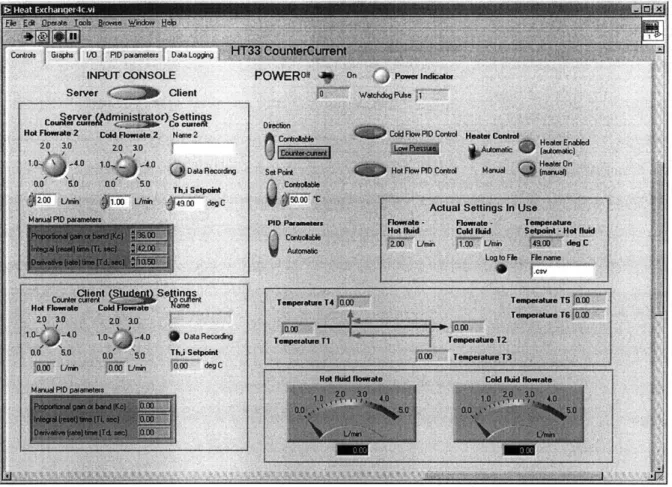
After using the call library functions to interface with the heat exchanger, the remainder of the user GUI was developed using other LabVIEW control tools. The LabVIEW Instrument Panel is designed to act as a server-side application to control the heat exchanger. Through the use of a sliding control, the user can relinquish control and give control to a client computer via the DataSocket server. The complete LabVIEW interface is shown in Figure 2-8.
The Controls page contains all the controls and indicators to pass values to the equipment and from the equipment through the USB connection. The Power switch on the top turns the equipment on or off. The Power Indicator lights up when the equipment is turned on.
On the left side of the panel is the Input Console. At the top is a switch that switches the control of the equipment between the Administrator (Server) and the user (Client). When in client mode, the Server Administrator doesn't have any control over the parameter values passed to the equipment.
Figure 2-8: LabVIEW User GUI (Server Control)
In client mode, the software listens to particular DataSocket addresses (described in Section 2.2.2) for values of these parameters and passes the values to the equipment as they become available. While in Server mode, the client machines cannot change the parameter values. The values can only be changed from the server. The controllable parameters can be divided into two groups:
Primary controls -parameter values that are sent directly to the equipment " The flow direction (Countercurrent or Cocurrent)
* Hot fluid flowrate: Varying the speed of the pump controls the flowrate of the hot fluid stream. This is done by accessing one of the channels through an Analog Output function call to the .dll.
* Cold fluid flowrate: Controlling a valve using an Analog Output function call regulates the flowrate of the cold fluid stream.
* Heater Control: The heater in the hot water reservoir can only be turned on or off. This heater is used to control the temperature of the hot fluid stream. Although this is a direct control parameter, it is controlled from within the PID (proportional-integral-derivative) algorithm. This is discussed in depth in Section 3.3.
Secondary controls - control parameters that are processed within the software and depending on the output, either send a value to the equipment, or perform some other operation.
" Temperature Setpoint: Controlling the heater determines the hot water inlet temperature of the equipment. The heater can only be turned on or off. As a result, a PID algorithm that determines how much of the time the heater is turned on or off was implemented. The algorithm looks backwards in time five seconds and then depending on the PID values, the setpoint value, and the current thermocouple reading at the hot water inlet (received from the equipment), determines the percentage of time during the interval the heater is to be turned on. This keeps the temperature in the hot water reservoir steady. " PID (Proportional-Integral-Derivative) parameters: These are the parameters
used in the PID algorithm to compute how much of the time the heater is turned on or off.
* Data Recording: This consists of a text box to input the filename and a data recording button. The software creates a file with the same name at a location on the server. When the button is pressed, data recording starts and when the button is pushed again, data recording stops.
On the right side of the Controls panel are the parameter values that are passed to the equipment. The administrator can also give limited control capability to the students by disabling some of the controls. This can be done using the selector switches in the middle of the panel. The switches labeled "Direction", "Setpoint", and "PID parameters" can be set to either Controllable or Automatic, depending on the scope of the experiment. If a control is set to Automatic, the corresponding control on the client applet becomes gray.
Shown at the bottom right part of the panel are the actual temperature and flowrate values. The temperature values are received from thermocouples mounted at different flow locations. For the flat plate HT32 and the shell-and-tube HT33 heat exchanger, the thermocouple locations are:
" Hot fluid inlet (TI) * Hot fluid outlet (T2) " Cold fluid inlet (T3) " Cold fluid outlet (T4)
These are the four standard thermocouple and temperature readings received from the equipment. For the double pipe HT31 heat exchanger, two additional thermocouples are located at the midpoint between two sections (Hot fluid midpoint, T5; Cold fluid midpoint, T6). The HT30XC service unit can support a maximum of 10 thermocouples. The flowrate values are received from the two flow meters mounted in the two flow streams with a maximum of 5 IJmin. Both the temperature and flowrate readings are accessed through the use of Analog Input function calls.
2.2.2 DATASOCKET SERVER
The DataSocket server is a software product developed by National Instruments that enables real-time sharing of data among a variety of software clients developed in different programming languages.
The DataSocket server uses a publish-subscribe model to share the data. The server publishes real-time data to the Internet at a specific address via a dstp protocol (Data Sockets Transfer Protocol). Each data point binds to a specific URI (with a prefix dstp://).
In our case, the LabVIEW GUI sends data to the URIs, and the client Java interfaces subscribe to the server using these specific data addresses and listen for updates. On the
other hand, a Java interface can also publish parameter control values to the DataSocket server while the LabVIEW software listens for updates. Both of these situations occur in order to provide proper control via the Java Interface.
2.2.2.1
PUBLISHING AND RECEIVING DATA IN LABVIEWPublishing data to the Internet using the DataSocket server from LabVIEW is made very simple in LabVIEW 6i. LabVIiEW provides two functions that interface with the DataSocket server: one to read data, and another to write data.
Figure 2-9 shows the DataSocket Write VI. Data is wired to the data parameter in the VI and a string constant specifies the URL parameter. The URL in this case corresponds to the DataSocket URI (with a prefix dstp: / /).
URL - duplicate URL
data
error in error out Figure 2-9: DataSocket Write VI
The DataSocket Read VI is shown in Figure 2-10. A string constant specifies the URL parameter. The URL is the address from where the data is read and its type is specified by the type parameter. The VI will wait for an updated value when the parameter wait
for updated value is set to True. The ms timeout parameter specifies how long to wait for
a value update.
URL duplicate URL
type (Variant) ... data
ms timeout (10000) . timed out
error in error out
wait for updated value (T) ...
2.3 JAVA CLIENT INTERFACE
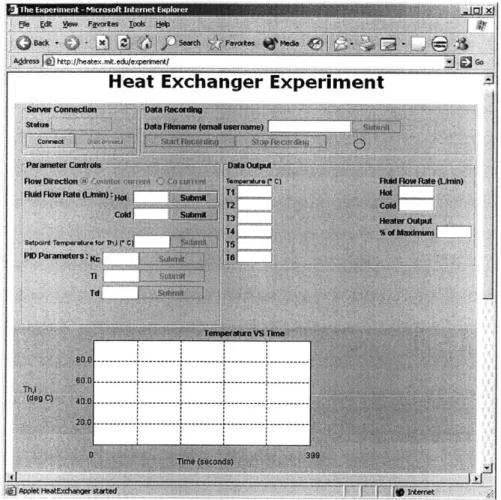
The Java Client Interface shown in Figure 2-11 has similar parameter controls when compared with the LabVIEW interface described in Section 2.2.1.
In the server connection panel, a user must first press the "Connect" button. This establishes a connection to the DataSocket server and instructs it to begin streaming data to the Java Interface. Once a connection is established, the user will be able to view temperatures and flowrates.
Users can change the experiment parameters by submitting values via the parameter controls panel. In the parameter controls panel, a user may have control over the:
" Flow direction (Counter current or Cocurrent) " Hot fluid flow rate
" Cold fluid flowrate " Temperature Setpoint
" PID (Proportional-Integral-Derivative) parameters
Users must click the Submit button to update the parameter values. Depending on the experiment, users may not have control over all the parameters. If a user does not have control of the parameter, the corresponding button will appear gray.
Shown in the data output panel are the actual temperature and flow values. The temperature values are received from thermocouples mounted at different locations in the heat exchanger. For the Shell and Tube HT33 Heat Exchanger, the thermocouple locations are TI through T4; T5 and T6 are not used.
The chart panel contains a scrolling graph that displays the hot inlet temperature (TI). Both the X and Y axes are scaleable.
The data recording panel allows users to save data in Excel format in a folder on the server. There is a text box to input the filename and a button that submits the filename to the server. Only after Submit has been pressed, the user can press the Start Recording button. When recording starts, a green light will appear after which he/she can press the Stop Recording button to stop the data recording.
Figure 2-11: Java Client Interface (Spring 2002)
3
I-LAB HEAT ExCHANGER IMPROVEMENTS
During the course of work on this thesis, many changes have been made to the existing software architecture of the I-Lab Heat Exchanger. Section 2.2 presented an overview of
the initial software architecture used for the I-Lab Heat Exchanger. This architecture is depicted in Figure 3-1. The initial LabVIEW GUI depicted in Figure 2-8 is at the center of the software architecture since it directly interfaced with the Heat Exchanger via the DLL file provided by Armfield. The I-Lab Heat Exchanger Project was designed to have two types of web-accessible interfaces, one type would be for instructors only, and the other type would be for students. To facilitate remote instructor control, a VNC server was used, a product from AT&T Laboratories, Cambridge, England. The VNC server allowed the instructor to remotely view the desktop of the server computer, essentially allowing the instructor to have the same control as if he/she were seated at the server. For remote student control, the Java GUI depicted in Figure 2-11 was used to communicate with the LabVIEW software and the Heat Exchanger via the DataSocket server.
Software Overview: January 2002
Heat Exchanger,
Fs fwre Driver (from Armfield)
(Dynamnic Link Library)
FVNC Experiment GUI National Instrument LabVIEW 6i ~ server **(Remonte histiuctor Control)
Data Socket Server Software
Plngins Required, JRE 1_3
Experiment GUI
OJava .Applet)
Figure 3-1: I-Lab Heat Exchanger Software Overview: January 2002
After the release of LabVIEW 6.1, the software architecture was redesigned and included a new web-accessible LabVIEW GUI and collaboration utility. The redesigned software architecture is shown in Figure 3-2.
Since the inception of the I-Lab Heat Exchanger Project, more students at MIT and from other institutions have been using the equipment over the web. This increased usage has made it important that the website be able to keep track of when experiments would be performed and who would be performing them. Making use of ASP.NET web forms and a SQL Server database, the I-Lab Heat Exchanger website is now able to perform this tracking. Students are now required to register online prior to performing an experiment and can sign up for a vacant timeslot that can be viewed online. If a student signs up for a timeslot, the information is transmitted to the SQL Server database and can be retrieved at a later time.
Also included in the redesigned software architecture is a collaboration utility that allows students to collaborate in teams while performing an experiment. The collaboration utility consists of a chat window via which students can talk, and a "Pass the Token" system through which control over the experiment parameters can be passed between students. The collaboration management server manages this process by coordinating message passing between the client computers. It also handles user authentication via the
SQL Server database.
Since LabVIEW 6.1 supported publishing a VI directly on the web, there was no need to have a DataSocket server acting as an intermediary between the web-based application and the underlying LabVIEW software. A new GUI using LabVIEW 6.1 was developed (See Figure 3-5) and was published on the web. To evaluate the usability of the new LabVIEW interface, students in MIT course 10.302 (Transport Processes) performed a two part experiment. For Part 1, the Java GUI was used, and In Part 2, the LabVIEW GUI was used. We found that students preferred using the new LabVIEW interface if they experienced no problems while performing the experiment. Additional results from
Software Overview: January 2003
Heat Exchanger Software Driver (from Armfield)
(Dvnamic Link Librarv)
VNC Experiment GUI National Instrument LabVIEW 6.1 Server (Remote Instructor Conti ol)
Data Socket Server Software
Collaboration
i. Management Server (Java Application)
Database
(MS SOL Server 2001,)) Plugms Requred:
Plugins Required: JRE 1.3
JRE 1.3 _ LabVIEW 6.1
Experiment & Collaboration User Authentication & Experiment & Collaboration
GUI Registration GUI
(Java Applet) (ASP NET web appheation) (LabVIEW Web VI & Java Applet)
10302 Part 1: Java GUI -
-10.302 Pan 2: Lab VIEW GUI
Figure 3-2: I-Lab Heat Exchanger Software Overview: January 2003
3.1
COLLABORATION UTILITYThe hot water pump on the Heat Exchanger has a lifetime of a couple thousand hours, making it advantageous to have multiple students performing an experiment at once, thereby reducing wear on the pump. To address this issue, in the fall of 2002, the I-Lab Heat Exchanger was redesigned so that students could perform experiments collaborating in teams.
Students collaborating in teams introduced two problems:
" How would students communicate if they were not working in close proximity to each other?
* How would the system decide who could change the system parameters at any given moment?
To address these problems, a collaboration utility was integrated into the Java Client Interface that featured a chat window for communication amongst team members and a "Pass the Token" capability so only one team member could control the experiment parameters at any given moment. The chat capability is not as robust as AOL Instant Messenger [1] due to limited time and resources, but does not require a student to download additional software. The collaboration utility is divided into two parts: the server side application that handles user authentication, control, and message passing, and the client application, which is used by students.
3.1.1 CLIENT APPLICATION
Figure 3-3 depicts the Java Client Application that was developed with the collaboration utility. Besides the collaboration utility, this version of the Java Interface provides user authentication (shown in login panel) and displays more temperatures on the scrolling graph.
To use the Java Interface (client application) a user must first enter his/her Login ID and Password and press the "Login" button. Every user is assigned a Login ID and Password when first registering to use the system. Requiring this information provides an additional level of authentication to ensure that the user is authorized to perform the experiment. When the "Login" button is pressed, the application creates a socket connection with the collaboration server and sends it a Login message. Once a user is logged in, he/she will be able to view temperatures and flowrates, and their Login ID will appear in the collaboration panel.
The collaboration panel is divided into two distinct components. Starting at the top is the chat component. On the left is a list of all users currently logged in and on the right is the chat window, where users can view messages. Below these two boxes is a field where users can enter messages and send them to other users.
Figure 3-3: Java Client Interface (Fall 2002)
Below this field is the "Pass the Token" component that controls which user can control the experiment parameters shown on the left hand side of the interface. If a user does not have control over a parameter, the Submit button next to it will appear gray. The name of the user that currently has control over the parameters appears next to the label "Person with Control." The first user to log into the system automatically gets control of the parameters and his/her Login ID will appear in this box. If a user wants to gain control of the parameters, he/she must press the button labelled "Request for Control", which broadcasts a message to all users who have logged in via the chat window. The user who has control of the parameters can transfer control to the user who made the request by typing the user's username into the "Pass Control" field and pressing the appropriate button.
The data output panel and the chart panel exhibit the same behavior regardless whether a user has control over the parameters. The users who cannot control the parameters still can view the data outputs and the charts, but will not be able to record data. Only the user with control will be able to record data.
The chart panel contains a scrolling graph that can display the hot/cold inlet and outlet temperatures. Users can select which combination of temperatures they wish to view by selecting the appropriate checkboxes on the side.
3.1.2
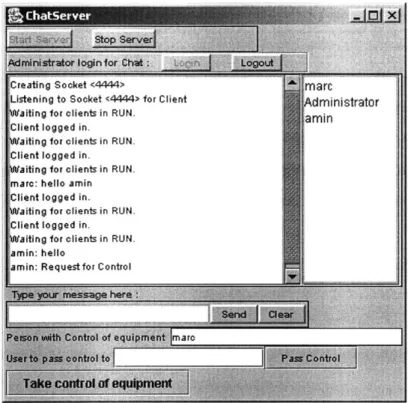
SERVER APPLICATIONThe Server Application uses threads to perform multiple tasks. Within one thread, it creates an instance of the java.net.ServerSocket class and binds it to a specific server port. It then keeps listening to this port for clients without interrupting other operations. Figure 3-4 shows a screenshot of the collaboration server application. When the "Start Server" button is pressed, the ServerSocket is created and the server starts listening to this socket.
If a client connects to the server at that specific port, the server reads from the Socket and tries to authenticate the user. If the client is not authenticated, a denial message is sent to the client containing the reason for denial. If the client is authenticated, a new instance of the Client class is created and added to a list of clients. After the new client is created the server keeps on listening to the same port for new clients to log in.
Client authentication is accomplished by connecting to the SQL Server database. More information about the database is contained in Section 3.4.1. JDBC is used to connect to the SQL server database. The JDBC API [5] provides Java programs access to tabular data sources in a large number of formats. While the core API provides a high-level, platform independent interface, it relies on a platform specific implementation to actually access and manipulate the data.
Figure 3-4: Collaboration Server
In our case, the Microsoft SQL server 2000 driver for JDBC was used. This driver had to be registered first in order for the JDBC driver manager to know which driver to load. Utilizing the JDBC driver and the appropriate SQL commands, the server checks to see if the Login ID and Password from the client application match the Login ID and Password of any records in the database.
In order to transmit information such as ID's and passwords between the client and server application, the client and server encode this information into messages. For example, a user's Login ID and Password would be contained in a "Login" message that is passed to the server.
The messages that are passed between the server and the client have a specific predefined format. The messages consist of:
" Information about the sender (client ID) " The actual message (body)
The command character is used to distinguish between types of messages. A typical message will have the following format:
Command Character + ClientID + Body of Message
When a message is received at the server, the message is parsed and is divided into several substrings. Then, the message is processed according to the command character that it contains. For example, if the command character is "Login", then a database access to check the login is performed. Some other key command characters are "Logout", "Message", "SeekControl", "ProvideControl". When a "Message" is encountered, the message body is rebroadcast to all clients who are currently logged in. This allows all users to see a message that someone has submitted. Likewise, the "SeekControl" command character rebroadcasts a "Request for Control" message. Similarly, the "Provide Control" command character broadcasts a message as to which client should have control over the parameters.
At the bottom of the graphical interface, the Login ID of the user with equipment control is shown. The Administrator has to press the Login button to participate in the chat.
3.2
LABVIEW 6.1 GUI
In November of 2001, National Instruments released the latest version of LabVIEW, Version 6.1. LabVIEW 6.1 was the first version of LabVIIEW to offer web-based control of a LabVIEW VI. As a result, we decided to develop a client GUI using LabVIEW 6.1 for two main reasons:
1. To explore the possibility of reducing system development time, as compared to Java programming, if additional pieces of equipment were to be made web-accessible.
2. To provide students with a more user-friendly interface which more closely resembles a control panel that they might find on a laboratory instrument.
Creating the Java Client Interface required a substantial amount of time. System development time and system complexity could be reduced if the LabVIEW interface could communicate with the heat exchanger and be made accessible to students over the web. This would eliminate the need for the Java Interface and the use of a DataSocket server. It was our hypothesis that students would prefer to use the LabVIEW interface since the controls included knobs, buttons, and real-time, scaleable scrolling graphs. Figure 3-5 depicts the LabVIEW GUI that was developed.
The GUI is divided into two pages. On the page shown in Figure 3-5, there are controls and indicators divided into three distinct sections: Parameter Controls, Temperature Data, and Flow Rate Data. On the second page, shown in Figure 3-6, there is a real time data table that contains temperature and flowrate data from the heat exchanger.
3.2.1
PARAMETER CONTROLSIn the upper right corner of the interface is the section labelled Parameter Controls that contains all the input parameters for the heat exchanger. There are two knobs that control the hot and cold flowrates. Alternatively, a user can enter a number for the flowrate in the boxes below the knobs. The flowrates can vary between 0.5 and 5 liters per minute. A user can switch between countercurrent and cocurrent operation by dragging the selector switch to the appropriate side. There also is an input panel for the PID parameters and an input box for the hot water setpoint temperature. If a user wishes to record data, he/she can type a filename in the appropriate box and press the adjacent button to start data recording. The button will turn green once data recording is initiated and the data is stored on the server.
3.2.2 TEMPERATURE DATA
One of the weaknesses of the Java Client Interface was the way it represented the temperature data from the heat exchanger. In the Temperature Data section, both numerical and graphical data are presented so that students can see how the temperatures are changing over time. There is a picture that represents the HT31 double-pipe heat exchanger, and arrows represent the direction of fluid flow when configured for countercurrent operation. Overlaid on this image are six temperature readings from thermocouples placed at six points on the exchanger. Looking at the image, students can see the direction of fluid flow, the location where temperature readings are taken, and can read the numerical temperatures at those points.
The graph shows the inlet and outlet temperatures for the hot and cold fluid streams. The graph constantly scrolls while the system is running and shows the last five minutes of temperature data. Students can scale the temperature axis (ordinate) by clicking on the maximum or minimum values and entering a new value. The temperature graph is helpful in determining when the heat exchanger has reached steady state so that students can begin taking measurements..
3.2.3
FLOW RATE DATAThe Flow Rate Data section contains two scrolling graphs, one for the hot flowrate and one for the cold flowrate. On each graph panel there is also a numerical indicator of the flowrate. The flowrate axis (ordinate) of both graphs is scaleable by clicking on the maximum or minimum values and entering a new value. The flow rate graphs show data for the last three minutes. These graphs are helpful in detecting when the flowrate has reached steady state. In addition, these graphs also detect irregularities in the control algorithm, which can occur at very low values of the hot water flow rate. This is associated with the operating range limit of the pump, which causes the flow rate to jump between values such as 0.2 and 0.6 L/min when the flow rate is set at 0.4 Iimin.
3.2.4
REAL-TIME DATA TABLEFigure 3-6 shows the data table that is located on the second page of the GUI. The data table contains temperature and flowrate values recorded since the system was turned on. This feature was designed to give students a better estimate of the data that they would be recording to an Excel file. It also enables them to better understand the precision of the measurements they will be making.
Figure 3-6: LabVIEW 6.1 GUI Data Table
3.3
PROCESS CONTROL
An important aspect of the I-Lab Heat Exchanger is its real-time feature. A change in one of the flowrate values or the hot water setpoint leads to a transient response on the data output, and the desired steady state value should to be reached as soon as possible. In order to achieve this goal, control algorithms had to be implemented for the hot and cold water flowrates and the hot water temperature. The hot water temperature was controlled by placing algorithms that determined the on/off operation of the heater, and the cold and hot water flowrates were controlled through algorithms that determined pump and valve settings. All the control algorithms were based upon proportional-integral-derivative (PID) control. Once the control algorithms were in place, the Ziegler-Nichols closed-loop tuning method was used to find the optimal PID parameters.
3.3.1
PID CONTROL OVERVIEWA PID controller is a type of feedback controller that generates an output that causes some corrective effort to be applied to a process so as to drive a measurable process variable towards a desired value known as the setpoint. In our case, one process variable is the actual hot water inlet temperature and the setpoint is the desired value for the hot water temperature. The controller determines its output by observing the error between the setpoint and a measurement of the process variable. Its mission is to eliminate the error automatically.
PID stands for Proportional, Integral, Derivative. These designate the three modes that determine the controller output. These equations show the relationships:
P Proportional Band = 100/gain
I Integral = 1/reset (seconds)
D Derivative (seconds)
With proportional band, the controller output changes in proportion to a change in the measured error. The greater the error, the greater the control effort; and as long as the error remains, the controller will continue to try to generate a corrective effort. However, with only proportional control, the controller will generally leave a steady state error (offset) between the setpoint and the process variable after it has finished responding to a setpoint change or a load.
The introduction of integral control resolves this problem. An integral controller generates a corrective effort proportional not to the present error, but to the sum of all previous errors. The controller itself is the same, but the addition of the integral action in the process makes the controller more effective.
However, with proportional band and integral control, the controller still takes too long to compensate for a load or a setpoint change. In order to improve performance, a
derivative controller can be added that generates a control action proportional to the time derivative of the error signal. The basic idea behind derivative control is to generate one large corrective effort immediately after a load change in order to begin eliminating the error as quickly as possible.
Equation 3-1 shows how the proportional, integral, and derivative modes are combined to produce the controller output (u). Kp is the gain value, K1 is the reset time (seconds), KD is the derivative time (seconds), and e is the error value. The error is calculated by subtracting the process variable from the setpoint variable
de
U
= Kpe + Kf edt +
KD
d
dt
Equation 3-1: PID Controller Output3.3.2 PID TUNING
In order to find the optimal PID parameters for the gain, reset time, and derivative time, the Zeigler-Nichols Closed Loop tuning method was used. There were three separate controllers for which optimal PID parameters needed to be found. They consisted of the hot water temperature controller, the cold water flowrate controller, and the hot water flowrate controller. In order to perform the tuning, the following steps (taken from the National Instruments PID Manual [6]) were followed:
1. Set both the rate(derivative time) and reset on your PID controller to 0.
2. Carefully increase the proportional gain (Kp) in small steps. Disturb the loop after each step by making a small change in the setpoint. This will cause the process variable to oscillate. Keep making changes until the oscillation is perfectly sustained, neither growing nor decaying over time.
3. Record the controller proportional band PBu as a percent, where PB" = 100/Kp 4. Record the period of oscillations as T in minutes.
5. Multiply the measured values by the factors shown in Table 3-1, and enter the new tuning parameters into your controller. The table provides the proper values for a quarter-decay ratio.
1.67PB, 0.50Tu 0.125Tu
Table 3-1: PID Conversion Factors
Figure 3-7 illustrates a sustained oscillation in temperature (process variable) after a disturbance in the hot water temperature setpoint.
tL
A
Figure 3-7: Oscillation in Hot Water Temperature
The optimal parameters obtained for the cold and hot water flowrates were applicable over the entire useful range (cold 0.5 to 5.0 L/min, hot 0.5 to 5.0 L/min). However, the optimal parameters for the hot water temperature control varied as a function of the hot water flowrate. To address this problem, optimal values of PBu and Tu were calculated over the range of the hot water flowrate. Optimal values were calculated over the useful range, in 0.5 L/min increments. Curves were fitted to a plot of PBu and Tu versus flowrate to determine a relationship between the flowrate and these parameters. For the double pipe heat exchanger, the relationship between flowrate and PBu was logarithmic. The relationship between flowrate and T, was exponential. These relationships can be seen in Figure 3-8. The functions for PBu and Tu were multiplied by the conversion