HAL Id: hal-01663613
https://hal.archives-ouvertes.fr/hal-01663613
Submitted on 18 Dec 2017
HAL is a multi-disciplinary open access
archive for the deposit and dissemination of
sci-entific research documents, whether they are
pub-lished or not. The documents may come from
teaching and research institutions in France or
abroad, or from public or private research centers.
L’archive ouverte pluridisciplinaire HAL, est
destinée au dépôt et à la diffusion de documents
scientifiques de niveau recherche, publiés ou non,
émanant des établissements d’enseignement et de
recherche français ou étrangers, des laboratoires
publics ou privés.
Density and Mobility-driven Evaluation of Broadcast
Algorithms for MANETs
Raziel Carvajal Gómez, Inti Gonzalez-Herrera, Yérom-David Bromberg,
Laurent Réveillère, Etienne Rivière
To cite this version:
Raziel Carvajal Gómez, Inti Gonzalez-Herrera, Yérom-David Bromberg, Laurent Réveillère, Etienne
Rivière. Density and Mobility-driven Evaluation of Broadcast Algorithms for MANETs. IEEE 37th
International Conference on Distributed Computing Systems (ICDCS), 2017, Jun 2017, Atlanta, GA,
United States. �10.1109/ICDCS.2017.240�. �hal-01663613�
Density and Mobility-driven Evaluation of
Broadcast Algorithms for MANETs
Raziel Carvajal G´omez1, Inti Gonzalez-Herrera2, Y´erom-David Bromberg3, Laurent R´eveill`ere2 and Etienne Rivi`ere1
1. University of Neuchˆatel, Switzerland, 2. LaBRI/University of Bordeaux, France, 3. IRISA/University of Rennes 1, France. [email protected]
Abstract—Broadcast is a fundamental operation in Mobile Ad-Hoc Networks (MANETs). A large variety of broadcast algorithms have been proposed. They differ in the way mes-sage forwarding between nodes is controlled, and in the level of information about the topology that this control requires. Deployment scenarios for MANETs vary widely, in particular in terms of nodes density and mobility. The choice of an algorithm depends on its expected coverage and energy cost, which are both impacted by the deployment context. In this work, we are interested in the comprehensive comparison of the costs and effectiveness of broadcast algorithms for MANETs depending on target environmental conditions. We describe the results of an experimental study of five algorithms, representative of the main design alternatives. Our study reveals that the best algorithm for a given situation, such as a high density and a stable network, is not necessarily the most appropriate for a different situation such as a sparse and mobile network. We identify the algorithms characteristics that are correlated with these differences and discuss the pros and cons of each design.
I. INTRODUCTION
The advent of the Internet of Things is leading to a revival of interest in mobile ad-hoc networks (MANETs). A MANET is a mobile network that does not rely on a fixed infrastructure. It is instead a self-configuring network. Nodes connect directly to each other, and there is no guarantee for end-to-end connectivity. The topology of a MANET changes frequently due to the mobility of its participants. Nodes are connected using a wireless network, there is no central entity in charge of routing, and most participants operate on battery-powered
devices. Applications based on MANETs [1] range from sensor
networks to end-user mobile applications, such as systems for traffic jam prevention or alert dissemination.
Many network functions in MANETs, such as routing, rely on the broadcast operation that delivers a message from a source node to all other nodes in the network. A considerable amount of attention has been spent to provide efficient broadcast
algorithms in MANETs [2]–[7]. In particular, their efficiency
can be achieved from different perspectives:
• Maximize coverage.Ideally, every broadcast message must reach all nodes. Hence, a broadcast algorithm is evaluated from its coverage, i.e. the percentage of nodes that receive a broadcast message.
• Minimize energy consumption and bandwidth usage. The amount of energy, processing power and network bandwidth a broadcast algorithm uses have an impact on
its efficiency. So the key aim is to provide a maximum coverage while consuming fewer resources.
• Be mobility-tolerant and density aware. Additionally, a broadcast algorithm should also cope with mobility patterns under a large variety of scenarios, where the connectivity between nodes is changing constantly. All these algorithms implement broadcasting with a form of
controlled flooding. Since the transmission range of a source node is typically much smaller than the area of communication, broadcasting is achieved by forward messages between nodes. Broadcast algorithms for MANETs mostly differ in the way they control this forwarding operation. Particularly, the control happens in space and time by deciding which nodes should forward a message and when this operation should take place. Algorithms can also be distinguished based on their use of, or independence from, knowledge about the network topology, nodes locations, and network status. Broadcast algorithms are largely influenced by external factors such as the density of the network, and the mobility rate of nodes. The performance of
broadcast protocols has been studied individually [8], [9] and
extensive work have been done on their classification [10], [11].
However, and to the best of our knowledge, there is still no comprehensive experimental comparison of existing solutions that would allow an understanding of different broadcast algorithms under different deployment scenarios.
Contributions. We aim to explore the relative performance and costs of representative broadcast algorithms for MANETs in a variety of deployment conditions, in order to ease the task of selecting the most appropriate algorithm for a given situation. In addition to simple flooding, we consider four algorithms that are representative of their class:
• The CDS-based approach builds a source-independent
approximation of the minimum Connected Dominating
Set (CDS) [4]. The CDS uses a subset of the nodes as
relays, while other nodes are pure receivers.
• MPR(Multipoint Relaying) also uses a subset of nodes as
relays but employs heuristics aiming at minimizing their
number [3].
• ABBA(Area Based Beacon less Algorithm) controls the
dissemination process in time, by setting up timers that must elapse with no duplicate reception to trigger the
forwarding [2].
of forwarding a message is proportional to the measured
local density around each node [5].
Our study aims at helping practitioners deciding what is the most appropriate algorithm for a given deployment scenario. We show that there is no one-size-fits-all to broadcast in MANETs. Our categorization of algorithms can also form the basis of an adaptive broadcast approach that would change its behavior at runtime based on contextual information.
II. BACKGROUND
A straightforward approach to broadcast is simple flooding.
When one host receives a broadcast messagem for the first time,
it is forwarded; the reception of further copies ofm are ignored.
This approach suffers from a number of drawbacks and in
particular from the broadcast storm problem [12] where nodes
forward every new message at least once. The communication medium rapidly becomes saturated, increasing the likelihood of collisions and message loss.
The lack of a central authority in MANETs implies that broadcast algorithms, aiming at improving over simple flooding, must both remain fully distributed, and rely only on local data available at each node. Ruiz and Bouvry have surveyed
extensively such solutions [10]. The authors define a taxonomy
to classify state-of-the-art algorithms based on the way they control message forwarding. From this work, we have selected the four most representative algorithms, two algorithms that are topology aware, and two others that are context aware.
A. Topology-based algorithms
A first class of broadcast algorithms uses an underlying topology, or backbone, which is a subset of nodes in charge of forwarding messages. Nodes out of the backbone acts
solely as message receivers. For instance, Figure 1 depicts
a network of nodes where A starts the dissemination. To reach
100% coverage, nodesB and C must form the backbone. The
complexity of a topology-based algorithm is in the construction of this topology, formally known as a Connected Dominating Set (CDS). Nodes must be partitioned such that they either belong to the CDS or are in range of one of its nodes. In this study, we consider two topology-based algorithms: Multipoint
Relaying (MPR) [3] and CDS-based [4]. Both require the periodic exchange of control messages between nodes in order to build the overlay.
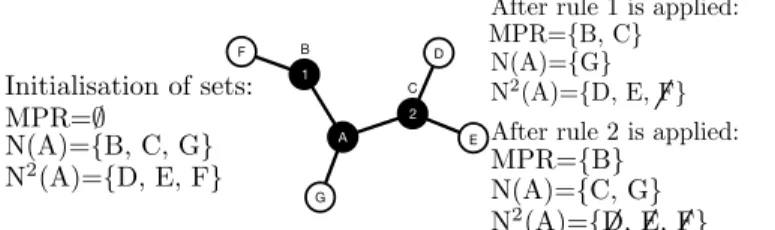
a) MPR: The CDS obtained in [3] is called a Multipoint Relay (MPR) set. Nodes start with an empty MPR set but having the knowledge of their one-hop and two-hop neighbors,
represented by N and N2 respectively. This knowledge is
built from the previous exchanges of control messages. The procedure to determine relay nodes proceeds in two steps. First,
any one-hop neighbor n ∈ N will be selected for inclusion in
the MPR ifn is an unique neighbor of any other node in N2.
Second, while the current MPR set does not cover all nodes
in N2, the algorithm iterates over each remaining neighbor
n ∈ N and counts how many two-hop neighbors n would
cover. n is selected as a relay node only if it allows covering
two-hop neighbors that are not already chosen. Figure1shows
B C D E F G 1 2 A N(A)={B, C, G} MPR=∅ N2(A)={D, E, F} Initialisation of sets:
After rule 1 is applied:
MPR={B} N(A)={C, G} N2(A)={D, E, F}
After rule 2 is applied: MPR={B, C} N(A)={G}
N2(A)={D, E, F}
Fig. 1: Steps to get the MPR set of peer A. Forwarding nodes are shown as black filled-in circles.
the steps taken by a nodeA to compute its MPR set. Once A
receives its one-hop and two-hop neighbors, nodeB is marked
as a relay node as it is the unique neighbor ofF , in application
of the first rule. The second rule indicates that nodeC must be
part of the MPR set, because the number of covered two-hop neighbors (here, two) is bigger than those neighbors covered
byG (here, zero).
b) CDS-based technique: The decentralized algorithm
in [4] first approximates the CDS using a marking procedure.
Then, it proceeds to the minimization of the number of relay nodes. As for MPR, the knowledge of one-hop and two-hop neighbors is required. The marking procedure consist
of identifying unconnected neighbors. If noden realizes that
a pair of its neighbors is not connected, it marks itself as a
forwarding node. For instance, in Figure1A would mark itself
as a relay node because nodesB and G are not connected. To
reduce the number of elements in the CDS obtained by the
marking procedure, authors in [4] take into consideration either
the degree of nodes or the remaining energy in nodes’ batteries. We chose the former approach to be fair in the comparison with MPR, which does not take the energy level into account. Our implementation of the CDS-based technique follows the
rules 2 and 2a described in [4].
B. Context-aware and context-oblivious algorithms
The periodic exchange of control messages, required in
topology-based algorithmsto build the CDS overlay, results in a high probability of collisions, and inherently implies loss of messages. Moreover, when nodes move, the frequency at which these messages are sent must increase in order to maintain up-to-date topological information and henceforth a correct set of forwarding nodes. To overcome the aforementioned issue, we consider now context-aware algorithms, which are a second class of protocols. Such protocols do not require building virtual overlays. Forwarding decisions are based on metadata associated to nodes. Metadata informations are piggybacked with broadcast messages themselves.
a) ABBA: in the Area-Based Beacon-less Algorithm [2], the flooding process is controlled in both space and time. This algorithm requires nodes to know their physical location and
their transmission range Tx. The reception area of node N
can be seen as a circleCx with radiusTx centered at node’s
position. WhenN receives a message M part of Cxperimeter
is covered,N then sets a timeout that is inversely proportional
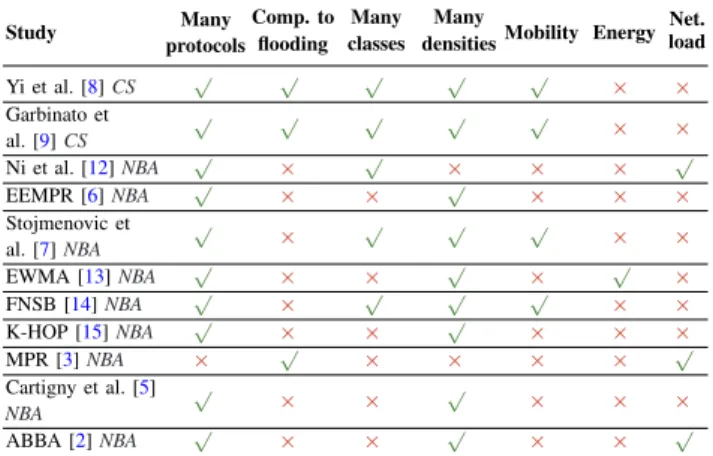
Study Many protocols Comp. to flooding Many classes Many
densitiesMobility Energy
Net. load Yi et al. [8]CS √ √ √ √ √ × × Garbinato et al. [9]CS √ √ √ √ √ × × Ni et al. [12]NBA √ × √ × × × √ EEMPR [6]NBA √ × × √ × × × Stojmenovic et al. [7]NBA √ × √ √ √ × × EWMA [13]NBA √ × × √ × √ × FNSB [14]NBA √ × √ √ √ × × K-HOP [15]NBA √ × × √ × × × MPR [3]NBA × √ × × × × √ Cartigny et al. [5] NBA √ × × √ × × × ABBA [2]NBA √ × × √ × × √
TABLE I: Survey of evaluation criteria used in different performance studies. In the second column, CS stands for
comparison study and NBA for New Broadcast Algorithm
the length of the covered perimeter forM is, shorter the time to
wait to forwardM is. New receptions of M result in updating
the timeout, with one exception. If Cx perimeter is totally
covered then the retransmission ofM is canceled.
b) Probabilistic flooding: such algorithms use both infor-mation about one-hop neighbors, and a probabilistic approach
to forwarding [5]. Messages are retransmitted based on nodes
degree. This differs from the canonical probabilistic approaches where every node in the network has the same probability of retransmitting messages without taking into account nodes degree. The probability of retransmitting a message decreases as the number of neighbors on each node increases.
III. RELATEDWORK
Previous works and studies of broadcast algorithms for MANETs can be categorized in two classes: evaluations in the context of the proposal of new broadcast algorithms (NBA), and
performance comparison studies (CS). TableIsummarizes the
related work (RW). The first column “Study” lists all the RW that we have considered, tagged with either NBA or CS accordingly. For each RW, the column “Many protocols” shows whether the related work compares more than one protocol. In the next column, we indicate if each RW has been compared to the simple flooding scheme (“Comp. to flooding”). Further, the “Many classes” column indicates if the RW is compared either with other protocols that belongs to the same class or not. Then, the columns “Many densities”, “Mobility”, and “Energy” highlight if each RW takes into account respectively the impact of network density, mobility and energy consumption. Finally, the last column shows whether the overhead on the communication medium has been measured. Such a measurement matters as the amount of collisions and the performance of broadcast is directly linked to the amount of sent and received messages on the medium, including retransmissions.
In their seminal work, Ni et al. [12] identify the drawbacks
of using basic flooding to perform broadcast. The authors propose different algorithms that, by construction, outperform simple flooding. Hence, they do not consider simple flooding in their evaluation. This is a common pattern in evaluating
broadcast algorithms. The third column in Table I shows
that most of the studies avoid considering simple flooding
on their evaluation. However, as illustrated in [8], comparing
a broadcast algorithm against simple flooding is more than relevant as soon as metrics like mobility are taken into account. Interestingly, most studies only consider comparisons among protocols belonging to the same class. For instance, authors only
compare algorithms that build a CDS in [6], others authors only
compare algorithms based on the construction of cluster-based
algorithms in [15], and finally, only probabilistic approaches
with context awareness are considered in [5]. Additionally,
in [13] the authors only compare algorithms that build a tree
by varying the transmission range.
There are, nevertheless, some studies that compare protocols from different classes. Previous work compare probabilistic and
area-based algorithms [9], [12]; while some studies evaluate
the construction of CDS-based and cluster-based topologies [7],
[14]. When considering power consumption, many studies do
not measure the cost of building and maintaining the underlying topology. They take only in consideration the propagation of
broadcast messages. In fact, TableIshows that most studies do
not measure energy consumption at all. Other variables such as mobility and how it affects the performance of algorithms are seldom evaluated.
IV. EXPERIMENTALSCENARIO
Our experiments are inspired by the scenario of a crowd of humans carrying portable communication devices (e.g., phones) in an area with no infrastructure connectivity. The dissemination of information from one individual to all the others is critical, and uses ad-hoc connections between devices. Our evaluation of broadcast algorithms for MANETs is mainly driven by two factors: network density and nodes mobility. We describe in the following the parameters used in our study.
Simulator. We rely on OMNET++4.6/INET3.3, a simulation
framework for the evaluation of networking algorithms [16].
This tool provides a full implementation of the IEEE 802.11g standard. In addition, it contains models for the mobility of nodes and for energy consumption.
Communication Scenario. Simulated participants use their devices to broadcast messages without external coordination and may attempt to do so at nearly the same time. We set our experiments to perform 100 broadcast messages. The frequency
between broadcasts is 0.5s. The source of each message is
randomly selected. The content of each message is randomly generated, unique and with a length of 32 Bytes.
Nodes Density. We are interested in generating scenarios with different nodes densities. We consider three parameters: the transmission range (Tx), the map size and the number of nodes.
As shown in [17], the dependency between these parameters
allows us to build networks with a given density, by using random geometric graphs. In our experiments, all nodes have
a Tx of 20 m.1 The number of nodesN is fixed to 500. To
1Theoretically, IEEE 802.11 allows communication in a range between 20
and 140 meters, depending on the line of sight. Previous empirical tests show that it can be between 20 and 30 m in indoor or crowded places [9].
create a network with a given density, we set Tx and N and compute the map size. Then, we generate a laying on the map by using random geometric graphs. We instantiate 8 networks of 500 nodes each and set the densities to 5,10, . . . , 40 nodes, a range of values that is frequently found in the literature. This
leads to a map size ranging from125 × 125m to 354 × 354m.
Mobility. We use the truncated-levy walk (LW) mobility model, as it characterizes well the mobility traces of humans carrying
wireless devices [18]. This model generates traces composed of
frequent short walks and occasional rides to distant locations. We define two scenarios: One without mobility (static) and
another with mobility (dynamic) at a walking speed of1.4 m/s
– based on an estimation of the preferred walking speed [19].
We generate the dynamic scenario starting from the static one and applying the mobility based on the model. We check that the network remains connected for the duration of the experiment, or discard the data and regenerate using a new random seed.
Energy Settings. This metric depends on the wireless commu-nication chip used. We model power consumption using the specifications of a commercial chip found in modern mobile
devices. We use Broadcom BCM4329 chip [20], which supports
Wi-Fi 802.11g on the 2.4 GHz frequency band. Its energy consumption per operation modes is as follows: sleep (648 nW), listen (244.8 mW), receive (295.2 mW), transmit (1206 mW). These values are used for the StateBasedEnergyConsumer consumption model integrated with INET.
Algorithm-specific parameters. The behavior of each protocol depends on its parameters, for which we favor values previously reported in the literature. For instance, we use 0.5s as the hello
time for MPR, ProbFlood and CDS-based. In the case of
ABBA, we use 0.3s as the maximum waiting time. Finally, for
ProbFlood we usek = 15 and σ = 1.
Simulation time. As mentioned in SectionII, some algorithms
first need to build a topology. To guarantee that the first broadcast message is properly handled by all protocols, we set an initial warm-up period of 5s, allowing CDS-based algorithms to perform this initial construction. The total simulation time
is then10 + δt × M , where δt is the interval between broadcast
messages andM is the number of scheduled messages.
V. EVALUATION
In SectionIVwe described the scenarios used to evaluate
broadcast algorithms. In this section, we present the results of our experiments with and without mobility and over different nodes densities. Our results are expressed in terms of the following metrics:
⊲ Saved Rebroadcasts (SRE) – the number of forwarding we avoid by using a given algorithm instead of simple flooding. ⊲ Duplicate messages – the number of times one broadcast message is received again after its first reception.
⊲ Coverage – the percentage of nodes that successfully receive a broadcast message at least once.
⊲ Energy consumption – the energy consumed by nodes for the broadcast of all messages and, when applicable, for the construction and maintenance of the overlay.
A. Network overhead
The proportion of SRE and duplicate messages determine to which extent the communication medium is saturated.
Figure 2(a)shows the SRE in static scenarios, where MPR
outperforms all other protocols. However, the difference between MPR and other algorithms decreases as the density increases. Interestingly, ABBA avoids retransmissions more efficiently than the CDS-based technique, for densities above 10. This pattern was expected in higher densities because ABBA cancels retransmissions and outperforms CDS-based by 10%.
Figure2(c)presents dynamic scenarios, where we observe that
mobility affects the performance of topology-based algorithms. Indeed, the virtual topologies quickly becomes out of date due to the constant changes in nodes neighborhoods. ABBA maintains its robustness in these dynamic conditions but the power and communication cost of obtaining GPS coordinates is not considered.
The Proportion of Duplicate Messages (PDM) per algorithm
is shown in Figures2(b),2(d)as a distribution with whiskers.
In general, the lower the PDM is, the better the use of the medium is too. However, when PDM is compared against SRE the occurrence of collisions also affects message receptions. For instance, using simple flooding with a density of 30, nodes receive at most 10 duplicated messages instead of 30. Our results in PDM confirm that MPR avoids saturation in all scenarios.
B. Power Consumption
The amount of received and sent messages impacts power consumption due to the mode changes the radio chip must perform. Broadcast and control messages both influence this energy consumption. However, the network saturation in nodes vicinities influences energy consumption due to the way the MAC layer works. In CSMA, nodes keep sending messages until receivers reply with an acknowledgment message. This strategy increases network reliability but also energy
consump-tion. Figures 3(b) and 3(d) show energy consumption in
static and dynamic scenarios using violin plots to present the full distribution. We only show these densities with a significant change in energy consumption. We observe that
simple floodingconsumes more energy in all scenarios. MPR always outperforms other approaches when there is no mobility.
This is consistent with the results depicted in Figures 2(a)
and 2(b) where nodes send/receive fewer messages. ABBA
and ProbFlood do not show a single value of density where these algorithms behave better than MPR. This indicates that the cost of the control messages is worth in terms of power consumption when there is no mobility. On the other hand,
when nodes moves Figure 3(d) shows a different behavior.
ABBAoutperforms MPR when the density is between 5 to 15.
It is only when the density is greater than 20 that MPR becomes
competitive again. In correlation with Figures2(c)and 2(d),
we notice that nodes send less messages with ABBA than with
MPR. Given that the latter cannot maintain a completely
up-to-date backbone, it seems to fail in reducing the number of relay nodes.
! ! ! ! ! ! ! ! 0 20 40 60 80 10 20 30 40 Density SRB (%)
Algorithms!ABBA CDS!based MPR PROBFLOOD
(a) SRE messages in static scenarios.
Density 5 Density 10 Density 30 Density 40
0 10 20
Duplicate messages
Algorithms ABBA CDS!based FLOODING MPR PROBFLOOD
(b) Duplicate messages per algorithm in static scenarios.
! ! ! ! ! ! ! ! 0 20 40 60 10 20 30 40 Density SRB (%)
Algorithms!ABBA CDS!based MPR PROBFLOOD
(c) SRE messages in dynamic scenarios.
Density 5 Density 10 Density 30 Density 40
0 5 10 15 20 Duplicate messages
Algorithms ABBA CDS!based FLOODING MPR PROBFLOOD
(d) Duplicate messages per algorithm in dynamic scenarios.
Fig. 2: Overload of wireless communication through SRE and duplicate messages.
! ! ! ! ! ! ! ! 94 96 98 100 10 20 30 40 Density Co ver age (%)
Algorithms!ABBA CDS!based FLOODING MPR PROBFLOOD
(a) Coverage in static scenarios
!
!
! !
Density 5 Density 10 Density 30 Density 40
0.125 0.130 0.135 0.140 P o w er Consumption (J)
Algorithms!ABBA CDS!based FLOODING MPR PROBFLOOD
(b) Power consumption in static scenarios
! ! ! ! ! ! ! ! 25 50 75 100 10 20 30 40 Density Co ver age (%)
Algorithms!ABBA CDS!based FLOODING MPR PROBFLOOD
(c) Coverage in dynamic scenarios
!
!
! !
Density 5 Density 10 Density 30 Density 40
0.125 0.130 0.135 0.140 P o w er Consumption (J)
Algorithms!ABBA CDS!based FLOODING MPR PROBFLOOD
(d) Power consumption in dynamic scenarios
Fig. 3: Power consumption and node Coverage per algorithm
C. Coverage
Figures 3(a) and 3(c) depict the coverage for the studied
algorithms in both static and dynamic scenarios. Some ap-proaches fail to broadcast messages in configurations with low density because the network is connected by a single node in some partitions. In particular, ABBA and MPR are subject to this situation. We can also see that ABBA tends to fail with different values of density, although far less than topology-based approaches. Indeed, since the location of each node changes continuously, ABBA occasionally fails in computing the covered area; as a consequence, some messages are not
delivered. This is consistent with the observations in [8], [9].
VI. DISCUSSION
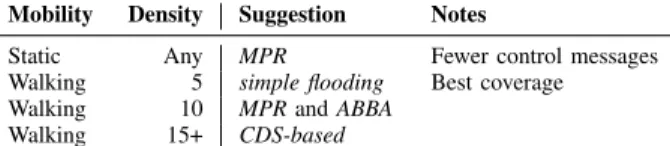
TableIIsummarizes our results. It has the form of a set of
rules that allows to choose an appropriate broadcast algorithm for a given deployment scenario. For instance, when there is no mobility, it is better to use MPR, no matter the density. As our experiments show, in such scenarios MPR consumes less energy, guarantees good coverage and uses efficiently the medium.
The rules for deployment scenarios with mobility at walking speed are more complex, as they take into account other external parameters such as the density. To suggest an algorithm, we
Mobility Density Suggestion Notes
Static Any MPR Fewer control messages
Walking 5 simple flooding Best coverage
Walking 10 MPRand ABBA
Walking 15+ CDS-based
TABLE II: Rules on which broadcast algorithm to use in different deployment scenarios.
first aim at increasing coverage, then the energy consumption and we consider that the medium usage is the least important of the metrics. For that reason, we suggest simple flooding when the density is very low. Finally, the results show that
MPRand ABBA are good alternatives when there is mobility
and the density is close to 10. Although for walking speed
ABBAis outperformed by CDS-based protocols, it is worth
considering it as the main alternative for scenarios where nodes move at higher speeds.
VII. PERSPECTIVES
Our experiments show that parameters such as mobility and density strongly impact the performance of broadcast algorithms. Interestingly, these parameters can be monitored at runtime. For instance, nodes can detect the density in their vicinity by sending control messages or by monitoring surrounding traffic. Likewise, mobile devices are often equipped with positioning systems and/or accelerometers to sense the movement of nodes. The next step is using the knowledge of the performance of various protocols in different contexts, to drive an adaptive overlay for disseminating messages. In our vision, a monitoring process provides data to a management layer that decides which approach a node should use to disseminate messages. The main challenge in this case is replacing the algorithm used at runtime without losing any message. Fortunately, most dissemination protocols do not require keeping a complex state on each node. Hence, we think that they are interchangeable while keeping strong guarantees on message delivery.
VIII. CONCLUSION
Selecting what is the appropriate broadcast algorithm for a given MANET deployment scenario is a daunting task. The performance of a given approach depends on its deployment context. This makes hard to find the right balance between reliability and efficiency.
The contribution of our work is to provide a comparison of the effectiveness of broadcast algorithms for MANETs that helps making an informed choice between protocols based on their target deployment scenarios. Our study reveals that the best algorithm for a given situation, such as a static network, is not the best for other scenarios where there is for instance lots of mobility. More specifically, we have compared five representative algorithms in different scenarios that we describe in terms of network density and node mobility. The results obtained allow us to identify what characteristics of these approaches are correlated to a certain performance outcome. Using this information, we can identify what are the algorithms that better match the studied deployment scenarios.
ACKNOWLEDGMENT
The research leading to these results has received funding from CHIST-ERA under project DIONASYS, from the Swiss National Science Foundation (SNSF) under grant 155249, and from the French National Research Agency (ANR) under grant ANR-14-CHR2-0004.
REFERENCES
[1] J. Hoebeke, I. Moerman, B. Dhoedt, and P. Demeester, “An overview of mobile ad hoc networks: Applications and challenges,” Communications Network, vol. 3, no. 3, pp. 60–66, 2004.
[2] F. J. Ovalle-Mart´ınez, A. Nayak, I. Stojmenovic, J. Carle, and D. Simplot-Ryl, “Area-based beaconless reliable broadcasting in sensor networks,” Int. J. Sen. Netw., vol. 1, no. 1/2, pp. 20–33, 2006.
[3] A. Qayyum, L. Viennot, and A. Laouiti, “Multipoint relaying for flooding broadcast messages in mobile wireless networks,” in 35th Annual Hawaii International Conference on System Sciences, ser. HICSS, 2002. [4] J. Wu, F. Dai, M. Gao, and I. Stojmenovic, “On calculating
power-aware connected dominating sets for efficient routing in ad hoc wireless networks,” Journal of Commun. and Net., vol. 4, no. 1, pp. 59–70, 2002. [5] J. Cartigny and D. Simplot, “Border node retransmission based prob-abilistic broadcast protocols in ad-hoc networks,” Telecommun. Syst., vol. 22, no. 1-4, pp. 189–204, Jan. 2003.
[6] J. Wu and W. Lou, “Extended multipoint relays to determine connected dominating sets in MANETs,” in 1st Annual IEEE Communications Society Conference on Sensor and Ad Hoc Communications and Networks, ser. SECON, 2004.
[7] I. Stojmenovic, M. Seddigh, and J. Zunic, “Dominating sets and neighbor elimination-based broadcasting algorithms in wireless networks,” IEEE Trans. Parallel Distrib. Syst., vol. 13, no. 1, pp. 14–25, Jan. 2002. [8] Y. Yi, M. Gerla, and T.-J. Kwon, “Efficient flooding in ad hoc networks:
A comparative performance study,” in IEEE International Conference on Communications, ser. ICC, 2003.
[9] B. Garbinato, A. Holzer, and F. Vessaz, “Context-aware broadcasting approaches in mobile ad hoc networks,” Computer Networks, vol. 54, no. 7, pp. 1210–1228, 2010.
[10] P. Ruiz and P. Bouvry, “Survey on Broadcast Algorithms for Mobile Ad Hoc Networks,” ACM Comp. Sur., vol. 48, no. 1, pp. 1–35, 2015. [11] F. Dai and J. Wu, “Performance analysis of broadcast protocols in ad
hoc networks based on self-pruning,” in IEEE Wireless Communications and Networking Conference, ser. WCNC, 2004.
[12] S.-Y. Ni, Y.-C. Tseng, Y.-S. Chen, and J.-P. Sheu, “The broadcast storm problem in a mobile ad hoc network,” in 5th Annual ACM/IEEE International Conference on Mobile Computing and Networking, ser. MobiCom, 1999.
[13] M. ˇCagalj, J.-P. Hubaux, and C. Enz, “Minimum-energy broadcast in all-wireless networks: NP-completeness and distribution issues,” in 8th Annual International Conference on Mobile Computing and Networking, ser. MobiCom, 2002.
[14] J. Wu and W. Lou, “Forward-node-set-based broadcast in clustered mobile ad hoc networks,” Wireless Communications and Mobile Computing, vol. 3, no. 2, pp. 155–173, 2003.
[15] F. G. Nocetti, J. S. Gonzalez, and I. Stojmenovic, “Connectivity based k-hop clustering in wireless networks,” Telecommunication Systems, vol. 22, no. 1, pp. 205–220, 2003.
[16] A. Varga and R. Hornig, “An overview of the OMNeT++ simulation environment,” in 1st International Conference on Simulation Tools and Techniques for Communications, Networks and Systems, ser. Simutools, 2008.
[17] M. Penrose, Random Geometric Graphs. Oxford University Press, 2003. [18] I. Rhee, M. Shin, S. Hong, K. Lee, S. J. Kim, and S. Chong, “On the levy-walk nature of human mobility,” IEEE/ACM Trans. Netw., vol. 19, no. 3, pp. 630–643, Jun. 2011.
[19] R. C. Browning, E. A. Baker, J. A. Herron, and R. Kram, “Effects of obesity and sex on the energetic cost and preferred speed of walking,” Journal of Applied Physiology, vol. 100, no. 2, pp. 390–398, 2006. [20] BROADCOM. (2016, September) BCM4329 datashet. [Online].