Publisher’s version / Version de l'éditeur:
Vous avez des questions? Nous pouvons vous aider. Pour communiquer directement avec un auteur, consultez la première page de la revue dans laquelle son article a été publié afin de trouver ses coordonnées. Si vous n’arrivez pas à les repérer, communiquez avec nous à [email protected].
Questions? Contact the NRC Publications Archive team at
[email protected]. If you wish to email the authors directly, please see the first page of the publication for their contact information.
https://publications-cnrc.canada.ca/fra/droits
L’accès à ce site Web et l’utilisation de son contenu sont assujettis aux conditions présentées dans le site LISEZ CES CONDITIONS ATTENTIVEMENT AVANT D’UTILISER CE SITE WEB.
Building Research Note, 1967-12-01
READ THESE TERMS AND CONDITIONS CAREFULLY BEFORE USING THIS WEBSITE.
https://nrc-publications.canada.ca/eng/copyright
NRC Publications Archive Record / Notice des Archives des publications du CNRC :
https://nrc-publications.canada.ca/eng/view/object/?id=84429d68-44e8-4897-84a4-2a0023f79329 https://publications-cnrc.canada.ca/fra/voir/objet/?id=84429d68-44e8-4897-84a4-2a0023f79329
NRC Publications Archive
Archives des publications du CNRC
This publication could be one of several versions: author’s original, accepted manuscript or the publisher’s version. / La version de cette publication peut être l’une des suivantes : la version prépublication de l’auteur, la version acceptée du manuscrit ou la version de l’éditeur.
For the publisher’s version, please access the DOI link below./ Pour consulter la version de l’éditeur, utilisez le lien DOI ci-dessous.
https://doi.org/10.4224/40000647
Access and use of this website and the material on it are subject to the Terms and Conditions set forth at
The electrical heating effect in Dunmore sensors
Hedlin, C. P.; Handegord, G. O.; Nicholson, R. G.
C A N A D A S er TH1 B92 no.
61
c. 2r*
1.
rn
.-r""b
lor*
\
y q ~ ~ e
i'J1:
w 1 . I
Pva
-
3 q r -w,._,
4
I
9 THE E L E C T N C A L HEATING E F F E C TIN
D U i W O R E SENSORS C. P. H e d i n , G. 0. Handegord andR.
G.
N i c h o l s o n33
J'
.?
3
D I V I S P O N O F BUILDING R E S E A R C H N A T I O N A L R E S E A R C H C O U N C l L O T T A W A-
C A N A D ATHE ELECTRICAL HEATING E F F E C T
IN
DUNMORE SENSORSby
C.
P. Wedlin, G. 0. Handegord and R, G. NicholsonHEATING D U E TO MEASURING CURRENT
IN
DUNMORE SENSORSHumidity sensors of t h e D u n m o r e t y p e require that a voltage b e
applied to a thin hygroscopic film t o determine the electrical resistance.
This procedure results in an increase in film temperature through
electric heating which, if not ~ e c o g n i z e d , m a y lead to e r r o r s which a r e significant in pr w i s e rnea sur ement applications.
The
temperature rise of t h e sensor depends on the measuring v o l t a g e and current, and the rate of heat dissipation t o the surroundings.In an attempt to evaluate these factors, s e r i e s of experiments w e r e
conducted using two different measuring circuits and c o m m e r c i a l l y
available sensors with and without protective casings shielding the
active surface.
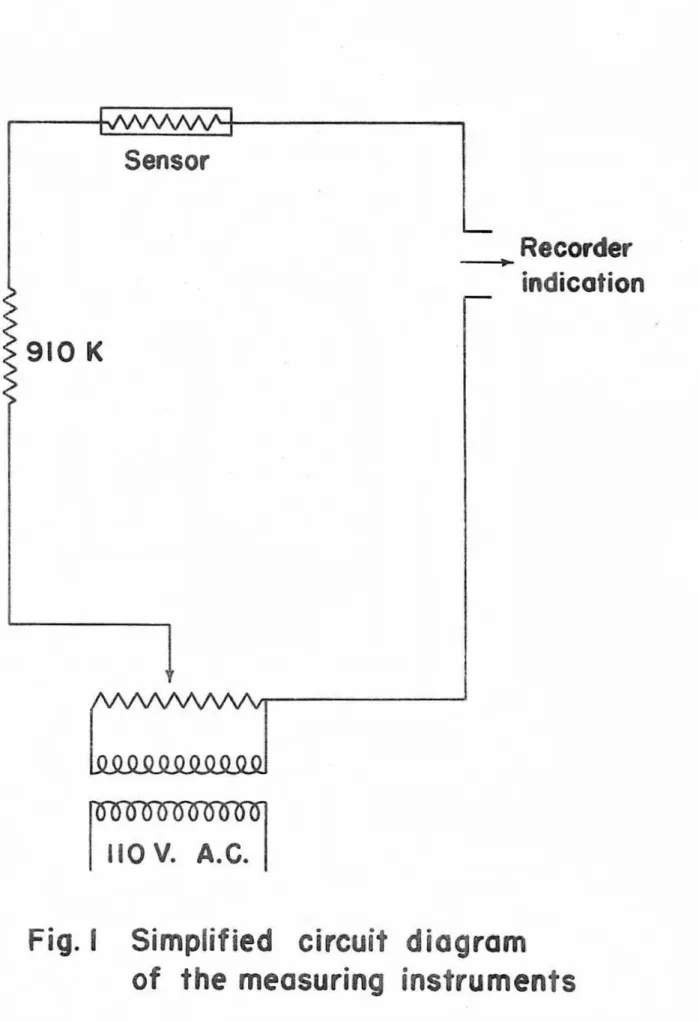
MEASURING INSTRUMENTS
F i g u r e 1 shows a simplified electrical circuit diagram which
adequately describes the operation of the measuring instruments f o r
t h e purposes of t h i s investigation. The c i r c u i t includes a 910 K r e s i s t o r
a n d auxiliary components i n s e r i e s with the humidity sensor. The e l e c
-
trical resistances of t h e auxiliary components have been d i s r e g a r d e d , asthey a r e small compared to those of the resistor and t h e sensor. It is
supposed that the total voltage d r o p occurs across the sensor (E ) and
S
the fixed r e s i s t o r <E ).
R
Two measuring instruments were used, one applying approxi-
m a t e l y 3 2 v o l t s t o t h e s y s t e m and the other 1 1 0 v o l t s . The amounts of
heating for each instrument have been calculated f o r a range of sensor
r e s i s t a n c e (R ) and a r e plotted in F i g u r e 2 . The heating effect is small
at l o w rresistaxces, increases to a peak, and falls t o a l a w value in the
high resistance region. Further, it is evident that t h e heating caused b y the 32 -volt instrument is much smaller than that of the higher v o l t a g e
EUMIDITY
SENSORS
Two effects are involved in the sensor heating-humidity
indication relationship. There i s a character is t i c decrease in the
resistance due to the properties of the film and an increase in r e s i s t - ance due to the localized d r o p in relative h w i d i t y resulting f r o m the
increase in t e m p e x a h r e at the film surface. The l a t t e r e f f e c t is the
mare pronounced and the final result is an indication of relative humidity
lower than that of t h e ambient space. T h e net result is illustrated in
F i g u r e 3, w h e r e the change from t. to t . C A t at constant v a p o r pressure
1 1
cosr esponds t o a decrease in the !'localrt relative h m i d i t y (at film
t e m p e r a t u r e ) f r o m
8 .
to fl a n d a c h a n g ein
sensor resistance from1 fi
Ri to Rf.
T h e
apparent relative humidity,pa,
is the value observedwhen t h e r i s e in sensor temperature is disregarded, In this report,
the 'kcr ror1' is taken t o be the difference between the correct relative
humidity,
li,
andthe
apparent r e l a t i v e humidity.RESULTS
Experiments were c a r r i e d o u t in an atmosphere- producer
(1) and i n a two-pr essure s y s t e m (2) t o find t h e e r r o r that would exist if the h e a t i n g were ignored. Both of &ese humidity producers are used
regularly in calibrating sensors of this type. A sensor was allowed to come to equilibrium in the conditioned space and then connected to t h e
measuring instrument, Examples of the ensuing change in sensor
resistance with time are shown in F i g u r e 4 f o r a sensor located in t h e
t w o - p r e s s u ~ e systeril, f o r the t w o measuring instruments. The time
required for equilibrium to be reached was found in a number of t e s t s
to b e about 1 0 rnin.
h the f i r s t s e t of experiments, a pair of 4 0 gauge copper constantan thermocouples w e r e mounted inside a calibrated s e n s o r of tubular form,
and u s e d in a four-junction thermopile, the other two junctions being located in the surrounding air.
In
this way, A t could b e measured. Thesensor w a s placed in the two-pressure system and experiments c a r r i e d
out a t a series of relative humidities: and hence diff ex ent sensor resistances
at 7 0 " F. Table I contains t h e results. All the variables w e r e defined
e a r l i e r except
Q
C'
which is the local or f i l m relative humidity calculatedu s i n g t h e known vapor pressure and the saturation pressure at t . f A t .
U s i n g values in Table
I,
A t has been plotted against sensor resistance in Figure 5 and follows the s a m e pattern as would b epredicted on the basis of t h e calculated sensor heating values s h a m
in Figure 2. Also, thevalues of (Ia r e i n m o s t c a s e s in good a g r e e -
f
rnent with t h e values (J C calculated with the measured sensor temp-
e x atur e. This supports the view that t h e change i n sensor resistance is
p r i m a r i l y due to the heating effect of the ins truhnent current and that o t h e r effects (if any) caused by application of a v o l t a g e to the sensor
either take p l a c e s o r a p i d l y that they a r e undetected or are relatively
insignificant.
The conditions employed
-
a high voltage instrument, lowventilation rate, and low pressure (approximately 113 atm)
-
w e r ep u r p o s e l y selected t o g i v e a large, easily m e a s u r e d heating effect, A second group of t e s t s made at about 5 0 per cent
R.
H.,
using t h eatmosphere producer, w h e r e a m u c h higher air flaw rate exists, showed
an e f f e c t only about one-third as large as those in Table I. A l s o tests
made with a 32-volt measuring instrument g a v e a much s m a l l e r effect.
A s anticipated, t h e s e amounted to only 1 0 t o 20 per cent of those of
the I 1 0 -volt instrument.
A f i n a l series of experiments w a s c a r r i e d out t o determine the
effect of a i r movement on the e r r o r . A sensor was mounted on t h e end
of an a r m
which
could be rotated at the d e s i r e d rate. The electricalleads were connected through
a
pair of r o t a r y contacts t a the electricalhygrometer controller. The r o t a t i n g a r m was mounted inside an
e n c l o s u r e 24 in. i n diameter and 14 in. deep, in which the temperature
and humidity w e r e closely controlled. As is shown in Table 11, the
a i r
-
sensor velocity was v a r i e d between 4 0 and 65 0 f . p. m. For one s e r i e s
of o b s e r v a t i o n s the protective casing w a s on the s e n s o r ; f o r another series
it w a s removed, leaving the active surface f u l l y exposed to the air. In
o r d e r t o check the accuracy of measuring t h r o u g h the rotary contacts, a
fixed r e s i s t o r was used in place of the sensor and the r e s i s t a n c e was
m e a s u r e d at several rates of rotation. T h e difference between the measured and actual resistance w a s found t o be negligible.
T h e t e s t s in t h e s e experiments w e r e made at relative humidities b e t w e e n 2 5 and 7 0 per cent.
It
should b e mentioned that the error inrelative humidity f o r a g i v e n cha-nge in sensor t e m p e r a t u r e is proportional
to the relative humidity itself. F o r example, a t 7 0 F , a change of 1F" r e s u l t s in an e r r o r of 0.84 per cent R.H. at 2 5 p e r c e n t R . H . , but 3 . 3 5 p e r cent a t 100 per cent R . H.
"Cold sensort' results, that is, results obtained b e f o r e a s e n s o r heating had t i m e to affect the measured values, w e r e obtained b y taking
a reading immediately after connecting the sensor to the measuring
instrument.
The
values obtained by the two measuring instruments w e r e n e a r l y the same in a l l of the c a s e s in which they w e r e compared. Thus, though in some cases the resistance increases quite rapidly due to s e n s o rheating, it i s possible to obtain a c c u r a t e results c o ~ r e s p a n d ~ g to the cold
condition of the sensor. Because of t h e wide variation of the "'hotTr sensor
results, and because of the added trouble of measuring the sensor temper-
ature, it appears preferable to take measurements at the cold condition
when possible.
CONCLUSIONS
The self heating of Dunrnor e -typ e humidity sensors when used with
s o m e i n s t r u m e n t s can cause significant e r r o r
in
the measured results.The effect i n c r e a s e s a s t h e measuring instrument voltage
is
increasedand a l s o as the rate of air flaw decreases; it may cause a r i s e in sensor temperature of a s much a s
IF".
Experiments w e r e carried out with a variety of air-blow conditions. The maximum errors wexe found to occurwhen a h i g h voltage measuring instrument was u s e d with a sensor having
a p r o t e c t i v e casing and with low r a t e of a i r - f l o w .
This
represents anextreme s e t of conditions. W i t h a l o w v o l t a g e instrurnen;t and a higher
r a t e of air-flow, the heating effect d o e s not exceed a few tenths per c e n t
relative humidity and can generally b e d i s r e g a r d e d .
In general, if p r e c i s e results are required, it is necessary to
c o n s i d e r that this e f f e c t may exist and t o avoid it by making the rneasure-
rnent at the c o l d condition of the sensor or, alternatively, to a p p l y a
suitable c o r r e c t i o n based on m e a s u r e d sensor temperature. REFERENCES
1. Till, C.
E.
and 6 . 0. Handegord. P r o p o s ed humidity standard.Transactions ASHRP,E
6 6 ,
1 9 6 0 , p. 288-306.2 . Hedlin,
C.
P. A device f o r calibrating humidity sensors. M a t e r i a l s-
TABLE I
E F F E C T O F SENSOR HEATING ON INDICATED R E L A T I V E HUMIDITY
AND SENSOR T E M P E R A T U R E
R . 1 ( m e g . ) Rf(rneg. )
8 .
1
g
a?*
A t"F
9
C&
Obtained b y a temperature c o r r e c t i o n of approximately
- 0 . 17 per cent R.H. / F a to
9
.
P E R C E N T A G E RELATIVE HUMIDITY ERROR
F O R
5-MIN. TESTS FOR A RANGE O F SENSOR-AIR VELOCITIESAMBIENT R E L A T I V E HUMIDITY 66 P E R C E N T Sensor-Air V e l o c i t y f . p. m. 40 7 5 125 220 4 5 0 1650 Protective casing in p l a c e 1- 5 1 - 3 1 . 2 1 . 0 0.