Comparison of microearthquake locations using seismic interferometry principles
Gabriela Melo∗, Alison Malcolm, and Michael Fehler
Earth Resources Laboratory - Earth, Atmospheric, and Planetary Sciences Department - MIT SUMMARY
Mapping, localization, and general characterization of prob-lems in reservoir fracture systems is one of the most important in oil, gas, and geothermal energy production. One way to study and monitor these fracture systems is to analyze the mi-croearthquakes triggered during hydraulic fracturing or stim-ulation, as these events generally occur along newly created and preexisting fractures. Thus, the location of the microseis-mic events can be used to characterize the properties of the fracture system. There are many different methods for local-izing microearthquakes and, in general, these methods yield different locations, velocity models, and event origin times, due to differences in algorithms and input models. This makes it very difficult to know which one gives the most accurate and consistent results in practice. The goal of this work is to use basic concepts from seismic interferometry for estimat-ing constraints on the P and S traveltimes between two mi-croearthquake locations. Information obtained through seis-mic interferometry pertains to only the Earth parameters be-tween two receivers or, by reciprocity, two sources. This in-formation is also less dependent on the velocity model, and less susceptible to errors in arrival time picking and noise in the data due to averaging over receivers. This information can then be used to evaluate and compare different sets of results obtained through different localization methods. Here we il-lustrate this comparison method by comparing localization re-sults from two different methods. For our data set, in partic-ular, seismic interferometry cannot give hard constrains but it gives bounds that can be used to asses results from different localization methods.
INTRODUCTION
The general characterization of a reservoir fracture system is one of the most important aspects of energy production. Mi-croearthquakes triggered during hydraulic stimulation/fracturing generally occur along newly created and preexisting fractures. Therefore, these microearthquakes allow for locating and char-acterizing reservoir fracture systems and are also a source of other important information that can be used, for example, in reservoir imaging and inversion for physical parameters. How-ever, accurate localization of the microearthquake hypocen-ters still remains an active area of research. There are several different types of localization methods (e.g., Geiger (1912); Waldhauser and Ellsworth (2000); Zhang and Thurber (2003) and references therein) and, in general, they result in different sets of locations due to for example, noise in the data, errors in traveltime picking, and uncertainties and differences in the velocity models. In practice, unfortunately, there is no feasible way to exactly check which locations are correct. The idea we
propose is to use the inter-event traveltime estimates obtained through seismic interferometry (SI) to evaluate the quality of a set of locations and velocity model, since, if correct, they must be consistent with these interferometric traveltimes.
Seismic interferometry is a technique commonly used to es-timate the Greens function (GF) between two receiver loca-tions, as if there were a source at one of the receiver locations (e.g., Claerbout (1968); Calvert et al. (2004); Wapenaar and Fokkema (2006); Curtis et al. (2006)). By crosscorrelating the recorded seismic signals at two locations for many sources we generate a crosscorrelogram. Stacking the crosscorrelogram over sources generates an estimate of the inter-receiver GF, the interferometric GF (also referred to as empirical GF (EGF)). While most applications of SI estimate the GF between two receivers surrounded by sources, Curtis et al. (2009) show, us-ing reciprocity, that it is also possible to use SI to estimate the GF between a pair of sources, which we shall here refer to inter-event GF. Poliannikov et al. (2011) use inter-event trav-eltimes to relocate microearthquakes within a cluster. Here we use inter-event traveltime estimates to compare different event locations.
The occurrence of reservoir microearthquakes is normally as-sociated with fluid flow and pressure diffusion in fracture sys-tems, which are generally continuous. Thus, to compare dif-ferent sets of locations obtained from difdif-ferent methods and/or model parameters, one commonly relies on aspects such as event clustering, collapsing of event locations on planes (thus being associated with propagating fractures or reactivated faults), correlation between hypocenters and local formation geology, correlation between hypocenters and velocity heterogeneities, etc (Fehler et al., 1987). In general, localization algorithms jointly perform tomography and event location, leading to dif-ferent hypocenter locations, event origin times, and velocity models. Based on these origin times, one can use SI to esti-mate the physical traveltimes between microquake locations, and not just relative times, since information obtained through SI is well localized, i.e., between two sources, and less de-pendent on the velocity model (Borcea et al., 2005). In ad-dition, this information is less susceptible to errors in arrival time picking and noise in the data due to the averaging over receivers. If correct, the set of parameters (locations, origin times, and velocity model) from each method must be consis-tent with the interferometric traveltimes. Following this idea, here we propose an additional way to compare different mi-croearthquake hypocenter locations obtained through differ-ent methods. First, we use basic principals from seismic in-terferometry to estimate P and S wave traveltimes between two microearthquake hypocenters. Then, for each of these hypocenter pairs and for each set of location results, we es-timate inter-event P and S wave traveltimes based on the loca-tions estimated from each method and the velocity model. Fi-nally, we compare the interferometric with the method/model
dependent traveltime estimations, to evaluate the consistency of each method.
As with all interferometric methods, precise interferometric traveltimes can only be estimated for pairs of events for which there is a receiver along the stationary path (Snieder, 2004). However, because of the sparse receiver coverage in the field data we use here to test the method, the actual physical trav-eltimes between two locations are greater than or equal to the interferometric traveltimes. We use this as a measure of con-sistency; accurate results should yield inter-event traveltime estimates greater or equal to the interferometric traveltimes. This will be discussed in more detail in the next section.
−5 0 5 −6 −4 −2 0 2 4 6 X (Km) Y (Km) −6 −4 −2 0 2 4 6 0 1 2 3 4 5 6 X (Km) Z (Km) −6 −4 −2 0 2 4 6 0 1 2 3 4 5 6 Y (Km) Z (Km)
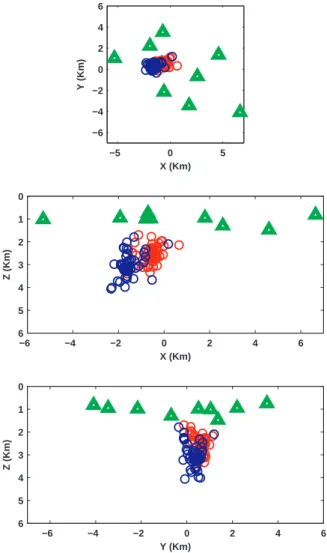
Figure 1: Two-dimensional standard XY -, X, and Y Z-planes projections of a microearthquake cluster. Blue circles correspond to the locations obtained through method 1 and red circles correspond to the locations obtained through method 2. Green triangles are station locations.
In the following section we review how to calculate interfero-metric traveltimes between microearthquakes. Then we present the comparison between two different sets of locations of mi-croearthquakes field data from a geothermal reservoir. The first
set of locations was obtained through a simple standard local-ization method based on Geiger’s method (Geiger, 1912) us-ing a simple 1D velocity model. The second set was obtained through a joint tomography-localization method (Block et al., 1994). This method uses the locations and velocity model from the previous method as a starting point. Then, it jointly calcu-lates the microearthquake hypocenter parameters while build-ing a more refined 3D velocity model. We show how the lo-cations and respective parameters of one model are more self-consistent than the other.
INTER-EVENT INTERFEROMETRIC TRAVELTIMES Here we review how to obtain inter-event traveltime estima-tions through seismic interferometry. Some preliminary re-sults about performing SI between sources for the field data used here can be found in Melo and Malcolm (2011). In this work, we study and compare two sets of localization results for a cluster of 55 events from a microseismic dataset from a geothermal field. The first set of results are obtained through a simple standard localization method based on Geiger’s method (Geiger, 1912) that, for simplicity, we shall refer to as method 1. The second set of results are obtained through a joint tomography-localization method (Block et al., 1994) that we shall refer to as method 2. Figure 1 shows 2D projections of this cluster for the two sets of locations, where blue circles are locations from method 1 and red circles are locations from method 2. The station locations are represented by the green triangles. Events in the red cluster are generally shifted up and east in comparison to the events in the blue cluster. We now estimate traveltimes between pairs of microearthquakes using SI principles, as described below.
As previously mentioned, interferometric traveltimes can only be estimated for pairs of events for which there is a receiver along the stationary path (Snieder, 2004). In our case, all the stations are above the sources, so in order to be at a station-ary path with respect to the stations, the events of a given pair must be approximately vertically aligned. Another require-ment for SI between microearthquakes is that the waveforms for the event pair be correlated (Curtis et al., 2009). We thus use these two criteria to select a pair of events: a minimum correlation between the waveforms and enough stationarity in the crosscorrelogram. Since our goal is to estimate traveltime shifts (as opposed to recovering the actual impulse response between the two locations), we accept pairs of events with at least 50 percent correlation. We say that a crosscorrelogram has enough stationarity when there are at least three apparent stationary stations. We define the apparent stationary stations as the ones within the Fresnel zone of the stationary station. Energy from these apparent stationary stations is primarily-in-phase in the crosscorrelogram. Figure 2 shows an example of a crosscorrelogram (top) with stationary energy for all eight sta-tions, and the respective EGF obtained by stacking the cross-correlogram for all receivers. The absolute value of the time lag at which the EGF peaks is an estimate of the inter-event traveltime, i.e., the inter-event interferometric traveltime. Fig-ure 3 shows an example of a crosscorrelogram (top) with no
stationary energy; in this case interferometry cannot be used. A total of 350 event pairs fulfill our quality control.
In order to create the crosscorrelograms one needs to know the origin time of the events. We use the origin times estimated from each of the localization methods to calculate the interfer-ometric traveltimes for each method.
Time (s) Receiver Crosscorrelogram −0.6 −0.4 −0.2 0 0.2 0.4 0.6 2 4 6 8 −0.6 −0.4 −0.2 0 0.2 0.4 0.6 −1 0 1 Interferometric GF Time (s) Amplitude
Figure 2: Crosscorrelogram (top) with stationary energy for all stations and respective EGF (bottom). The stationary energy in the crosscorrelogram allows us to obtain the interferometric traveltime. Time (s) Receiver Crosscorrelogram −0.6 −0.4 −0.2 0 0.2 0.4 0.6 2 4 6 8 −0.6 −0.4 −0.2 0 0.2 0.4 0.6 −1 0 1 Interferometric GF Time (s) Amplitude
Figure 3: Crosscorrelogram (top) showing no stationary ergy and respective EGF (bottom). The lack of stationary en-ergy indicates that this pair of events are not at stationary paths and/or do not have sufficiently correlated waveforms.
LOCATION COMPARISONS
For each localization method, we calculate the inter-event trav-eltimes, based on each method’s locations and velocity model,
using an eikonal solver. We do this for all the pairs for which we could estimate the interferometric traveltimes. P-wave trav-eltimes were estimated using the vertical component (window-ing the waveforms around the P-wave arrival time). S-wave traveltimes were estimated using the east and north compo-nents; in general they lead to very similar interferometric trav-eltimes.
Figures 4(a) and 4(b) show the inter-event P- and S-wave trav-eltimes, respectively, obtained through SI plotted against inter-event traveltimes based on locations and velocity model from method 1. Figures 5(a) and 5(b) show the inter-event P- and S-wave traveltimes, respectively, obtained through SI plotted against inter-event traveltimes based on locations and velocity model from method 2. As mentioned previously, it is likely that for many event pairs the actual stationary station is miss-ing. This means that interferometric traveltimes are generally an underestimate of the true inter-receiver traveltime and thus the points in the crossplots should be above the slope-1 line. According to this criteria, we see that results from method one are more self-consistent than results from method 2.
DISCUSSION AND CONCLUSIONS
We presented a method for checking consistency of results from localization methods by comparing inter-event traveltimes obtained through seismic interferometry and from the loca-tions and velocity models for each method. Advantages of using interferometric inter-event traveltimes include less de-pendence on the velocity model between the surface and the two events, and less susceptibility to errors in arrival time pick-ing and noise in the data due to the averagpick-ing over receivers. The main sources of errors in our method are S energy con-tamination in the waveforms used to estimate P wave travel-times and errors in the event origin travel-times. We presented com-parison results for two localization methods that were applied to locate microearthquake events from a geothermal reservoir. Our comparison indicates that, for our dataset, the results from method 1 are more self-consistent than results from method 2. The inconsistency of method 2 could arrive from errors in the locations, velocity model, or event origin times, or any com-bination of these. To narrow down and identify the potential sources of errors one should combine the comparison analy-sis proposed here with the conventional ones, such as event clustering, collapsing of event locations on planes, correlation between hypocenters and local formation geology, correlation between hypocenters and velocity heterogeneities, among oth-ers.
Acknowledgments
We would like to thank Oleg Poliannikov and Pierre Goudard for great suggestions during our discussions. This work is sup-ported by grants from the Department of Energy (DE-FG36-08GO18197) and the founding members consortium at Earth Resources Laboratory (ERL).
0 0.1 0.2 0.3 0.4 0.5 0 0.05 0.1 0.15 0.2 0.25 0.3 0.35 0.4 0.45 0.5 Inter−events P traveltimes SI traveltimes (s) Method 1 traveltimes(s) (a) 0 0.1 0.2 0.3 0.4 0.5 0 0.05 0.1 0.15 0.2 0.25 0.3 0.35 0.4 0.45 0.5 Inter−events S traveltimes SI traveltimes (s) Method 1 traveltimes(s) (b)
Figure 4: P-wave (top) and S-wave (bottom) inter-event travel-times obtained through SI versus inter-event traveltravel-times based on locations and velocity model from method 1. There is a good agreement between method 1 results and SI since the majority for the points SI traveltimes are smaller or equal the traveltimes from method 1.
0 0.1 0.2 0.3 0.4 0.5 0 0.05 0.1 0.15 0.2 0.25 0.3 0.35 0.4 0.45 0.5 Inter−events P traveltimes SI traveltimes (s) Method 2 traveltimes(s) (a) 0 0.1 0.2 0.3 0.4 0.5 0 0.05 0.1 0.15 0.2 0.25 0.3 0.35 0.4 0.45 0.5 Inter−events S traveltimes SI traveltimes (s) Method 2 traveltimes(s) (b)
Figure 5: P-wave (top) and S-wave (bottom) inter-event travel-times obtained through SI versus inter-event traveltravel-times based on locations and velocity model from method 2. Contrary to method 1, many events have interferometric traveltimes greater than traveltimes based on method 2 results, which is the opposite of expected if method 2 results were correct.
REFERENCES
Block, L. V., C. H. Cheng, M. C. Fehler, and W. S. Phillips, 1994, Seismic imaging using microearthquakes induced by hydraulic fracturing: Geophysics, 59, 102–112.
Borcea, L., G. Papanicolaou, and C. Tsogka, 2005, Interfero-metric array imaging in clutter: Inverse Problems, 21, 1419. Calvert, R. W., A. Bakulin, and T. C. Joners, 2004, Vir-tual sources, a new way to remove overburden problems.: EAGE Expanded Abstracts, 2477–2480.
Claerbout, J. F., 1968, Synthesis of a layered medium from its acoustic transmission response: Geophysics, 33, 264–269. Curtis, A., P. Gerstoft, H. Sato, and R. Snieder, 2006,
Seis-mic interferometry - turning noise into signal.: The Leading Edge, 25, 1082–1092.
Curtis, A., H. Nicolson, D. Halliday, J. Trampert, and B. Bap-tie, 2009, Virtual seismometers in the subsurface of the Earth from seismic interferometry: Nature Geoscience, 2, 700 – 704.
Fehler, M., L. House, and H. Kaieda, 1987, Determining planes along which earthquakes occur: Method and appli-cation to earthquakes accompanying hydraulic fracturing: J. Geophys. Res., 92, 9407–9414.
Geiger, L., 1912, Probability method for the determination of earthquake epicenters from the arrival time only: Bulletin of St. Louis University, 8, 60–71.
Melo, G., and A. Malcolm, 2011, Svd enhanced seismic in-terferometry for traveltime estimates between microquakes: SEG Technical Program Expanded Abstracts, 30, 1608– 1612.
Poliannikov, O. V., A. E. Malcolm, H. Djikpesse, and M. Prange, 2011, Interferometric hydrofracture microseism localization using neighboring fracture: Geophysics, 76, WC27–WC36.
Snieder, R., 2004, Extracting the green’s function from cor-relation of coda waves: A derivation based on stationary phase.: Phys. Rev. E, 69, 046610.
Waldhauser, F., and W. L. Ellsworth, 2000, A double-difference earthquake location algorithm: Method and ap-plication to the northern Hayward fault, California: Bulletin of the Seismological Society of America, 90, 1353–1368. Wapenaar, K., and J. Fokkema, 2006, Green’s function
rep-resentations for seismic interferometry.: Geophysics, 71, S133–S146.
Zhang, H., and C. H. Thurber, 2003, Double-difference tomog-raphy: The method and its application to the Hayward fault, California: Bulletin of the Seismological Society of Amer-ica, 93, 1875–1889.