HAL Id: hal-01579657
https://hal.sorbonne-universite.fr/hal-01579657
Submitted on 31 Aug 2017
HAL is a multi-disciplinary open access
archive for the deposit and dissemination of sci-entific research documents, whether they are pub-lished or not. The documents may come from teaching and research institutions in France or abroad, or from public or private research centers.
L’archive ouverte pluridisciplinaire HAL, est destinée au dépôt et à la diffusion de documents scientifiques de niveau recherche, publiés ou non, émanant des établissements d’enseignement et de recherche français ou étrangers, des laboratoires publics ou privés.
transcriptome for the Nile grass rat (Arvicanthis
ansorgei)
Melissa M. Liu, Michael Farkas, Perrine Spinnhirny, Paul Pevet, Eric Pierce,
David Hicks, Donald J. Zack
To cite this version:
Melissa M. Liu, Michael Farkas, Perrine Spinnhirny, Paul Pevet, Eric Pierce, et al.. De novo assembly and annotation of the retinal transcriptome for the Nile grass rat (Arvicanthis ansorgei). PLoS ONE, Public Library of Science, 2017, 12 (7), pp.e0179061. �10.1371/journal.pone.0179061�. �hal-01579657�
De novo assembly and annotation of the
retinal transcriptome for the Nile grass rat
(Arvicanthis ansorgei)
Melissa M. Liu1, Michael Farkas2,3, Perrine Spinnhirny4, Paul Pevet4, Eric Pierce5, David Hicks4*, Donald J. Zack1,6,7,8,9*
1 Wilmer Eye Institute, Johns Hopkins University School of Medicine, Baltimore, MD, United States of America, 2 Department of Ophthalmology, Jacobs School of Medicine and Biomedical Sciences, University at Buffalo, Buffalo, NY, United States of America, 3 Research Service, Veterans Administration Western New York Healthcare System, Buffalo, NY, United States of America, 4 Institut des Neurosciences
Cellulaires et Inte´gratives, CNRS UPR3212, Strasbourg, France, 5 Ocular Genomics Institute, Department of Ophthalmology, Massachusetts Eye and Ear Infirmary, Boston, MA, United States of America, 6 Department of Molecular Biology and Genetics, Johns Hopkins University School of Medicine, Baltimore, MD, United States of America, 7 Department of Neuroscience, Johns Hopkins University School of Medicine, Baltimore, MD, United States of America, 8 McKusick-Nathans Institute of Genetic Medicine, Johns Hopkins University School of Medicine, Baltimore, MD, United States of America, 9 Institut de la Vision, Universite´ Pierre et Marie Curie, Paris, France
*donzack@gmail.com(DJZ);photoreceptor67@hotmail.com(DH)
Abstract
Cone photoreceptors are required for color vision and high acuity vision, and they die in a variety of retinal degenerations, leading to irreversible vision loss and reduced quality of life. To date, there are no approved therapies that promote the health and survival of cones. The development of novel treatments targeting cones has been challenging and impeded, in part, by the limitations inherent in using common rodent model organisms, which are noctur-nal and rod-dominant, to study cone biology. The African Nile grass rat (Arvicanthis
ansor-gei), a diurnal animal whose photoreceptor population is more than 30% cones, offers
significant potential as a model organism for the study of cone development, biology, and degeneration. However, a significant limitation in using the A. ansorgei retina for molecular studies is that A. ansorgei does not have a sequenced genome or transcriptome. Here we present the first de novo assembled and functionally annotated transcriptome for A.
ansor-gei. We performed RNA sequencing for A. ansorgei whole retina to a depth of 321 million
pairs of reads and assembled 400,584 Trinity transcripts. Transcriptome-wide analyses and annotations suggest that our data set confers nearly full length coverage for the majority of retinal transcripts. Our high quality annotated transcriptome is publicly available, and we hope it will facilitate wider usage of A. ansorgei as a model organism for molecular studies of cone biology and retinal degeneration.
a1111111111 a1111111111 a1111111111 a1111111111 a1111111111 OPEN ACCESS
Citation: Liu MM, Farkas M, Spinnhirny P, Pevet P,
Pierce E, Hicks D, et al. (2017) De novo assembly and annotation of the retinal transcriptome for the Nile grass rat (Arvicanthis ansorgei). PLoS ONE 12 (7): e0179061.https://doi.org/10.1371/journal. pone.0179061
Editor: Alfred S. Lewin, University of Florida,
UNITED STATES
Received: March 14, 2017 Accepted: May 23, 2017 Published: July 31, 2017
Copyright:© 2017 Liu et al. This is an open access article distributed under the terms of theCreative Commons Attribution License, which permits unrestricted use, distribution, and reproduction in any medium, provided the original author and source are credited.
Data Availability Statement: The datasets
supporting the conclusions of this article are available in the NCBI Sequence Read Archive (SRA) (https://www.ncbi.nlm.nih.gov/sra/), accession numbers SRR5190211 and SRR5190212, and within the article and its Supporting Information files.
Funding: This work was supported by grants from
the National Institutes of Health (EY009769, EY020902, P30EY001765, P30EY014104, and T32EY007143,https://www.nih.gov/) and the
Introduction
Rod and cone photoreceptors are the light sensitive cells of the retina that enable the detection of visual stimuli. Rods are responsible for vision under dim light conditions, whereas cones mediate color and high acuity vision. Cone photoreceptors degenerate in a variety of eye dis-eases, including age-related macular degeneration (AMD), cone-rod dystrophy, and retinitis pigmentosa (RP). Development of therapeutic strategies promoting the survival of cones in these pathological settings has been challenging, due in part to difficulties inherent in studying cones when using common rodent model organisms. Laboratory mice (Mus musculus) and
rats (Rattus norvegicus) are nocturnal and have rod-dominant retinas, with cones comprising
only ~3% and ~1% ofM. musculus[1] andR. norvegicus[2] photoreceptors, respectively. Thus, these organisms are not ideally suited for studies of cones. With the goal of developing improved small animal models for the study of cones, efforts have been made to identify rodents that contain more cone-enriched retinas. Among the rodent species that have been identified as having cone-enriched retinas are the African Nile grass rat (Arvicanthis ansorgei)
[3] and the 13-lined ground squirrel (Ictidomys tridecemlineatus) [4].
From the experimental perspective,A. ansorgei has the advantage over I. tridecemlineatus in
that it can be more easily maintained in laboratory colonies. Until recently,I. tridecemlineatus
could not be bred under laboratory conditions and thus had to be caught wild. Although a protocol has since been established for maintainingI. tridecemlineatus in laboratory colonies,
there are unique challenges related to caring for animals that undergo months of torpor [5].
A. ansorgei has primarily been studied in the context of circadian rhythms [3]. As its retina is comprised of more than 30% cones, it is suitable as a mammalian model for the study of cone biology and pathology [6]. As one example, the N-methyl-N-nitrosourea (MNU) chemical induced retinal degeneration model has been established inA. ansorgei. Structural and
func-tional studies demonstrate that MNU treatment causes a spatiotemporally reproducible photo-receptor degeneration in theA. ansorgei retina [7]. The pattern of degeneration is one in which rod cell death is followed by cone cell death, a pattern of degeneration that is also seen in human RP. Thus,A. ansorgei is well-suited as a model for molecular studies of cone function
and degeneration and for the identification of cone specific genes, pathways, and mechanisms that promote homeostasis and survival.
A significant hurdle for molecular studies inA. ansorgei, however, is that there is very
lim-ited genome or transcriptome data currently available for this organism. Due to insufficient species specific sequence information, the research community has had to characterize genes of interest one at a time or rely on data fromM. musculus or R. rattus, which generally does
not completely or accurately representA. ansorgei. Especially in the context of cone
photore-ceptor studies, there are likely mechanisms in the diurnalA. ansorgei that would be missed
when basing such studies on information gleaned entirely from nocturnal rod-dominant model organisms.
As of February 2017, there were less than 400 ESTs in the NCBI repository for the entire
Arvicanthis genus, whereas there are 4.9 million ESTs for M. musculus and 1.1 million ESTs
forR. norvegicus. The genus Arvicanthis, which has seven recognized species [8], has no geno-mic sequencing data, and only one RNA sequencing data set has been published, which was for the speciesA. niloticus [9]. Phylogenetic analysis based on both mitochondrial and nuclear genes has revealed that within the genus, there are two main clades, whereA. niloticus is a
member of one, andA. ansorgei is a member of the other [10]. The evolutionary event dividing the genus into these two sister monophyletic subgroups is estimated to have occurred more than 5 million years ago [11]. With respect to diversity at the level of the DNA sequence, analysis of the complete sequence of the highly conserved gene encoding cytochrome b has
Foundation Fighting Blindness (http://www. blindness.org/), unrestricted funds from Research to Prevent Blindness, Inc. (https://www.rpbusa. org), and generous gifts from the Guerrieri Family Foundation and from Mr. and Mrs. Robert and Clarice Smith. The funders had no role in study design, data collection and analysis, decision to publish, or preparation of the manuscript.
Competing interests: The authors have declared
demonstrated that the average degree of sequence divergence between different species of the Arvicanthis genus is 15.5% [11].
To aid in the further development ofA. ansorgei as a useful model for studies of cone
devel-opment, function, and degeneration, we performed RNA-Seq on retinas from adult animals and de novo assembled and annotated the first transcriptome for this species. The assembled and annotated retinal transcriptome is publicly available and will hopefully serve as a resource for downstream molecular studies.
Methods
RNA preparation
All animals were maintained in compliance with the guidelines of the Animal Care and Use Committee of Institut des Neurosciences Cellulaires et Inte´gratives (Chronobiotron UMR 3415). The protocols used in this study were approved by the Comite´ Re´gional d’Ethique en Matière d’Expe´rimentation Animale de Strasbourg (CREMEAS, ethical license reference AL/ 24/31/02/13).A. ansorgei were housed in 22±2˚C rooms under a 12:12 hour light dark cycle,
100 lux white light with lights on at 7 am and lights off at 7 pm. Animals were fed with stan-dard rat chow suppliedad libitum. Young adult (5–6 months) female Arvicanthis (n = 2) were
used for this study. Euthanasia was performed by CO2inhalation, and all efforts were taken to
minimize suffering. Whole retinas were rapidly isolated by cutting across the cornea with a clean scalpel blade followed by retinal extrusion. They were immediately flash frozen in liquid nitrogen and stored at -80˚C until ready for use. Retinas were independently homogenized in Buffer RLT Plus + 1%β-mercaptoethanol, and total RNA was extracted with genomic DNA removal using the RNeasy Plus Mini Kit according to manufacturer’s instructions (Qiagen, Germantown, MD, USA). RNA samples were quantified by the RNA 6000 Nano Kit on the 2100 Bioanalyzer (Agilent, Santa Clara, CA, USA).
RNA-Seq library preparation and sequencing
Two high quality RNA samples were used to prepare independent RNA-Seq libraries using previously described methods [12]. First strand cDNA synthesis was performed with 195 ng total RNA using anchored oligo-dT and SuperScript III First-Strand Synthesis SuperMix (ThermoFisher, Waltham, MA, USA). Second strand cDNA synthesis was peformed using RNase H, DNA Polymerase I, and Invitrogen Second Strand Buffer (ThermoFisher, Waltham, MA, USA). Double stranded cDNA was purified using DNA Clean & Concentrator-5 (Zymo Research, Irvine, CA, USA). Tagmentation was performed using the Nextera DNA Library Preparation Kit (Illumina, San Diego, CA, USA). Tagmented DNA was purified using DNA Clean & Concentrator-5 before Nextera PCR amplification. Libraries were cleaned using Agencourt AMPure XP beads according to manufacturer’s instructions (Beckman Coulter, Brea, CA, USA). Libraries were evaluated by the High Sensitivity DNA Kit on the 2100 Bioana-lyzer. The average size of the library fragments were 705 bp and 561 bp for samples S1 and S2, respectively. They were then sequenced with 93 bp paired ends on an Illumina HiSeq 2000 in high output mode with V3 chemistry.
De novo transcriptome assembly and quantification
FastQC (https://www.bioinformatics.babraham.ac.uk/projects/fastqc/) was used to assess the quality of the sequencing data. Trimmomatic was used to trim adapters and leading or trailing bases with quality score less than 30, and resultant reads less than 25 bp in length were dropped [13]. Trimmomatic was invoked using the command java–jar trimmomatic-0.32.jar PE–
threads 10 –phred33 R1.fastq.gz R2.fastq.gz paired_R1.fastq.gz unpaired_R1.fastq.gz pair-ed_R2.fastq.gz unpairpair-ed_R2.fastq.gz ILLUMINACLIP:/adapters.fa:2:30:8 LEADING:30 TRAILING:30 MINLEN:25. Cleaned paired reads were concatenated across both samples to form combined left.fastq and right.fastq files. The calculate_stats utility from seq_crumbs was used to calculate Q20 and Q30 using the command calculate_stats–c [left.fastq,right.fastq] >
out.txt [14]. Cleaned paired reads were combined across both samples and passed to Trinity for de novo transcriptome assembly with in silico normalization [15]. Trinity was invoked using the command Trinity—seqType fq—max_memory 480G —CPU 48—normalize_reads —left left.fastq—right right.fastq—output out_dir—grid_conf trinity_conf.txt. RSEM, with Bowtie alignment, was used to quantify Trinity assembled transcript abundance in each sam-ple [16]. The Trinity utility was invoked using the command align_and_estimate_abundance. pl—transcripts Trinity.fasta—seqType fq—left paired_R1.fastq.gz—right paired_R2.fastq.gz— est_method RSEM—aln_method bowtie—trinity_mode.
De novo transcriptome functional annotation
TransDecoder was used to search the Trinity assembled transcripts for open reading frames (ORFs) encoding peptides of at least 100 amino acids in length [15]. Trinity transcripts of any length with ORFs homologous to known proteins or containing protein domains were identi-fied by BlastP (v2.2.30) [17] queries against the Swiss-Prot database [18] and HMMER3 [19] queries against the Pfam database [20], respectively. The final TransDecoder-predicted coding regions include those meeting the minimum length criteria and those of any length with BlastP or Pfam homology. Trinotate was then used for functional annotation [15]. The TransDeco-der-predicted coding regions were searched for Pfam protein domains using HMMER3, signal peptides using SignalP 4.1 [21], transmembrane regions using TMHMM [22], rRNAs using RNAMMER [23], homology to known proteins using BlastP (v2.2.30) (E<10−5) against both the Swiss-Prot and the UniRef90 [24] databases, and annotations from gene ontology (GO) [25] and EggNOG [26]. The Trinity transcripts were also searched for homology by BlastX (v2.2.30) (E<10−5) against the Swiss-Prot and UniRef90 database. All annotations were aggre-gated in a final report.
De novo transcriptome evaluation
Trinity transcripts were searched by BlastN and BlastX against the NCBI RefSeq mRNA and protein databases, respectively, for bothM. musculus and R. norvegicus. The percent coverage
along the target transcript or protein was determined using the Trinity provided utility in-voked with the command analyze_blastPlus_topHit_coverage.pl blast_result.outfmt6 Trinity. fasta blast_db [15]. For each Blast hit in the target database, the best matching Trinity tran-script was selected, and the percent of the Blast hit’s length covered by the Trinity trantran-script was determined.
Trinity transcripts were filtered for those with BlastX hits against the Swiss-Prot database and ranked by TPM. Gene Set Enrichment Analysis (GSEA) was used to identify Gene Ontol-ogy (GO) annotations enriched among these Trinity transcripts with mean TPM>1 [27]. Cytoscape [28] and Enrichment Map [28] were used to visualize the results.
Phylogenetic analysis
Multiple sequence alignment of the coding sequence (CDS) of representative genes forA. nilo-ticus and other model organisms was performed with MUSCLE using the UPGMB clustering
Maximum Composition Likelihood model [31] to compute evolutionary distances. These analyses were performed in MEGA6 (v6.06) [32].
Availability of data and materials
The datasets supporting the conclusions of this article are available in the NCBI Sequence Read Archive (SRA) (https://www.ncbi.nlm.nih.gov/sra/), accession numbers SRR5190211 and SRR5190212, and within the article and its Supporting Information files.
Results
Two RNA samples, S1 and S2, with RNA Integrity Numbers (RINs) of 9.8 and 9.7 (S1 Fig) were independently extracted from the retinas of adultA. ansorgei. RNA-Seq libraries with
broad fragment length distributions peaking at 500–600 bp (S2 Fig) were prepared and se-quenced to a depth of 155,722,626 and 165,504,305 pairs of reads. FastQC confirmed adequate per base sequence quality (S3 Fig). After trimming adapters and low-quality bases, 151,032,789 and 161,439,517 cleaned pairs of reads remained. Ultimately, 312,472,306 pairs of reads were passed to Trinity for de novo transcriptome assembly. Trinity assembled 400,584 transcripts and 356,299 unigenes (Table 1). The Trinity transcripts had a mean length of 801 nt and a N50 length of 1,457 nt, meaning 50% of assembled bases are part of Trinity transcripts of length
Table 1. A. ansorgei transcriptome assembly statistics. RNA-Seq reads
Pairs of raw reads 321,226,931
Pairs of cleaned reads 312,472,306
Q20 98.3%
Q30 92.1%
Trinity assembly
Total Trinity genes 356,299
Total Trinity transcripts 400,584
Total assembled bases 324,826,766
Percent GC 47.2
N50 length 1,457
Average length 811
Median length 401
Q30: Percent of bases in cleaned reads with quality score 30 or greater; N50: length of longest Trinity transcript such that 50% of bases are in Trinity transcripts of length N50 or greater.
https://doi.org/10.1371/journal.pone.0179061.t001
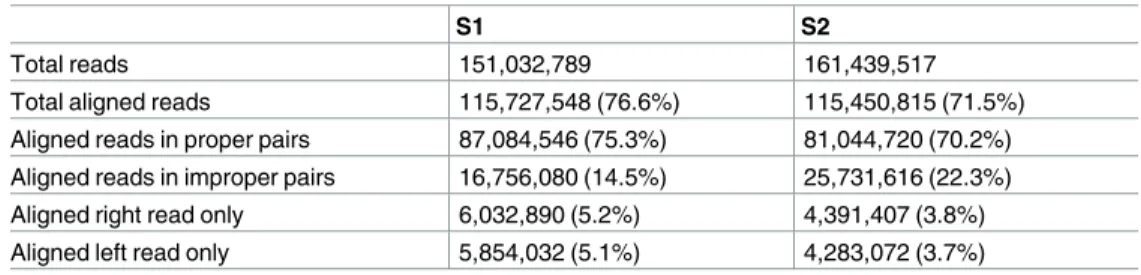
Table 2. RNA-Seq read alignment statistics.
S1 S2
Total reads 151,032,789 161,439,517
Total aligned reads 115,727,548 (76.6%) 115,450,815 (71.5%)
Aligned reads in proper pairs 87,084,546 (75.3%) 81,044,720 (70.2%)
Aligned reads in improper pairs 16,756,080 (14.5%) 25,731,616 (22.3%)
Aligned right read only 6,032,890 (5.2%) 4,391,407 (3.8%)
Aligned left read only 5,854,032 (5.1%) 4,283,072 (3.7%)
Proper pair: left and right reads map to a single Trinity transcript in the correct orientation. https://doi.org/10.1371/journal.pone.0179061.t002
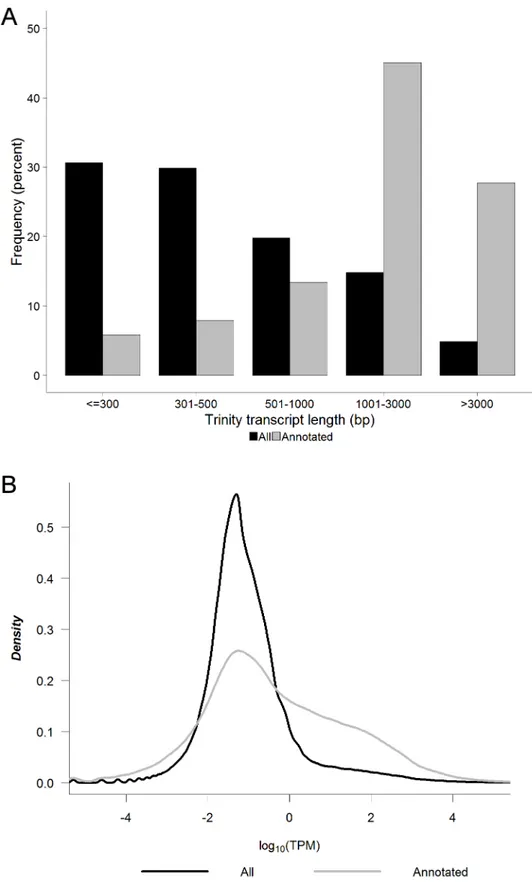
Fig 1. Trinity transcript length and level of expression. A) Length and B) average level of expression between S1 and S2 in units of log10(TPM) (TPM = transcripts per million) for all Trinity transcripts (n = 400,584) and the subset of Trinity transcripts with Swiss-Prot BlastX homology (n = 63,242). https://doi.org/10.1371/journal.pone.0179061.g001
1,457 nt or greater. There were 69,664 Trinity transcripts with open reading frames of at least 100 amino acids in length, corresponding to 38,908 unigenes, of which 29,716 had a single transcript and 9,192 had multiple transcripts.
Functional annotation for the Trinity transcripts was performed using the Trinotate anno-tation pipeline. TransDecoder was used to predict coding regions, which were then searched for Pfam protein domains, signal peptides, transmembrane regions, rRNAs, homology to known proteins in both the Swiss-Prot and the UniRef90 databases, and gene ontology (GO) annotations. The Trinity transcripts were also searched for BlastX homology against the Swiss-Prot and UniRef90 database. Alignment of the RNA-Seq reads to the de novo assembled tran-scriptome was evaluated. Expression levels of Trinity assembled genes and transcripts were estimated in units of TPM (transcripts per million) using RNA-Seq by Expectation Maximiza-tion (RSEM) with Bowtie as the alignment algorithm. The majority of reads aligned to the transcriptome and in proper pairs (Table 2). The sequences, full annotations, and expression levels for the Trinity assembled de novo transcripts are available as Supporting Information files (S1 FileandS2 File).
We next examined the length and level of expression of the identified transcripts. Of the 400,584 assembled Trinity transcripts, 78,915 (19.7%) were greater than 1kb in length, and of the subset of 63,242 Trinity transcripts with Swiss-Prot BlastX homology, 46,038 (72.8%) were greater than 1kb in length (Fig 1A). The subset with Swiss-Prot BlastX homology was also more highly expressed, with 35.2% of annotated transcripts being expressed at a level greater than 1 TPM, as compared to only 10.0% of all Trinity transcripts being expressed at this level (Fig 1B). The putative coding transcripts were therefore more likely to be both higher in abun-dance and longer in length than their non-coding counterparts. Pairwise analysis for the 8,866
Fig 2. Phylogenetic analysis for retinal genes. Multiple sequence alignment for the CDS of A) rhodopsin B) short-wave-sensitive opsin 1 C) melanopsin D) cone-rod homeobox for A. niloticus and other model
organisms performed using MUSCLE. The Maximum Composition Likelihood model was used to construct Neighbor-Joining phylogenetic trees.
orthologous genes expressed at a level greater than 1 TPM (A. ansorgei) or 1 FPKM (A. niloti-cus)[9] showed that global gene expression levels were moderately correlated (Pearson correla-tion coefficient = 0.63) between these two members of theArvicanthis genus (S4 Fig).
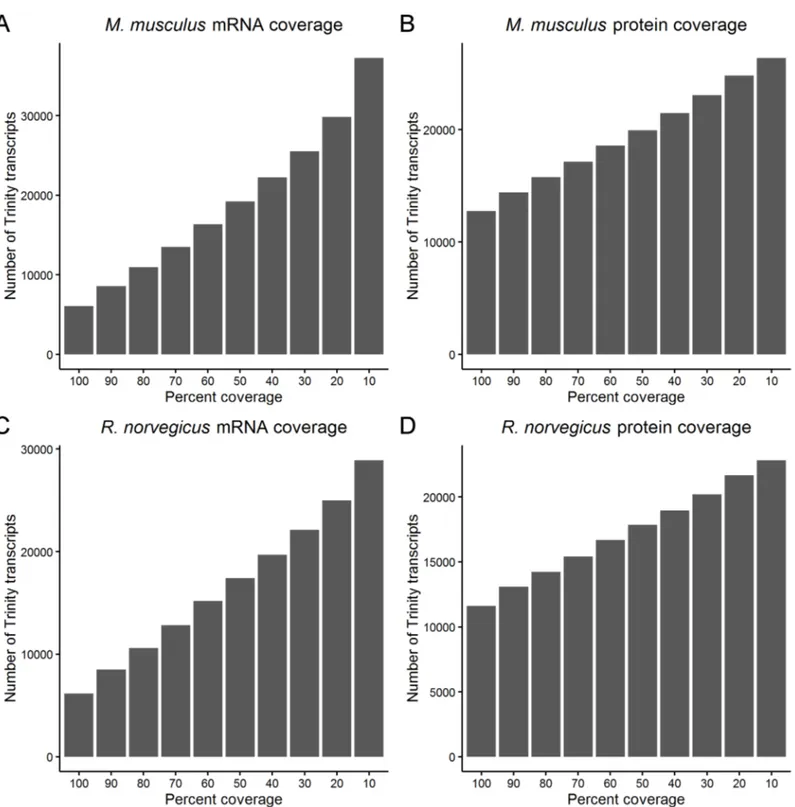
Fig 3. Coverage of M. musculus and R. norvegicus mRNA transcripts and proteins. The coverage of M. musculus A) mRNA and B) protein and R.
norvegicus C) mRNA and D) protein provided by transcripts from the de novo assembled A. ansorgei transcriptome. For a Trinity transcript in bin of percent
coverage n, the Trinity transcript covers at least n-10% of the length of the target mRNA or protein. https://doi.org/10.1371/journal.pone.0179061.g003
Table 3. Trinity transcripts with homology for selected retinal markers. Trinity
transcript
BlastX hit Percent
identity
Hit length
Percent hit aligned
Hit description Average
TPM TR103769|
c1_g1_i4
NP_446140.1 95.18 83 100 retinal cone rhodopsin-sensitive cGMP 3’,5’-cyclic
phosphodiesterase subunit gamma
75.0 TR104093|
c0_g2_i3
NP_446278.2 98.35 424 97.7 pyruvate dehydrogenase kinase, isozyme 1 precursor 4.8
TR107698| c10_g1_i2
NP_001100357.1 97.3 185 91.58 guanylyl cyclase-activating protein 1 287.0
TR107698| c8_g2_i1
NP_001101668.1 96.52 201 100 guanylyl cyclase-activating protein 2 256.1
TR113665| c4_g1_i1
NP_446130.1 96.62 207 60.53 retinal homeobox protein Rx 8.5
TR115337| c4_g5_i3
NP_001102250.2 99.14 350 100 guanine nucleotide-binding protein G(t) subunit alpha-1 1483.6
TR116031| c7_g1_i1
NP_446153.1 97.49 1635 82.53 voltage-dependent L-type calcium channel subunit
alpha-1F
10.3 TR116046|
c3_g2_i3
NP_037133.1 99.76 422 100 paired box protein Pax-6 6.4
TR130418| c8_g2_i3
NP_446283.1 95.67 831 75 retinal guanylyl cyclase 2 precursor 12.5
TR131335| c11_g1_i1
NP_599182.1 100 86 20.87 POU domain, class 4, transcription factor 2 1.3
TR134023| c5_g1_i1
NP_001099506.1 96.64 238 100 neural retina-specific leucine zipper protein 10.5
TR135421| c0_g2_i1
NP_112277.1 96.82 346 100 short-wave-sensitive opsin 1 43.7
TR137704| c6_g9_i2
NP_001101191.1 93.24 518 22.62 retinal-specific ATP-binding cassette transporter 63.9
TR137727| c7_g1_i1 NP_037004.1 94.72 246 100 phosducin 382.4 TR137897| c11_g6_i1 NP_446000.1 96.47 255 71.03 medium-wave-sensitive opsin 1 596.2 TR142441| c12_g1_i1
NP_001099183.1 99.77 442 69.5 protein kinase C alpha type 15.4
TR205210| c0_g1_i1
NP_446240.2 99.65 288 100 syntaxin-1A 2.6
TR55594| c6_g2_i6
NP_112358.1 95.57 564 100 rhodopsin kinase precursor 207.2
TR56231| c0_g1_i2 NP_037069.1 100 202 98.54 beta-crystallin B2 1383.0 TR58523| c4_g1_i2 NP_543177.1 95.79 190 94.06 recoverin 112.1 TR59222| c9_g2_i2 NP_036796.1 99.57 235 76.55 synaptophysin 372.0 TR70411| c9_g2_i6 NP_001101112.1 60.42 141 30.19 tubby-related protein 1 4.8 TR70482| c3_g1_i5 NP_254276.1 94.25 348 100 rhodopsin 4697.7 TR73195| c4_g1_i4
NP_001162599.1 98.89 361 100 visual system homeobox 2 7.9
TR81238| c2_g1_i2
NP_445876.1 99.17 1079 100 electrogenic sodium bicarbonate cotransporter 1 5.8
TR85026| c0_g1_i2
NP_001099744.1 96.21 317 100 retinaldehyde-binding protein 1 187.7
Phylogenetic analysis was performed using the Trinity assembled CDS for four retinal genes in order to placeA. ansorgei in the context of other common model organisms (Fig 2). The topologies of the phylogenetic trees are broadly comparable and placeA. ansorgei in
clos-est proximity toR. norvegicus and M. musculus. Consequently, R. norvegicus and M. musculus
were used as the references for estimating the completeness of theA. ansorgei de novo
assem-bled transcriptome. To perform this analysis, Blast was used to query each Trinity transcript against the RefSeq databases of mRNAs and proteins forM. musculus and R. norvegicus, and
for each hit in the target database, the length of the hit covered by the best matching Trinity transcript was determined (Fig 3).
There are 8,551M. musculus and 8,486 R. norvegicus RefSeq mRNAs that have Trinity
tran-scripts which align with at least 80% coverage, and there are 14,397M. musculus and 13,095 R. norvegicus RefSeq proteins that have Trinity transcripts which translate to cover at least 80% of
their length. We chose 33 canonical retinal cell specific markers and identified their correspond-ing Trinity transcripts. The majority show near full length coverage and sequence identity for the coding sequences of the proteins against which they demonstrate BlastX homology (Table 3). Proteins expected to be highly conserved, for example 40S ribosomal proteins, 60S ribosomal pro-teins, beta actin, and cytochrome c, all demonstrate 100% identity and 100% full length coverage.
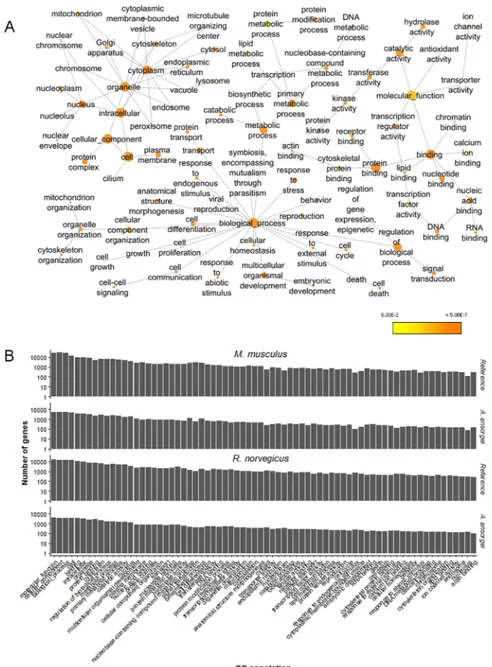
BiNGO was used to identify the GO annotations within the GOSlim subgroup enriched among the Trinity transcripts with Swiss-Prot BlastX homology expressed at greater than 1 TPM usingR. norvegicus as the reference (Fig 4A). The number of genes corresponding to GOSlim annotations with greater than 2% coverage was assessed. Although the absolute number of genes is lower forA. ansorgei than for either the M. musculus reference or the R. norvegicus reference,
the relative rank order for the GO annotation coverage is similar betweenA. ansorgei and both
references (Fig 4B). The top GO annotations are broadly distributed amongst the molecular function, cellular component, and biological process subgroupings.
Discussion
We performed RNA-Seq on adult retinas from the Nile grass ratA. ansorgei and used Trinity
to de novo assemble and functionally annotate the first high quality draft transcriptome of this species. The assembly had an N50 length of 1,457 nt and included 400,584 transcripts, of which 46,038 were greater than 1kb in length and demonstrated Swiss-Prot BlastX homology.
Table 3. (Continued) Trinity
transcript
BlastX hit Percent
identity
Hit length
Percent hit aligned
Hit description Average
TPM TR87913| c0_g1_i1 NP_620215.1 89.66 474 100 melanopsin 3.5 TR88772| c0_g1_i1
NP_001102651.1 100 319 100 transcription factor SOX-2 7.2
TR92173| c5_g2_i2
NP_058987.2 98.9 273 56.88 gamma-aminobutyric acid receptor subunit rho-1
precursor
13.2 TR92173|
c7_g1_i6
NP_058988.1 96.81 408 87.74 gamma-aminobutyric acid receptor subunit rho-2
precursor
4.2 TR93490|
c3_g2_i13
NP_068627.1 99 299 100 cone-rod homeobox protein 13.7
TR99284| c0_g4_i1
NP_114190.1 99.62 261 100 calbindin 3.5
Trinity transcripts were queried using BlastX against R. norvegicus RefSeq proteins. Results reported for selected retinal cell specific markers. https://doi.org/10.1371/journal.pone.0179061.t003
As expected, phylogenetic analysis placedA. ansorgei in closer evolutionary proximity to M. musculus and R. norvegicus than to other common model organisms, including C. porcellus
(guinea pig). Trinity transcripts conferred full or near full length coverage of 14,397M. muscu-lus and 13,095 R. norvegicus RefSeq proteins, including highly conserved housekeeping genes
and retinal cell specific markers. Pairwise comparison of retinal gene expression forA. ansorgei
andA. niloticus showed that global transcriptome profiles were moderately correlated between
these two Arvicanthis genus members.
Fig 4. Enrichment analysis of Gene Ontology annotations. A) Enrichment of GOSlim annotations in the molecular function, cellular component, and molecular process subgroups. Nodes are enriched GO annotations, and their sizes are proportional to the number of genes with which they are associated. Color scale indicates Benjamin-Hochberg False Discovery Rate (FDR) corrected p-value from hypergeometric test for enrichment. B) Number of genes corresponding to GOSlim annotations with greater than 2% coverage for
A. ansorgei as compared to both M. musculus and R. norvegicus references.
Taken together, the findings suggest that our draft transcriptome is high-quality with respect to diversity, contiguity, and coverage. Global scale species specific sequence informa-tion was previously non-existent forA. ansorgei, limiting the capacity for molecular based
studies. TheA. ansorgei retinal transcriptome has now been made publicly available. Our hope
is that it may serve the broader research community and provide a foundation for the use ofA. ansorgei as a model organism for future cellular and molecular investigations related to cone
biology and retinal degeneration and for comparison to other common model organisms, includingM. musculus and R. norvegicus.
Supporting information
S1 Fig. Bioanalyzer RNA 6000 Nano for RNA used for library preparation. A) S1 RIN 9.8;
B) S2 RIN 9.7. (TIF)
S2 Fig. High sensitivity DNA Bioanalyzer for sequenced Nextera RNA-Seq libraries. A) S1;
B) S2. (TIF)
S3 Fig. FastQC per base sequence quality. A) S1 read 1; B) S1 read 2; C) S2 read 1; D) S2 read
2. (TIF)
S4 Fig. Pairwise gene expression comparison betweenA. ansorgei and A. niloticus. 8,866
orthologous genes expressed at a level greater than 1 TPM (A. ansorgei) or 1 FPKM (A. niloti-cus).
(TIFF)
S1 File. Assembled sequences forA. ansorgei retinal transcriptome.
(RAR)
S2 File. Annotations and expression levels for transcripts fromA. ansorgei de novo
assem-bly.
(RAR)
Acknowledgments
Some of the computation work was performed on the Maryland Advanced Research Comput-ing Center (MARCC), which is supported by a State of Maryland grant to Johns Hopkins Uni-versity through The Institute for Data Intensive Engineering and Science (IDIES). The authors would also like to thank the members of the Genomics Core of the Ocular Genomics Institute at Mass Eye and Ear for their experimental assistance.
Author Contributions
Conceptualization: MML DH DJZ. Data curation: MML. Formal analysis: MML. Funding acquisition: MML EP DJZ. Investigation: MML MF PS PP EP DH DJZ.Methodology: MML MF PS PP. Project administration: MML MF EP DH DJZ. Resources: MML MF PS PP EP DH DJZ. Software: MML. Supervision: MML EP DH DJZ. Visualization: MML.
Writing – original draft: MML.
Writing – review & editing: MML MF EP DH DJZ.
References
1. Carter-Dawson LD, LaVail MM. Rods and Cones in the Mouse Retina I. Structural Analysis Using Light and Electron Microscopy. J Comp Neurol. 1979; 188: 245–262.https://doi.org/10.1002/cne.901880204
PMID:500858
2. Szel A, Rohlich P. Two Cone Types of Rat Retina Detected by Anti-visual Pigment Antibodies. Exp Eye Res. 1992; 55: 47–52. PMID:1397129
3. Caldelas I, Poirel VJ, Sicard B, Pe´vet P, Challet E. Circadian profile and photic regulation of clock genes in the suprachiasmatic nucleus of a diurnal mammal Arvicanthis ansorgei. Neuroscience. 2003; 116: 583–591.https://doi.org/10.1016/S0306-4522(02)00654-1PMID:12559113
4. Van Hooser SD, Nelson SB. The squirrel as a rodent model of the human visual system. Vis Neurosci. 2006; 23: 765–78.https://doi.org/10.1017/S0952523806230098PMID:17020632
5. Merriman DK, Lahvis G, Jooss M, Gesicki JA, Schill K. Current practices in a captive breeding colony of 13-lined ground squirrels (Ictidomys tridecemlineatus). Lab Anim. Nature Publishing Group; 2012; 41: 315–325.https://doi.org/10.1038/laban.150PMID:23079915
6. Bobu C, Craft CM, Masson-Pevet M, Hicks D. Photoreceptor organization and rhythmic phagocytosis in the nile rat Arvicanthis ansorgei: A novel diurnal rodent model for the study of cone pathophysiology. Investig Ophthalmol Vis Sci. 2006; 47: 3109–3118.https://doi.org/10.1167/iovs.05-1397PMID:
16799057
7. Boudard DL, Tanimoto N, Huber G, Beck SC, Seeliger MW, Hicks D. Cone loss is delayed relative to rod loss during induced retinal degeneration in the diurnal cone-rich rodent Arvicanthis ansorgei. Neuro-science. Elsevier Inc.; 2010; 169: 1815–1830.https://doi.org/10.1016/j.neuroscience.2010.06.037
PMID:20600653
8. Castiglia R, Bekele A, Makundi R, Oguge N, Corti M. Chromosomal diversity in the genus Arvicanthis (Rodentia, Muridae) from East Africa: A taxonomic and phylogenetic evaluation. J Zool Syst Evol Res. 2006; 44: 223–225.https://doi.org/10.1111/j.1439-0469.2006.00356.x
9. Mustafi D, Kevany BM, Bai X, Golczak M, Adams MD, Wynshaw-Boris A, et al. Transcriptome analysis reveals rod/cone photoreceptor specific signatures across mammalian retinas. Hum Mol Genet. 2016; 25: 4376–4388.https://doi.org/10.1093/hmg/ddw268PMID:28172828
10. Dobigny G, Tatard C, Gauthier P, Ba K, Duplantier J, Granjon L, et al. Mitochondrial and Nuclear Genes-Based Phylogeography of Arvicanthis niloticus (Murinae) and Sub-Saharan Open Habitats Pleistocene History. PLoS One. 2013; 8: e77815.https://doi.org/10.1371/journal.pone.0077815PMID:
24223730
11. Ducroz J-F, Volobouev V, Granjon L. A Molecular Perspective on the Systematics and Evolution of the Genus Arvicanthis (Rodentia, Muridae): Inferences from Complete Cytochrome b Gene Sequences. Mol Phylogenet Evol. 1998; 10: 104–117.https://doi.org/10.1006/mpev.1997.0477PMID:9751921
12. Farkas MH, Grant GR, White J a, Sousa ME, Consugar MB, Pierce E a. Transcriptome analyses of the human retina identify unprecedented transcript diversity and 3.5 Mb of novel transcribed sequence via significant alternative splicing and novel genes. BMC Genomics. 2013; 14: 486.https://doi.org/10.1186/ 1471-2164-14-486PMID:23865674
13. Bolger AM, Lohse M, Usadel B. Trimmomatic: a flexible trimmer for Illumina sequence data. Bioinfor-matics. 2014; 30: 2114.https://doi.org/10.1093/bioinformatics/btu170PMID:24695404
14. seq crumbs. In: Bioinformatics at COMAV [Internet]. [cited 3 May 2016]. Available:https://bioinf.comav. upv.es/seq_crumbs/
15. Grabherr MG, Haas BJ, Yassour M, Levin JZ, Thompson D a, Amit I, et al. Full-length transcriptome assembly from RNA-Seq data without a reference genome. Nat Biotechnol. 2011; 29: 644–652.https:// doi.org/10.1038/nbt.1883PMID:21572440
16. Li B, Dewey CN. RSEM: accurate transcript quantification from RNA-Seq data with or without a refer-ence genome. BMC Bioinformatics. 2011; 12: 323.https://doi.org/10.1186/1471-2105-12-323PMID:
21816040
17. Camacho C, Coulouris G, Avagyan V, Ma N, Papadopoulos J, Bealer K, et al. BLAST+: architecture and applications. BMC Bioinformatics. 2009; 10: 421.https://doi.org/10.1186/1471-2105-10-421PMID:
20003500
18. The UniProt Consortium. UniProt: a hub for protein information. Nucleic Acids Res. 2014; 43: D204–12.
https://doi.org/10.1093/nar/gku989PMID:25348405
19. Eddy SR. Accelerated profile HMM searches. PLoS Comput Biol. 2011; 7.https://doi.org/10.1371/ journal.pcbi.1002195PMID:22039361
20. Finn RD, Coggill P, Eberhardt RY, Eddy SR, Mistry J, Mitchell AL, et al. The Pfam protein families data-base: towards a more sustainable future. Nucleic Acids Res. 2015; 44: D279–D285.https://doi.org/10. 1093/nar/gkv1344PMID:26673716
21. Petersen TN, Brunak S, von Heijne G, Nielsen H. SignalP 4.0: discriminating signal peptides from trans-membrane regions. Nat Methods. Nature Publishing Group; 2011; 8: 785–786.https://doi.org/10.1038/ nmeth.1701PMID:21959131
22. Krogh A, Larsson B, von Heijne G, Sonnhammer ELL. Predicting transmembrane protein topology with a hidden Markov model: Application to complete genomes. J Mol Biol. 2001; 305: 567–580.https://doi. org/10.1006/jmbi.2000.4315PMID:11152613
23. Lagesen K, Hallin P, Rødland EA, Stærfeldt HH, Rognes T, Ussery DW. RNAmmer: Consistent and rapid annotation of ribosomal RNA genes. Nucleic Acids Res. 2007; 35: 3100–3108.https://doi.org/10. 1093/nar/gkm160PMID:17452365
24. Suzek BE, Huang H, McGarvey P, Mazumder R, Wu CH. UniRef: Comprehensive and non-redundant UniProt reference clusters. Bioinformatics. 2007; 23: 1282–1288.https://doi.org/10.1093/
bioinformatics/btm098PMID:17379688
25. Blake JA, Christie KR, Dolan ME, Drabkin HJ, Hill DP, Ni L, et al. Gene ontology consortium: Going for-ward. Nucleic Acids Res. 2015; 43: D1049–D1056.https://doi.org/10.1093/nar/gku1179PMID:
25428369
26. Powell S, Forslund K, Szklarczyk D, Trachana K, Roth A, Huerta-Cepas J, et al. EggNOG v4.0: Nested orthology inference across 3686 organisms. Nucleic Acids Res. 2014; 42: 231–239.https://doi.org/10. 1093/nar/gkt1253PMID:24297252
27. Subramanian A, Tamayo P, Mootha VK, Mukherjee S, Ebert BL, Gillette M a, et al. Gene set enrichment analysis: a knowledge-based approach for interpreting genome-wide expression profiles. Proc Natl Acad Sci U S A. 2005; 102: 15545–50.https://doi.org/10.1073/pnas.0506580102PMID:16199517
28. Shannon P, Markiel A, Ozier O, Baliga NS, Wang JT, Ramage D, et al. Cytoscape: a software environ-ment for integrated models of biomolecular interaction networks. Genome Res. 2013; 13: 2498–2504.
https://doi.org/10.1101/gr.1239303.metabolite
29. Edgar RC. MUSCLE: Multiple sequence alignment with high accuracy and high throughput. Nucleic Acids Res. 2004; 32: 1792–1797.https://doi.org/10.1093/nar/gkh340PMID:15034147
30. Saitou N NM. The Neighbor-joining Method: A New Method for Reconstructing Phylogenetic Trees’. Mol Biol Evol. 1987; 4: 406–425. citeulike-article-id:93683 PMID:3447015
31. Tamura K, Nei M, Kumar S. Prospects for inferring very large phylogenies by using the neighbor-joining method. Proc Natl Acad Sci U S A. 2004; 101: 11030–5.https://doi.org/10.1073/pnas.0404206101
PMID:15258291
32. Tamura K, Stecher G, Peterson D, Filipski A, Kumar S. MEGA6: Molecular evolutionary genetics analy-sis version 6.0. Mol Biol Evol. 2013; 30: 2725–2729.https://doi.org/10.1093/molbev/mst197PMID: