HAL Id: halshs-00559653
https://halshs.archives-ouvertes.fr/halshs-00559653
Preprint submitted on 26 Jan 2011HAL is a multi-disciplinary open access archive for the deposit and dissemination of sci-entific research documents, whether they are pub-lished or not. The documents may come from teaching and research institutions in France or abroad, or from public or private research centers.
L’archive ouverte pluridisciplinaire HAL, est destinée au dépôt et à la diffusion de documents scientifiques de niveau recherche, publiés ou non, émanant des établissements d’enseignement et de recherche français ou étrangers, des laboratoires publics ou privés.
Accumulation in the Black Sea Economic Cooperation
Countries
Marie-Ange Véganzonès-Varoudakis, Ahmet Faruk Aysan, Omer Faruk Baykal
To cite this version:
Marie-Ange Véganzonès-Varoudakis, Ahmet Faruk Aysan, Omer Faruk Baykal. The Effects of Con-vergence in Governance on Capital Accumulation in the Black Sea Economic Cooperation Countries. 2011. �halshs-00559653�
1
C E N T R E D'E T U D E S E T D E R E C H E R C H E S S U R L E D E V E L O P P E M E N T I N T E R N A T I O N A L
Document de travail de la série Etudes et Documents
E 2011.03
The Effects of Convergence in Governance on Capital Accumulation
in the Black Sea Economic Cooperation Countries
Ahmet Faruk Aysan
Boğaziçi University, Department of Economics, Istanbul, Turkey
ahmet.aysan@boun.edu.tr
Omer Faruk Baykal
Kadir Has University, Department of Banking and Finance, and ETDB, Istanbul, Turkey
obaykal@etdb.org
Marie-Ange Véganzonès –Varoudakis CERDI, CNRS, Université Clermont 1, France
veganzones@aol.com
2
Abstract
This paper aims to ascertain the effects of convergence in governance on investment decisions among a sample of 43 developing countries, using dynamic system GMM estimations. In an increasingly interdependent economic world, regions with good governance are considered to be areas of higher investment, as a result of further integration and collaborative action among member states. Since its foundation, in 1992, Black Sea Economic Cooperation (BSEC) countries have gone through a transition process and, to a large extent, this is about institutional transformation. Good governance institutions are an assurance to guarantee property rights and minimize transaction costs, thus creating an environment conducive to investment and growth. In this paper, we investigate the impact of BSEC on its member countries regarding convergence of governance institutions. We show that convergence has occurred within the region with respect to bureaucratic quality, control over corruption, law and order, internal conflict, ethnic tensions, but not to government stability and democratic accountability. The paper also calculates how much capital accumulation the region would gain by reaching the average institutional standards of the EU-12. This study is the first attempt in the BSEC region to investigate the link between regionalization and institutional convergence, at the same time as to quantify its economic impact through investment.
Keywords: System GMM, Governance, Investment, Institutions, Convergence, Black Sea Economic Cooperation.
3 1. Introduction
In an increasingly interdependent economic world, regionalization is considered as a means of more collaboration and further integration among member states. The Black Sea Economic Cooperation (BSEC) project is a regional economic co-operation arrangement established on 25 June 1992 by 11 countries, namely Albania, Armenia, Azerbaijan, Bulgaria, Georgia, Greece, Moldova, Romania, the Russian Federation, Turkey and Ukraine. Currently over 350 million people live in the 20 million km2 of the BSEC region, which is a sizeable market by any criteria. The main aim of BSEC is to develop and diversify existing economic relations among its members, by making efficient use of the advantages arising from their geographical proximity. At the same time, BSEC regionalization is resorted to help transform centrally planned economies, to market economies and democratic regimes. Besides the security and political gains, BSEC countries also aim to improve economic and social integration through converging their governance institutions with the European Union (EU). The BSEC experience may though serve to prepare the necessary conditions for future EU membership.
Good governance institutions are an assurance to guarantee property rights and minimize transaction costs, thus creating an environment conducive to investment and growth. Since its foundation, BSEC countries have gone through a transition process and, to a large extent, this has been about institutional transformation. Although this transformation certainly had a significant impact on the economies, the convergence of the institutions in the region has not been widely studied in the literature. This paper attempts to fill this gap.
4
To fulfill this objective, we first investigated the relation between governance institutions and investment for a sample of 43 developing countries through using dynamic system GMM estimations. Our approach has not been to just focus on specific institutions, but to be as exhaustive as possible in considering the institutional variables. To this end, we have categorized the various types of governance indicators widely used in the literature and grouped them into three categories: administrative quality (AQ), political stability (PS) and democratic accountability (PA) through principal component analysis. We have also formed two more general governance index (GOV1 and GOV2), using most of the information contained in these governance indicators, to check the overall effect of institutions on investment decisions. This categorization has enabled to measure the impact of a significant number of governance institutions. Actually, instead of putting highly correlated variables into the final regressions, or just picking up certain indicators, this paper utilizes all the available information in explaining the investment decisions.
Our empirical results uncover the importance of institutional variables on capital accumulation. This is true for administrative quality (AQ), political stability (PS) and democratic accountability (PA), as well as for the general indices of governance (GOV1 and GOV2). This outcome makes of institutions a powerful engine of growth and confirms that institutions are part of the convergence of the economies. This result is all the more important in the context of the BSEC countries, where the scope for enhancement of governance institutions is still significant.
This result has been related to the second objective of the paper, which is to investigate the impact of BSEC on the convergence of governance in the region. We
5
observe two types of convergence: the convergence within the BSEC region and the convergence toward the EU-12. This convergence has surely participated in the significant economic performances achieved in the region. Considering the possible adhesion of some BSEC countries to the EU in the future, we simulate how much capital accumulation would be enhanced if governance institutions reached the standards of EU-12 average. The simulations indicate a large gain of such an institutional convergence and reveals in which fields BSEC countries have more scope for improvement. Overall, to the best of our knowledge, this paper is the first attempt in the literature to investigate the link between regionalization, institutional convergence and economic convergence in the BSEC region.
The paper is organized as follows. Section 2 gives a brief account of BSEC countries in recent years. Section 3 explains the rationale behind categorization of governance institutions into three headings. Section 4 presents other determinants of investment. Section 5 lays down the econometric model and gives the regression results. Section 6 illustrates the institutional convergence within BSEC countries, as well as with the EU-12 region and simulates the possible investment gains from convergence of their governance institutions to EU-12 average. Finally, Section 7 makes the concluding remarks.
2. Outlook of Black Sea Economic Cooperation Countries
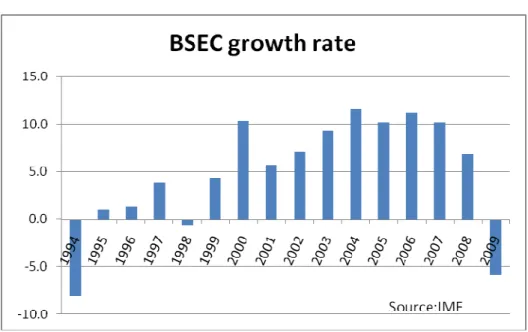
BSEC countries showed strong real GDP growth in 2002-2008 with 6.6 percent average annual growth, which displays that growth has been sustained at high levels over an extended period of time (Figure 2.1). The rate more than tripled the average annual rate of growth of the Euro zone economies and almost doubled the rate of the world
6
economy during the same period. Considering also that the growth rate in the second half of the 1990s up to 2001 was a mere 0.34 percent, the remarkable growth performance of the eleven-country economic block can be easily seen. In spite of the recent decline during the global recession, the outlook of the region remains though promising.
Figure 2.1: BSEC Growth Rate
At the same time, improvements in the business environment in the BSEC region have lowered country risk in the 2000s, leading to a positive trend in foreign direct investment (FDI) in the region. Once attracting only USD 8 billion in 2000, the region recorded a volume of FDI around more than USD 131 billion in 2009 (see figure 2.2). The highest annual jump in FDI flows has been also witnessed in recent years, as volume of FDI that flew into the region in 2006 hit USD 83 billion, compared to USD 47 billion in 2005, up by more than 75 percent. Similarly, the share of foreign investment attracted displayed constant ascent in the 2000s. However, regional development must be backed up by structural reforms in order to attain sustainable economic growth and faster economic convergence with the EU members. .
7 Figure 2.2: FDI Flows in BSEC
3. The Governance Indicators
In order to establish the connection between governance and investment, we need to identify the governance indicators and group them regarding their functionality in affecting investment. Various authors have aggregated certain indices to better capture the common features of the existing data. Kaufmann, Kraay, and Mastruzzi (2003) categorize governance institutions under six broad groups, meanwhile The World Bank (2003) uses two governance indicators by aggregating the relevant data for these features of governance. We categorize governance indicators a la Aysan, Nabli and Veganzones, (2007) and distinguish three broad categories of governance institutions, namely “Administrative Quality” (AQ), “Public Accountability” (PA), and “Political Stability” (PS). This has also helped to account for the multi-collinearity issue in using several highly correlated variables in the same equation.
8
The first governance index “administrative quality” aims to reflect the ability of the government in preparing a business-friendly environment for investors. This variable incorporates three indicators from the International Country Risk Guide” (ICRG, 1999): (a) “Control over Corruption”, “(b) Quality of Bureaucracy”, and (c) “Law and Order”. “Corruption” is documented to affect economic activities adversely more so in developing countries, though developed countries are also not immune to it. Mo (2001) links corruption to low growth through reduced human and physical capital. Also Akai, Horiuchi, Sakata (2005) show that the effect of corruption on economic growth is negative and significant in the middle and long spans. The “Quality of Bureaucracy” index for ICRG implies the ability of the government to put into effect sound policies. Evans and Rauch (1999) examine the direct impact of bureaucratic quality on economic growth. A higher “quality of bureaucracy” index indicates that the government has expertise to govern without drastic policy changes. In the “Law and Order” index, law implies an appraisement of the durability and impartiality of the legal system, while order implies the popular observance of the law. A reliable judiciary system reduces transaction costs for enterprises and sends positive signals to investors that rules of law are equitably and consistently protected and enforced.
The second governance indicator “political stability” includes three variables from ICRG: “Government Stability”, “Internal Conflict”, and “Ethnic Tensions”. Political instability increases the vulnerability of an economy both in the eyes of its citizens and foreign investors. Several authors, using different indicators of political uncertainties, have brought empirical evidence that institutions associated with political
9
instability hamper aggregate investment (Rodrik, 1991; Alesina and Perotti, 1996; Le, 2004).
The third governance indicator” public accountability” consists of two indicators from Freedom House: “Civil Liberties” and “Political Rights”, and one from International Country Risk Guide: “Democratic Accountability”. Public accountability is an integral part of the investment climate of an economy since investment decisions are highly sensitive to the perceptions of the credibility of the political regime and policies. Public accountability, by leading to better economic performances lowers the discontent of the population and produces a more stable political environment in which investors carry out their businesses. A participatory political system shows the stability of social institutions and entails more support of the public to the political system. The more open and participatory the political systems, the more responsible the governments get for putting in sound economic and social policies. Empirical studies display the positive effect of various indicators of democratic institutions on investment in the developing world (Pastor and Sung, 1995).
In addition to these three governance indicators, we have generated two global indexes of governance: (GOV1) which summarizes the information contained in all 9 initial indicators participating in (AQ), (PA), and (PS); and (GOV2) which excludes “Civil Liberties” and “Political Rights” from the main list. All the political and governance indicators have been aggregated by using principal component analysis (PCA) methodology. PCA is mathematically defined as an orthogonal linear transformation that transforms the data to a new coordinate system. PCA can be used for
10
dimensionality reduction in a data set by retaining those characteristics of the data set that contribute most to its variance. Results of PCA are given in Appendix 2.
4. Other Determinants of Investment
The neoclassical flexible accelerator model is the most widely accepted model of investment. It is based on the idea that enterprises invest more if they get profit more. The determinants of investment in the neoclassical accelerator model are the expected aggregate demand (the accelerator), the user cost of capital, the wage rate, and the initial capital stock. We chose the real interest rate to capture the user cost of capital and the GDP growth rate to account for the accelerator effect.
The role of human capital, together with physical capital, is also considered in growth models, especially after the advent endogenous (or new) growth theory (Pritchett, 1996; Barro, 2001). In the neoclassical model, there is no explicit role for education and no externalities. Moreover, human capital enhances better governance institutions. More educated people become more competent bureaucrats (Galor et al., 2005). Therefore human capital is likely to affect investment through its impact on the quality of governance institutions. Recent growth theories have attempted to model these processes, both by introducing human capital explicitly into production functions and by allowing for the possibility of externalities, (Lucas, 1988). Our indicator of human capital includes life expectancy at birth, and average years of primary, secondary, and higher schooling in the total population over 15 years old.
Macroeconomic stability is likely to affect investment positively. The macroeconomic stability indicator (MS) was obtained by using inflation and the ratio of
11
external debt to GDP. External debt represents the risk to an economy of encountering difficulties in reimbursing its debt and facing a financial crisis. Inflation can be disruptive to investment if it leads to unsustainable macroeconomic imbalances (see Fischer, 1993; De Gregorio, 1992).
The effect of structural reforms is reflected by trade policy and financial development. The financial development provides more opportunities and incentives for firms to invest. There has also been a tendency to underline the role of the economic policies, especially of foreign trade openness on economic growth (Sachs and Warner, 1997; Rodrik, 1998). These studies link trade policy and economic growth, where more openness brings higher economic results. Estimations usually include the rate of growth of exports and the summation of exports and imports as a percentage to GDP as a proxy of trade openness. We chose the private credit by banks and other depository institutions to proxy financial development and the ratio of export and import in total GDP to capture trade policy. As for the governance indicators, all structural and policy indicators have been calculated by using the principal component analysis (PCA) methodology (see Annex 2 for PCA results). In terms of the source of the data, all variables come from the WDI database of the World Bank.
5. The Econometric Analysis
Our empirical model explains the share of investment in GDP. In order to account for the persistency in investment, we control for the lag of the dependent variable, what is consistent with the fact that investment decisions take time to materialize. First we introduce the three measures of governance separately, namely “administrative quality”
12
(AQ), “public accountability” (PA), “political stability” (PS). We then use the two global measures of governance; (GOV1) and (GOV1). Since the lag dependent variable is among the control variables, we estimate the model by using Arellano-Bover/Blundell-Bond linear dynamic panel-data estimation. The model is as follows:
it i it it it it inv GI X n v inv = + + + + −1 1 2 1 0 α α α (1)
Where inv is the share of investment in GDP, it invit−1 is the lag of the dependant variable,
it
GI represents the indexes of governance (AQ, PA, PS, GOV1 and GOV2), X1it is the vector of other control variables, and n and i v are the fixed effects and the idiosyncratic it
error terms respectively. As usual, i indicates the country and t represents the time of the variable.
As explained in section 4, the real interest rate (Realr) and the GDP growth rate in the last year (grow) account for the neoclassical flexible accelerator representation, These variables are anticipated to have respectively a negative and positive impact on investment. The model also takes into account the GDP per capita to capture the convergence effect of the Solow growth model. Countries with lower GDP per capita are presumed to gradually catch up with the more developed counterparts, by having more capital accumulation over the time. A negative sign on the coefficient of GDP per capita is thus expected. Structural reform (SR), human capital (Hum) and macroeconomic stability (MS) are anticipated to play a positive role on capital accumulation Sign is however assumed negative in the case of MS, which contains a negative connotation in its composition, due to the inflation and debt ratio entering the indicator.
As for the estimation method, we used the Arellano-Bover/Blundell-Bond linear dynamic panel-data estimation technique. There are several advantages in doing so.When
13
OLS, or regular panel data models, are used to estimate equation (1), the results are biased due to the inclusion of the lagged dependent variable, invit−1. The lagged dependent variable is correlated with the unobserved panel-level effects, and therefore it is not exogenous as assumed by the OLS or some other panel estimations. The Arellano-Bover/Blundell-Blinear dynamic panel-data model includes p lags of the dependent variable as covariates and contains unobserved panel-level effects. Since the unobserved panel-level effects are correlated with the lagged dependent variables, other standard estimators are inconsistent. To account for this problem, Arellano and Bond (1991) derived a consistent generalized method-of-moments (GMM) estimator for this model. However, this estimator has certain deficiencies when the autoregressive parameters are too large, or when the ratio of the variance of the panel-level effect to the variance of idiosyncratic error is too large. An improvement came from Blundell and Bond (1998) developed a system estimator that uses additional moment conditions. With their contribution, deeper lags of the lagged dependent variable become uncorrelated with the transformed error term and remain as instruments for the transformed lagged dependent variable. We employed this improved dynamic panel system when estimatin our model1.
. Equation (1) has been estimated on an unbalanced panel of 43 developing countries over 1985–2005 (see Appendix 1: Table 1.1 for the list of countries) Table 5.1. presents the estimation results for the three governance indicators taken separately (AQ, PS and PA, columns 1 to 3), as well as for the more aggregated ones (GOV1 and GOV2,
columns 4 and 5).
14 Table 5.1 Estimation Results
Investment (1) AQ (2)PS (3)PA (4) GOV1 (5) GOV2
0.35 0.35 0.36 0.35 0.35 GDP growth (8.21)*** (8.32)*** (8.87)*** (8.10)*** (8.08)*** 0.0007 0.0007 0.0007 0.0007 0.0007 Real interest (1.86)* (1.90)* (2.03)** (2.03)** (2.00)** -0.0003 -0.0003 -0.0002 -0.0003 -0.0003 GDP per capita (-4.64)*** (-4.94)*** (-4.26)*** (-5.01)*** (-4.89)*** 0.56 0.57 0.43 0.51 0.51 Human capital (2.57)*** (2.79)*** (1.91)* (2.40)** (2.44)** 2.51 2.62 2.78 2.49 2.52 Structural reform (10.18)*** (11.42)*** (13.19)*** (10.30)*** (10.39)*** Macroeconomic -0.14 -0.12 -0.18 -0.95 -0.99 Stability (-0.64) (-0.55) (-0.83) (-0.43) (-0.44) 0.72 Administrative Quality (2.92)*** 0.56 Political Stability (1.74)* 0.34 Political Accountability (1.84)* 1.05 GOV1 (3.05)*** 0.93 GOV2 (2.73)*** 0.5 0.46 0.47 0.45 0.45 Trend (2.14)** (2.06)** (2.07)** (1.95)* (1.97)** 0.15 0.16 0.17 0.15 0.15 Investment (-1) (5.60)*** (5.79)*** (6.72)*** (5.73)*** (5.84)*** 10.5 10.6 10.1 10.9 10.8 Constant (3.72)*** (3.92)*** (3.88)*** (3.90)*** (3.90)*** Number of observations 844 844 844 844 844
Notes: (***) indicates significance at 1 %, (**) indicates significance at 5 % and (*) indicates significance at 10 %
Estimations confirm the importance of governance institutions for investment decisions. This is true for all level of governance. A high rank of “administrative quality” in the sense of a low level of corruption, a good quality of bureaucracy and better law and
15
order, leads to more capital accumulation. This result holds for political stability (as government stability, ethnic tensions and internal tensions), as well as public accountability, although with a lower level of significance in both cases (10 percent level). These results are confirmed with a high level of significance (one percent) when introducing the more global indicators of governance (GOV1) and (GOV2).,
As far as other results are concerned, our estimations verify partially the neoclassical theory of the firm in the case of developing countries. In all specifications, the accelerator variable (GDP growth) has the expected positive sign and is highly significant (at the 1 percent level). This implies that anticipations of economic growth induce more investment. On the other hand, real interest rate turns out to be positive and significant (at the 10 percent level in the first two estimations, 5 percent otherwise), what is contrary to the user cost of capital argument. This finding indicates that investors continue capital accumulation in spite of increasing interest rates. It looks however quite reasonable considering the fact that, in developing countries, the returns from investment are rather high when the business cycles are favorable to the investors (and vice versa). In addition, estimations confirm the Solow’s convergence argument that countries with lower GDP per capita accumulate more capital in transition. The GDP per capita variable turns out to be highly significant (at the 1 percent level) with an expected negative coefficient.
Other interesting outcomes concern structural reforms and human capital, which stand as significant positive factors on investment decisions (at 1 percent, and 1 to 10 percent levels depending of the specification, respectively). Macroeconomic stability, however, does not appear as a significant factor in capital accumulation. This result
16
indicates that investment decisions rely more on fundamental and long term factors, than on short term aspects.
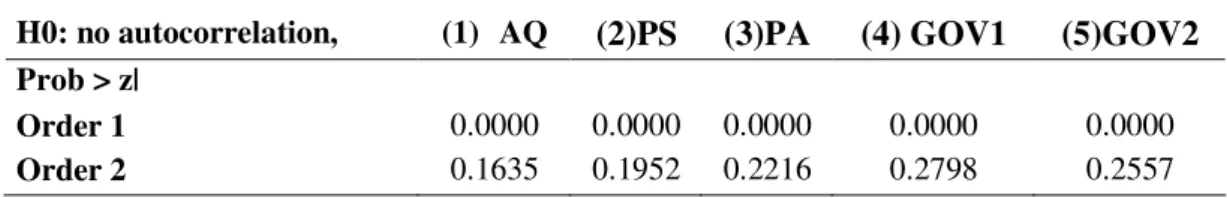
Table 5.2: Arellano-Bond test for zero autocorrelation in first-differenced errors H0: no autocorrelation, (1) AQ (2)PS (3)PA (4) GOV1 (5)GOV2
Prob > z|
Order 1 0.0000 0.0000 0.0000 0.0000 0.0000
Order 2 0.1635 0.1952 0.2216 0.2798 0.2557
Regression results also indicate a strong persistency in the investment decision. Lagged dependent variable displays a positive and highly significant coefficient in all specifications. The results also indicate a positive trend for capital accumulation. We have also tested the zero autocorrelation in first-differenced errors. The results are depicted in Table 5.2. Null hypothesis is no autocorrelation. In all the specification, we reject the null hypothesis for the first moments, but not for the second ones. Arellano and Bond shows that there is a first order serial correlation in the transformed error terms as expected, and that the second order serial correlation is rejected. Hence, using the second lag of the dependent variable as an instrument for the transformed lagged dependent variable is feasible.
6. Convergence in Governance Institutions of BSEC countries
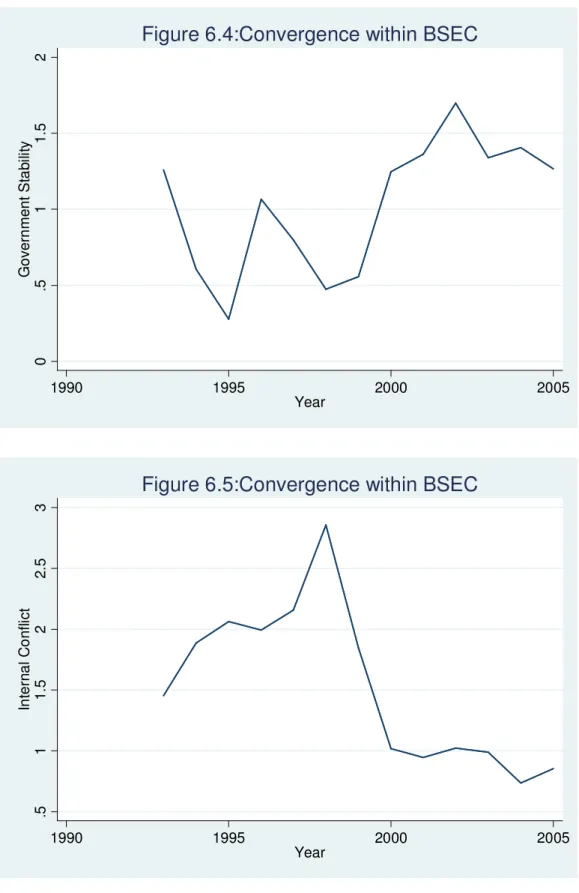
In this section, we investigate whether regional integration among BSEC countries has lead to convergence in governance within the region. We also ask the question whether this convergence has helped to reduce the gap in governance with respect to the EU-12 To carry this analysis, we have relied on seven of the nine initial
17
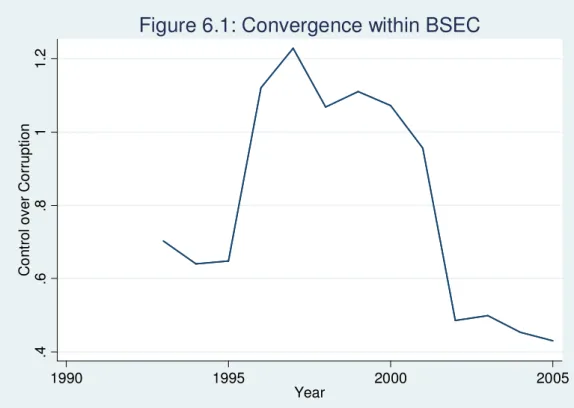
governance indicators considered previously. We find that BSEC countries have achieved within-regional convergence in almost all levels of governance. Comparing 2005 and 1992, the year when the regional bloc was established, five out of the seven indicators have a lower standard deviation (see Figures 6.1 to 6.7). Although there are variations in results, and partial deterioration between 1992 and 1998, standard deviation for all indicators except democratic accountability and government stability have dropped significantly. .4 .6 .8 1 1 .2 C o n tr o l o v e r C o rr u p ti o n 1990 1995 2000 2005 Year
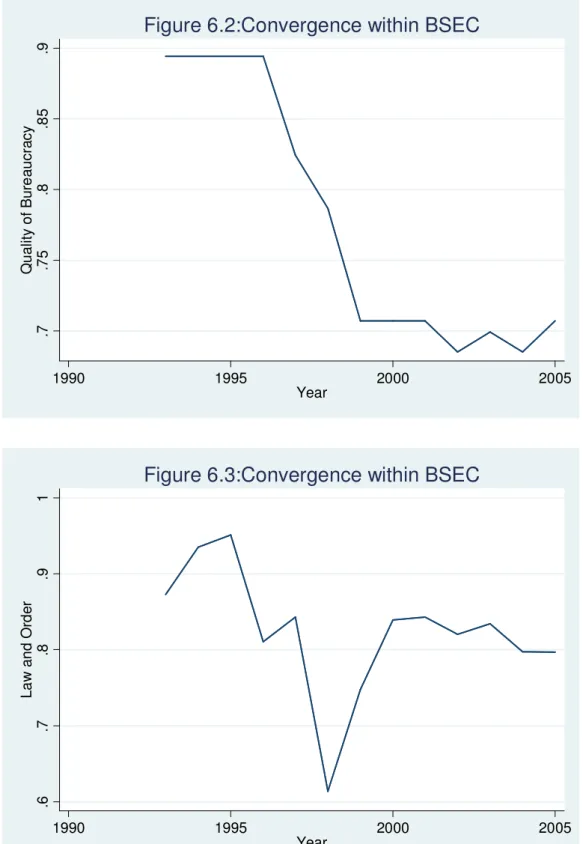
18 .7 .7 5 .8 .8 5 .9 Q u a lit y o f B u re a u c ra c y 1990 1995 2000 2005 Year
Figure 6.2:Convergence within BSEC
.6 .7 .8 .9 1 L a w a n d O rd e r 1990 1995 2000 2005 Year
19 0 .5 1 1 .5 2 G o v e rn m e n t S ta b ili ty 1990 1995 2000 2005 Year
Figure 6.4:Convergence within BSEC
.5 1 1 .5 2 2 .5 3 In te rn a l C o n fl ic t 1990 1995 2000 2005 Year
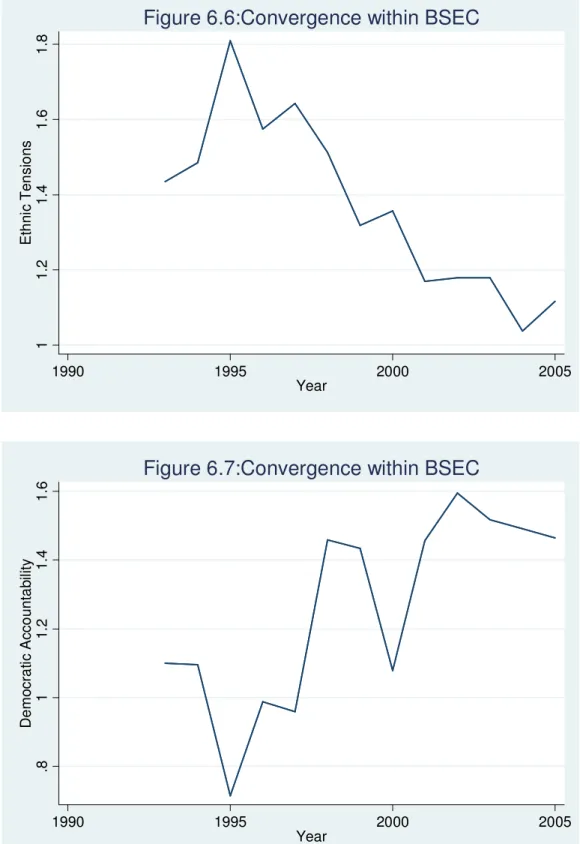
20 1 1 .2 1 .4 1 .6 1 .8 E th n ic T e n s io n s 1990 1995 2000 2005 Year
Figure 6.6:Convergence within BSEC
.8 1 1 .2 1 .4 1 .6 D e m o c ra ti c A c c o u n ta b ili ty 1990 1995 2000 2005 Year
21
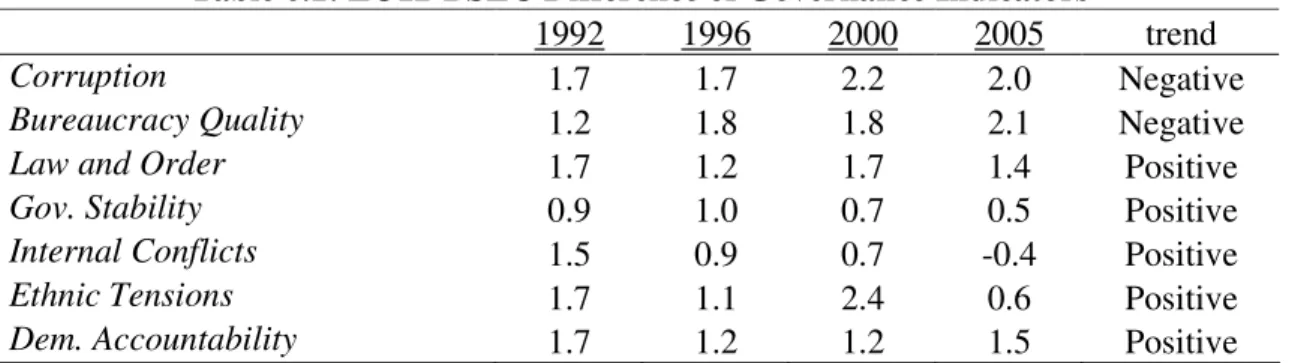
In terms of the trends of governance, it can be observed that four out of seven indices have experienced improvements since 1992. Among the improved indices, the highest increase in levels was observed in government stability, followed by democratic accountability. On the other hand, the region saw deterioration in the corruption and bureaucratic quality indices. Since its inception, in 1992, the BSEC member countries on average also converged to the EU-12 average. It is observed that five out of the seven governance indicators have approached its comparator. Corruption and bureaucratic quality are the only two indices that diverged partially away from the EU-12 average. The rate of convergence was the highest for internal conflict, ethnic tensions and government stability, while it was the least for democratic accountability (Table 6.1).
Table 6.1: EU12-BSEC Difference of Governance Indicators
1992 1996 2000 2005 trend
Corruption 1.7 1.7 2.2 2.0 Negative
Bureaucracy Quality 1.2 1.8 1.8 2.1 Negative
Law and Order 1.7 1.2 1.7 1.4 Positive
Gov. Stability 0.9 1.0 0.7 0.5 Positive
Internal Conflicts 1.5 0.9 0.7 -0.4 Positive
Ethnic Tensions 1.7 1.1 2.4 0.6 Positive
Dem. Accountability 1.7 1.2 1.2 1.5 Positive
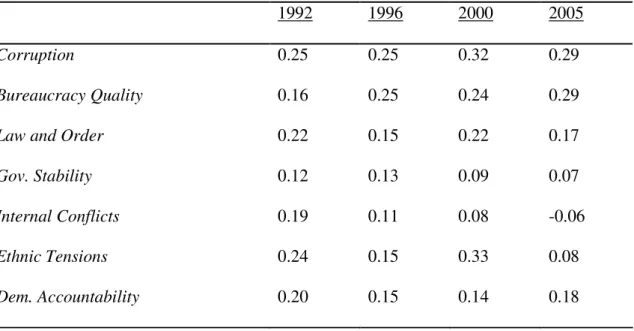
In order to ascertain the impact of convergence in governance on capital accumulation in the BSEC region, we simulated how much investment would have gone up if governance had converged to the EU-12 levels. Calculations were done by using the proportion of each governance index affecting GOV2, the coefficient coming from the regression and the gap between BSEC and EU-12 averages. Results for the final year show that improvement in bureaucratic quality and corruption would contribute the most, with an investment ratio increased by 0.29% each year when the converge to EU-12 is
22
reached. The law and order and democratic accountability are the second most effective governance levels that have the potential to increase investment rate by 0.17% and 0.18% respectively (Table 6.2). On the opposite, improvement in government stability and ethnic tension appears to have a slight contribution to capital accumulation. Similarly, internal conflicts have shown a sizable progress in recent years as it converges more to EU-12 average over time.
Table 6.2: Contribution to Investment of Governance Indicators
1992 1996 2000 2005
Corruption 0.25 0.25 0.32 0.29
Bureaucracy Quality 0.16 0.25 0.24 0.29
Law and Order 0.22 0.15 0.22 0.17
Gov. Stability 0.12 0.13 0.09 0.07
Internal Conflicts 0.19 0.11 0.08 -0.06
Ethnic Tensions 0.24 0.15 0.33 0.08
Dem. Accountability 0.20 0.15 0.14 0.18
7. Conclusion
Good governance and institutions are an assurance to guarantee property rights and minimize transaction costs, thus creating an environment conducive to investment and growth. Since its foundation in 1992, BSEC countries have gone through a transition process and, to a large extent, this has been about institutional transformation. In this paper, we verify this institutional transformation for several governance indicators.
23
Institutional convergence has taken place within the region during 1992-2005 in the control over corruption, the quality of the bureaucracy, the law and order, the internal conflicts and the ethnic tensions. This transformation has helped the institutional convergence toward the EU-12 region as well. This convergence in institutions has participated in the significant economic performances observed during the same period. We illustrate in particular that this institutional development has materialized into investment. This relation has been tested on a panel of 43 countries over 1995-2005. Various dimensions of the quality of the administration (control over corruption, quality of bureaucracy, law and order), of political stability (government stability, internal conflict, ethnic tensions), and of democratic accountability (civil liberties, political rights, democratic accountability) show a positive and significant impact on investment. This result is all the more important for the BSCE countries, because of the scope of improvement in governance that still exist in the region. Filling the gap with the EU-12 would stimulate further investment and growth, facilitating in return a future integration in the EU. By using our econometric results we show, in particular, that investment could increase a 0.58 percent per year if bureaucracy quality and control over corruption catched up with the EU-12 average. This increase would be of 0.17 and 0.18 percent per year respectively for law and order and democratic accountability. Improvements in government stability and ethnic tension, however, display a lower contribution to capital accumulation. These results constitute a powerful mean of appreciation of the economic impact of governance institutions. They are also the first to our knowledge on the role of BSEC on the convergence of governance of its member countries.
24
7. Appendix
Annex 1
List of Countries used in Regression Analysis
Albania Dom. Rep. Malawi South Africa
Armenia Ecuador Malaysia Sri Lanka
Azerbaijan Egypt Moldova Thailand
Bahrain El Salvador Nicaragua Togo
Bangladesh Ghana Nigeria Trinidad Tobago
Bolivia Greece Panama Turkey
Bulgaria Guatemala Papua New Guinea Ukraine
Cameroon Honduras Paraguay Uruguay
Chile Hungary Peru Venezuela
China India Philippines Zambia
Colombia Indonesia Romania Zimbabwe
Costa Rica Jordan Russia
Cote d’Ivoire Kenya Sierra Leone
25
Annex 2:
Principal Component Analysis
Table A2.1: The Administrative Quality Indicator
Component Eigenvalue Cumulative R2
P1 1.87 0.62 P2 0.57 0.81 P3 0.55 1 Loadings P1 P2 P3 Corruption 0.57 -0.43 0.69 Bureaucracy Quality 0.57 -0.37 -0.72
Law and Order 0.57 0.81 0.03
AQ = P1*(0.62) + P2*(0.19) + P3*(0.19)
************************************************************************ Table A2.2: The Political Stability Indicator
Component Eigenvalue Cumulative R2
P1 1.70 0.56 P2 0.80 0.83 P3 0.49 1 Loadings P1 P2 P3 Gov.Stability 0.52 0.74 0.41 Ethnic Tensions 0.64 -0.03 -0.76 Internal Tensions 0.55 -0.67 0.49 PS = P1*(0.56) + P2*(0.27) + P3*(0.17) ************************************************************************
26
Table A2.3: The Public Accountability Indicator
Component Eigenvalue Cumulative R2
P1 2.29 0.76 P2 0.56 0.95 P3 0.14 1 Loadings P1 P2 P3 Democ. Accountability 0.50 0.80 0.07 Political Rights 0.61 -0.29 -0.72 Civil Liberties 0.60 -0.41 0.68 PA = P1*(0.76) + P2*(0.19) + P3*(0.05)
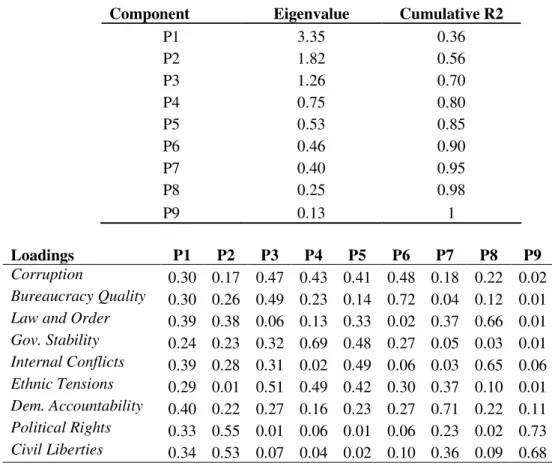
Table A2.4: The Governance1 Indicator
Component Eigenvalue Cumulative R2
P1 3.35 0.36 P2 1.82 0.56 P3 1.26 0.70 P4 0.75 0.80 P5 0.53 0.85 P6 0.46 0.90 P7 0.40 0.95 P8 0.25 0.98 P9 0.13 1 Loadings P1 P2 P3 P4 P5 P6 P7 P8 P9 Corruption 0.30 0.17 0.47 0.43 0.41 0.48 0.18 0.22 0.02 Bureaucracy Quality 0.30 0.26 0.49 0.23 0.14 0.72 0.04 0.12 0.01
Law and Order 0.39 0.38 0.06 0.13 0.33 0.02 0.37 0.66 0.01
Gov. Stability 0.24 0.23 0.32 0.69 0.48 0.27 0.05 0.03 0.01 Internal Conflicts 0.39 0.28 0.31 0.02 0.49 0.06 0.03 0.65 0.06 Ethnic Tensions 0.29 0.01 0.51 0.49 0.42 0.30 0.37 0.10 0.01 Dem. Accountability 0.40 0.22 0.27 0.16 0.23 0.27 0.71 0.22 0.11 Political Rights 0.33 0.55 0.01 0.06 0.01 0.06 0.23 0.02 0.73 Civil Liberties 0.34 0.53 0.07 0.04 0.02 0.10 0.36 0.09 0.68
27
Governance = P1*(0.37) + P2*(0.20) + P3*(0.14) + P4*(0.10) + P5*(0.05) + P6*(0.05) + P7*(0.05) + P8*(0.03) + P9*(0.02)
Table A2.5: The Governance2 Indicator
Component Eigenvalue Cumulative R2
P1 2.90 0.41 P2 1.22 0.59 P3 0.89 0.71 P4 0.71 0.82 P5 0.54 0.89 P6 0.45 0.96 P7 0.25 1 Loadings P1 P2 P3 P4 P5 P6 P7 Corruption 0.35 0.46 0.37 0.22 0.41 0.51 0.22 Bureaucracy Quality 0.37 0.47 0.30 0.21 0.13 0.70 0.12
Law and Order 0.49 0.10 0.03 0.39 0.34 0.12 0.69
Gov. Stability 0.30 0.34 0.69 0.12 0.48 0.27 0.03 Internal Conflicts 0.46 0.33 0.00 0.05 0.49 0.06 0.66 Ethnic Tensions 0.29 0.49 0.55 0.17 0.43 0.40 0.08 Dem. Accountability 0.34 0.32 0.03 0.84 0.20 0.06 0.17 Governance = P1*(0.41) + P2*(0.18) + P3*(0.12) + P4*(0.11) + P5*(0.07) + P6*(0.07) + P7*(0.04)
Table A2.6: The Structural Reform Indicator
Component Eigenvalue Cumulative R2
P1 1.29 0.58 P2 0.70 1 SR = P1*(0.58) + P2*(0.32) ************************************************************************ Loadings P1 P2 Trade Policy 0.71 -0.71 Domestic Credit 071 0.71
28
Table A2.7: The Human Capital Indicator
Component Eigenvalue Cumulative R2
P1 2.53 0.63 P2 0.87 0.85 P3 0.37 0.94 P4 0.21 1 Loadings P1 P2 P3 P4 Life Expectancy 0.53 -0.18 0.81 -0.14 H1 0.28 0.94 0.05 0.13 H2 0.56 -0.04 -0.50 -0.65 H3 0.55 -0.25 -0.29 0.73 H = P1*(0.63) + P2*(0.22) + P3*(0.09) +P4*(0.06)
Table A2.8: The Macroeconomic Stability Indicator
Component Eigenvalue Cumulative R2
P1 1.39 0.69 P2 0.60 1 SR = P1*(0.69) + P2*(0.21) ************************************************************************ Loadings P1 P2 Inflation 0.70 0.70 External debt 070 -0.70
29
8. References
Acemoglu, Daron, and Robert Shimer. 1999. “Efficient Unemployment Insurance.” Journal of Political Economy 107 (5): 893-28.
Acemoglu, Daron, and James A. Robinson. 2001. "A Theory of Political Transitions." American Economic Review 91(4): 938-963.
Acemoglu, Daron, Simon Johnson, and James A. Robinson. 2001. “The Colonial Origins of Comparative Development: An Empirical Investigation.” American Economic Review 91(5): 1369–401.
Acemoglu, Daron, Simon Johnson, James Robinson, and Yunyong Taicharoen. 2003. “Institutional Causes, Macroeconomic Symptoms, Volatility, Crises and Growth.” Journal of Monetary Economics 89 (September): 49-123.
Ades, Alberto, and Rafael Di Tella. 1999. “Rents, Competition and Corruption.” American Economic Review 39 (September): 49-123.
Aizenman, Joshua, and Nancy P. Marion. 1999. “Volatility and Investment: Interpreting Evidence from Developing Countries.” Economica 66: 157-79.
Agenor, Pierre-Richard, and Peter J. Montiel. 1999. Development Macroeconomics. Princeton: Princeton University Press.
Alesina, Alberto, and Roberto Perotti. 1996. “Income Distribution, Political Instability, and Investment.” European Economic Review 40: 1203–28.
Alesina, Alberto, Sule Ozler, Nouriel Roubini, and Phillip Swagel. 1996. “Political Instability and Economic Growth.” Journal of Economic Growth 1(2): 189–211. Altmann, Franz-Lothar, 2006. “Promoting Democracy-Building and Security Through
Private Investments.” Unpublished Manuscript, Stiftung für Wissenschaft und Politik, Berlin.
Aysan, Ahmet Faruk. 2006. “The Role of Efficiency of Redistributive Institutions on Redistribution: An Empirical Assessment.”, Boğaziçi University Research Papers, ISS/EC 2006-14, Istanbul.
Aysan, Ahmet F., Mustapha Nabli, and Marie-Ange Véganzonès-Varoudakis. 2009 “Governance Institutions and Private Investment : An application to the Middle East and North Africa”, The Developing Economies, 45 (3): 339-377.
30
Aysan, Ahmet F., Gaobo Pang, and Marie-Ange Véganzonès-Varoudakis. 2009 “Uncertainty, Economic Reforms and Private Investment in the Middle East and North Africa”, Applied Economics,. 41 (11): 1-17.,
Azariadis, Costas, and Amartya Lahiri. 2002. "Do Rich Countries Choose Better Governments?." Contributions to Macroeconomics 2(1), Article 4.
Balassa, Bela. 1978. “Exports and Economic Growth-Further Evidence.”, Journal of Development Economics 5.
Barro, Robert J. 2000a. “International Data on Educational Attainment: Updates and Implications.” CID Working Paper 42, Harvard University, Cambridge, Mass. Barro, Robert J. 2000b. “International Measures of Schooling Years and Schooling
Quality.” American Economic Review 86: 218–23.
Barro, Robert J, and Jong-Wha Lee. 1994. “Panel Data Set Cross Countries.” Data Diskette.
Bellin, Eva. 2001. “The Politics of Profit in Tunisia: Utility of the Rentier Paradigm ?.” World Development 22(3): 427-36.
Berg, Andrew, and Ann Krueger. 2003. “Trade, Growth, and Poverty – A Selective Survey.” IMF Working Paper 03/30, Washington, D.C.
Bisat, Amer, Mohamed A. El-Erian, Mahmoud El-Gamal, and Francesco P. Mongelli. 1996. “Investment and Growth in the Middle East and North Africa.” IMF Working Paper WP/96/124.
Blejer, Mario, and Mohsin Kahn. 1984. “Government Policy and Private Investment in Developing Counties.” IMF Staff Papers 31(2): :79-403, Washington, D.C. Bresnahan, Timothy, F. Erik Brynjolfsson, and Lorin M. Hitt. 2002. “Information,
Technology, Workplace Organization and the Demand of Skilled Labor: Firm-Level Evidence.” Quarterly Journal of Economics 117 (1): 339-76.
Brunetti, Aymo, and Beatrice Weder. 1994. "Political Credibility and Economic Growth in Less Developed Countries." Constitutional Political Economy 5(1):23-43. Caballero, Ricardo, and Arvind Krishnamurthy. 2001. “A Dual Liquidity Model for
Emerging Markets.”, NBER Working paper 8758, National Bureau of Economic Research, Cambridge, Massachusetts.
31
Calderon, Cesar, and Alberto Chong. 2000. "Causality and Feedback between
Institutional Measures and Economic Growth." Economic and Politics 12(1): 69-81.
De Haan, Jakob, and Clemens L. J.Siermann. 1996. “New Evidence from Historical Accounts and Contemporary Data.” Land Economics 75 (3): 341-59.
Djankov, Simon, Rafael La Porta, Florencio Lopez-de-Silanes, and Andrei Sheifer. 2001. ‘The Regulation of Entry.” CEPR Discussion Paper No.2 953, (September). Easterly, William, and Ross Levine. 2003. “Tropics, Germs, and Crops: How
Endowments Affect Economic Development.” Journal of Monetary Economics 50 (January): 3-39.
El Badawi, Ibrahim, A.. 2002. “Reviving Growth in the Arab World.” Working Paper Series 0206, Arab Planing Institute, Safat, Kuwait.
Engelman, S., and K. Sokoloff. 2002. “Factor Endowments, Inequality, and Paths of Development among New World Economies.” Economia 3(1): 41–109. Evans, Peter, and James Rauch. 2000) “Bureaucratic Structure and Bureaucratic
Performance in the Less Developed Countries.” Journal of Public Economics 75 (1): 49-71.
Everhart, Stephen, and Mariuzs Sumlinski. 2001. “Trends in Private Investment in Developing Countries, Statistics for 1970–2000, and the Impact on Private Investment of Corruption and the Quality of Public Investment,” IFC Discussion Paper 44, Washington, D.C.
Feder, G. 1982, “On Exports and Economic Growth,” Journal of Development Economics 12(1/2).
Frankel, Jeffrey. 2002. “Promoting Better National Institutions: The Role of the IMF.” Paper presented at the Third Annual IMF Research Conference, Washington, November 7-8.
Frankel, J.A., and D. Romer, 1999. “Does Trade Cause Growth.” The American Economic Review Vol. 89, No 3.
Fraser Institute, Economic Freedom in the World, Vancouver, Canada. Freedom House. 2002. Freedom in the World 2001–2002. Available online at
32
Galor, Oded, Omer Moav, and Dietrich Vollrath. 2005. “Land Inequality and the Emergence of Human Capital Promoting Institutions.” Development and Comp Systems, 0502018, Economic Working Paper Archive at WUSTL.
Gylfason, T. 2001. “Natural Resources, Education, and Economic Development.” European Economic Review 45 (May): 847-859.
Glaeser, Edward L., Rafael La Porta, Florencio Lopez-de-Silanes, and Andrei Shleifer. 2004. “Do Institutions Cause Growth?.” NBER Working Paper #10568.
Greene, Joshua, and Delano Vilanueva. 1991. “Private Investment in Developing Countries.” IMF Staff Papers 38 (March):33-58.
Gupta, Sandeev, Hamid Davooli and Rosa Alonso-Terme. 2002. “Does Corruption Affect Income Inequality and Poverty.” Economics of Governance 3(1): 23-45.
Hall, Robert and Charles Jones. 1999. “Why Do Some Countries Produces So Much More Output per Workers that Others?.” Quarterly Journal of Economics 114 (February): 83-116.
Heritage Foundation. 2003. Index of Economic Freedom: The Wall Street Journal.
http://www.heritage.org/research/ features/index (accessed December 2004).
ICRG. 1999. Brief Guide to the Rating System. International Country Risk Guide, Political Link Service Group, New York.
International Finance Statistics Database (IFS). the International Monetary Fund, Washington, D.C.
International Monetary Fund. 2003. World Economic Outlook. Growth, and Institutions. World Economic and Financial Surveys, Washington, D.C.
Isham, J., Woolcock, M., Pritchett L, and Busby, G. 2002. “The Varieties of Rentier Experience: How Natural Resource Export Structures Affect the Political Economy of Economic Growth.”.
Islam, Roumeen, and Claudio Montenegro. 2002. “What Determines the Quality of Institutions.” World Bank Policy Research Working Paper No. 2764 (January), The World Bank, Washington , D.C.
Jorgenson, Dale W. 1963. “Capital Theory and Investment Behavior.” American Economic Review 53(2, May): 247-259.
33
Kaufmann, Dani, Aart Kraay, and Maximo Mastruzzi. 2003. “Governance Matters III, Governance Indicators for 1996–2002.” World Bank, Washington, D.C. Processed.
Keefer, Philip. 2002. “The Political Economy of Corruption in Indonesia.” World Bank, Washington D.C., Processed.
Keefer, Philip, Thorsten Beck, George Clarke, Alberto Groff, and Patrick Walsh. 2001. "New Tools in Comparative Political Economy: The Database of Political Institutions." World Bank Economic Review 15(1), 165-176.
Knack, Stephen, and Philip Keefer. 1995. “Institutions and Economic Performance: Cross Country Tests Using Alternative Institutional Measures.” Economics and Politics 7(3): 207–27.
Le, Quan V. 2004. “Political and Economic Determinants of Private Investment.” Journal of International Development 16:289-604.
Levine, Renelt. 1997. “Financial Development and Economic Growth: Views and Agenda.” Journal of Economic Literature 35:688-726.
Life Data Base (LDB), The World Bank, Washington, D.C.
Lipset, Seymour Martin. 1959. “Some Social Requisites of Democracy: Economic Development and Political Legitimacy.” American Political Science Review 53: 69–105.
Lucas, Robert. 1988. “On the Mechanics of Development.” Journal of Monetary Economics 22(1):1-175.
Mankiw, Gregory, David Romer and David Weil. 1992. “A Contribution to the Empirics of Economic Growth.” Quarterly Journal of Economics 106:407-37.
Mauro, Paolo. 1995. “Corruption and Growth.” Quarterly Journal of Economics 110: 681–712.
McKinnon, Ronald I.. 1973. Money and Capital in Economic Development, Washington, DC: Brookings Institution.
Mo, Park Hung. 2001. “Corruption and Economic Growth.” Journal of Comparative Economics 29(1): 66-79.
34
Nabli, Mustapha. and Marie-Ange Véganzonès-Varoudakis. 2006. “Reforms and Growth in the MENA Countries: New empirical evidences”, Journal of International Development. 19: 17-54. . .
Nagaraj, Ratapolu, Aristomène. Varoudakis, and Marie-Ange Véganzonès. 2000. “Long-Run Growth Trends and Convergence Across Indian States: The Role of Infrastructures.” Journal of International Development 12 (1): 45-70.
North, Douglas C. 1981. Structure and Change in Economic History. New York: W. W. Norton.
North, Douglas C. 1990. Institutions, Institutional Change, and Economic Performance. Cambridge, U.K.: Cambridge University Press.
Political Risk Services. 2001. International Country Risk Guide, New York: PRS Group. http://www.prsgroup.com (accessed December 2004).
Olson, Mancur, Naveen Sarna, and Anand V. Swamy. 2000. “Governance and Growth: A Simple Hypothesis Explaining Cross-Country Differences in Productivity
Growth.” Public Choice 102(3-4), 341 -364.
Pastor, Manuel, and Jae Ho Sung, 1995. “Private Investment and Democracy in the Developing World.” Journal of Economic Issues 29(1):223-21.
Prszeworski, Adam, and Fernando Limongi. 1993. “Political Regimes and Economic Growth.”, Journal of Economic Perspectives 7: 51–69.
Prszeworski, Adam, Michael Alvarez, Jose Antonio Cheibub, and Fernando Limongi. 2000. Democracy and Development: Political Institutions and Well-Being in the World, 1950–1990. New York: Cambridge University Press.
Psacharopoulos, George. 1988. "Education and Development: A Review." World Bank Research Observer, Oxford University Press, 3(1): 99-116. Rama. Martin. .1993."Empirical Investment Equations in Developing Countries." In
Striving for Growth after Adjustment, ed. L. Servén and A. Solimano. The World Bank:
Rodriguez, Francisco, and Jeffrey D. Sachs. 1999. “Why Do Resource Abundant Economies Grow More Slowly?”. Journal of Economic Growth 4(3), 277-303. Rodrik, Dani. 1991. “Policy Uncertainty and Private Investment in Developing
35
Rodrik, Dani. 1999. “Institutions for High-Quality Growth: What They Are and How to Acquire Them.” Paper presented at the IMF Conference on Second Generation Reforms, Washington, November 8-9.
Rodrik, Dani, Arvind Subramanian, and Francesco Trebbi. 2002. “Institutions Rule: The Primacy of Institutions over Geography and Integration in Economic
Development.” NBER Working Paper 9305, National Bureau of Economic Research, Cambridge, Massachusetts.
Ross, Michael. 2001. “Does Oil Hinder Democracy?”. World Politics 53: 325–61. Sachs, Jeffrey. 2003. “Institutions Don’t Rule: A Refutation of Institutional
Fundamentalism.” NBER Working Paper.9490, National Bureau of Economic Research, Cambridge, Massachusetts.
Sachs, Jeffrey,and Andrew Warner. 1997. “Natural Resource Abundance and Economic Growth.” Center for International Development. Harvard University, Cambridge: Mass. http://www.cid.harvard.edu// ciddata/ciddata.html (accessed December 2004).
Saleh, Jahangir. 2004. “Property Rights Institutions and Investment.” The World Bank Policy Research Working Paper Series, 3311, The World Bank, Washington D.C. Schmidt-Hebbel, Klaus, and Tobias Muller. 1992. “Private Investment under
Macroeconomic Adjustment in Morocco.” In Reviving Private Investment in Developing Countries, ed. Alay Chhibber, Mansoor Dailami, and Nemat Shafik. Amsterdam: North Holland.
Serven, Luis. 1997. “Uncertainty, Instability, and Irreversible Investment: Theory, Evidence, and Lessons for Africa.” The World Bank Policy Research Working Paper Series 1722, The World Bank, Washington D.C.
Servén, Luis, and Andrés Solimano. 1993. “Private Investment and Macroeconomic Adjustment: A Survey.” In Striving for Growth After Adjustment, ed. Luis Servén and Andrés Solimano, Washington D.C.: The:World Bank.
Shafik, Nemat. 1992. “Modeling Private Investment in Egypt.” Journal of Development Economics 39 (October): 263-277.
Shaw. E. 1973. Financial Deepening in Economic Development, Oxford University Press, New York.
36
Svensson, Jakob. 1998. "Investment, property rights and political instability: Theory and evidence." European Economic Review, Elsevier, 42(7), 1317-1341.
Tanzi, Vito, and Hamid Davooli. 1997. “Corruption, Public Investment, and Growth.” IMF Working Papers 97/139, International Monetary Fund, Washington, D.C. Transparency International. 2002. Global Corruption Report 2003, Berlin.
Wei, Shang-Jin. 2000. ”Natural Openness and Good Government.” NBER Working Paper 7765, National Bureau of Economic Research, Cambridge, Massachusetts. World Bank 2002. World Development Report 2002: Building Institutions for Market.
Oxford University Press, New York.
World Bank. 2004. Better Governance for Development in the Middle East and North Africa: Enhancing Inclusiveness and Accountability. MENA Development Report. The World Bank, Washington, D.C.
World Bank. 2005. World Development Indicators, 2005). Washington, D.C.: World Bank. http:/www.worldbank.org/data/wdi22005/index.htm (accessed August 2005)