The damaging effect of passenger
mutations on cancer progression
The MIT Faculty has made this article openly available.
Please share
how this access benefits you. Your story matters.
Citation
McFarland, Christopher D., et al. “The Damaging Effect of
Passenger Mutations on Cancer Progression.” Cancer Research 77,
18 (September 2017): 4763–72.
As Published
http://dx.doi.org/10.1158/0008-5472.CAN-15-3283-T
Publisher
American Association for Cancer Research (AACR)
Version
Author's final manuscript
Citable link
https://hdl.handle.net/1721.1/125061
Terms of Use
Creative Commons Attribution-Noncommercial-Share Alike
The damaging effect of passenger mutations on cancer
progression
Christopher D McFarland1,*, Julia A Yaglom2,*, Jonathan W Wojtkowiak3,*, Jacob G Scott4,
David L Morse3, Michael Y Sherman2, and Leonid A Mirny5,6 1Department of Biology, Stanford University, Stanford, CA, USA
2Department of Biochemistry, Boston University School of Medicine, Boston, MA, USA
3Department of Cancer Imaging and Metabolism, H. Lee Moffitt Cancer Center and Research Institute, Tampa, FL, USA
4Integrated Mathematical Oncology Department, H. Lee Moffitt Cancer Center and Research Institute, Tampa, FL, USA
5Institute for Medical Engineering and Sciences, Massachusetts Institute of Technology, Cambridge, MA
6Department of Physics, Massachusetts Institute of Technology, Cambridge, MA
Abstract
Genomic instability and high mutation rates cause cancer to acquire numerous mutations and chromosomal alterations during its somatic evolution, most are termed passengers because they do not confer cancer phenotypes. Evolutionary simulations and cancer genomic studies suggest that mildly deleterious passengers accumulate and can collectively slow cancer progression. Clinical data also suggest an association between passenger load and response to therapeutics, yet no causal link between the effects of passengers and cancer progression has been established. To assess this, we introduced increasing passenger loads into human cell lines and
immunocompromised mouse models. We found that passengers dramatically reduced proliferative fitness (~3% per Mb), slowed tumor growth, and reduced metastatic progression. We developed new genomic measures of damaging passenger load that can accurately predicted the fitness costs of passengers in cell lines and in human breast cancers. We conclude that genomic instability and elevated load of DNA alterations in cancer is a double-edged sword: it accelerates the
accumulation of adaptive drivers, but incurs a harmful passenger load that can outweigh driver benefit. The effects of passenger alterations on cancer fitness were unrelated to enhanced immunity, as our tests were performed either in cell culture or in immunocompromised animals. Our findings refute traditional paradigms of passengers as neutral events, suggesting that passenger load reduces the fitness of cancer cells and slows or prevents progression of both primary and metastatic disease. The anti-tumor effects of chemotherapies can in part be due to induction of genomic instability and increased passenger load.
Correspondence to: Michael Y Sherman; Leonid A Mirny.
HHS Public Access
Author manuscript
Cancer Res
. Author manuscript; available in PMC 2018 September 15.Published in final edited form as:
Cancer Res. 2017 September 15; 77(18): 4763–4772. doi:10.1158/0008-5472.CAN-15-3283-T.
A
uthor Man
uscr
ipt
A
uthor Man
uscr
ipt
A
uthor Man
uscr
ipt
A
uthor Man
uscr
ipt
Keywords
Passengers; Genomic Instability; Cancer Evolution; Metastasis
Introduction
Genomic instability, i.e. a high frequency of mutations and chromosomal alterations (referred to collectively as mutations) within cellular lineages, is a hallmark of
carcinogenesis1. Genomic instability creates driver mutations and passenger mutations. Drivers are defined as mutations which confer a fitness advantage to somatic cells in their microenvironment—thereby driving the cell lineage to cancer2. Conversely, passengers (also termed ‘hitchhikers’) are defined as mutations that provide no such proliferative benefit2. Recurrence patterns in sequenced cancers estimate that the vast majority (97%) of mutations in cancer are passengers3. Compared to drivers, however, little is known about passengers. Accordingly, recent literature disagrees over the properties of classified passengers, with some arguing that passengers are misclassified ‘mini-drivers’4, or latent drivers5, or effectively neutral6,7, and potentially deleterious to cancer8,9.
These diverging hypotheses for passenger’s effect, although non-exclusive, result from a few surprises and limitations in whole-genome analyses. First, the number of newly identified driver genes were less than expected4. Second, some sequenced cancers genomes have very few or no known drivers10. Both of these results suggest that driver mutations may be found elsewhere. Lastly, accumulation-based statistics (e.g. dN/dS) cannot distinguish ‘effectively neutral’ mutations—a term initially applied to sexually-evolving populations11—from ‘mildly-deleterious’ mutations in asexuals like cancer (‘Mildy-Deleterious’ mutations are operationally-defined by accumulation statistics 12). All of these findings underscore the need to directly measure passenger’s phenotype.
Our recent analyses of human cancer genomics data 8,9 indicate that accumulated passengers, an inextricable consequence of genomic instability, can be moderately deleterious to cancer cells. These deleterious passengers largely evade natural selection in our evolutionary models (Fig. 1). Our model considers individual cells with the capacity to acquire advantageous drivers and deleterious or neutral passengers. Mildly-deleterious passengers, alongside rare but strongly-advantageous drivers, proved to be most consistent with genomic and epidemiological data9. Although passengers exhibit individually weak effects on progression, their cumulative effect can commensurate with that of drivers because of their disproportionately high numbers, leading to a tug-of-war between drives and passengers8,9. As such, passengers can reverse and prevent tumor growth in models where population size can freely fluctuate (Fig. 1). Passenger’s deleterious effects are most pronounced at elevated mutations rates, i.e. Genomic Instability—a phenomenon termed mutational meltdown in other evolving asexual populations13. The predictions of these evolutionary models, however, remain experimentally untested.
Other recent studies find that passengers can increase tumor immunogenicity 14–17 and that very high genomic instability correlates with improved clinical outcomes14,18,19,37 or reduced cell proliferation20,21. However, most of these studies focus on single nucleotide
A
uthor Man
uscr
ipt
A
uthor Man
uscr
ipt
A
uthor Man
uscr
ipt
A
uthor Man
uscr
ipt
variants or whole chromosomal gains and losses, and provide a correlative, but not causal, link between mutational load and clinical response.
Here we developed human cell line and mouse models to directly assess the effects of passenger load on cell fitness and carcinogenesis. We found that passengers were deleterious to cell fitness and tumor progression in a manner independent of the immune system. We identified a metric of the aggregate passenger load of chromosomal alterations that best explains the effects of passengers on the fitness of cell lines and human cancers. In mouse models, we demonstrated that genomic instability considerably slows tumor growth and that elevated passenger load reduce metastatic burden. Our findings indicate that cumulative effect of passenger events is damaging, affecting cancer progression and suggest potential therapeutic avenues to exploit deleterious passengers.
Materials and Methods
In vitro fitness assay
MCF10A cells were obtained from the American Type Culture Collection. NeuT was transmitted via retrovirus and control empty virus (under blasticidin selection) as in our prior publications22 and Her2 expression was confirmed (data not shown). Two days
post-infection, mild blastocidin (10µg/ml) selection was used to ensure transformation. Growth rates, i.e. inverse doubling time, were measured by direct cell counting on a glass plate for two days. DNA, for genotyping, was isolated and prepared as in our previous publication23.
Metastatic assay of MCF-10A cells with increasing passenger load
MCF-10A cells pre-injection were treated with doxorubicin as described above. However, in this experiment, there was no cloning after mutagenesis; instead, cells were given a 6-day drug free recovery period. Lower growth rates for both treatment groups (10 nM – 20.38 h and 20 nM – 20.81 h) relative to untreated control cells (18.90 h), post recovery was confirmed—as seen in the first experiment. 2.5 × 10⁶ cells, with stable expression of firefly luciferase, were injected into the tail vein of female SCID mice and imaged once per week for seven weeks. Thoratic-region bioluminescent signal was determined (photons/sec ± SEM). Ex-vivo bioluminescence of surgically resected tumors was imaged and individual metastases, defined as isolated bioluminescent foci, counted. Ex-vivo bioluminescence agreed well with in situ thoratic-region bioluminescence at week 7.
Mouse model of tumor progression with elevated mutation rates
Experiments were preformed using a MMTV-neu mouse model of Her2-positive breast cancer.
MMTV-neu (F) mice were crossed with homozygous H2AX−/− (M) mice to generate neuT+/−H2AX+/− haploinsufficient progeny defective in repair of single and double strand DNA breaks23. MMTV-neu (F) mice were also crossed with control FVB/NJ (M) mice to generate neuT+/−H2AX+/+ progeny. Tumor emergence and sizes were measured every other day. After tumors grew to appreciable size, animals were sacrificed and tumors removed. DNA was prepared as described above.
A
uthor Man
uscr
ipt
A
uthor Man
uscr
ipt
A
uthor Man
uscr
ipt
A
uthor Man
uscr
ipt
All animal care, experimentation, and sacrifice were conducted humanely in compliance with ethical standards.
Human and mouse genotyping
Genotyping was preformed using a combination of Affymetrix Genome-wide Human SNP Arrays 6.0 and low-coverage (mean 0.4×) DNA sequencing (Illumina HiSeq 2000). This depth permitted CNV calls at a resolution of 20 kb. Reads were mapped to HG19 and MM9 (See SI). Metastatic samples were not genotype because, after the first experiment, we found that growth rate correlated more closely with Doxorubicin exposure (r = −0.89) than our best genomic-based metric of passenger load (LASSO model, r = 0.87).
DNA copy number was determined using the GLAD software package (for SNP arrays) and cn.MOPS24 (for low-coverage sequencing, Table S1 & Table S2). CNAs were then identified by integer transformation of the CN tracks (assuming no stromal contamination, nor sub-clonal alterations; See SI). All samples were near-diploid. CNAs were called using two approaches: a high specificity set and a high sensitivity set. The later proved more internally reproducible and also more consistent with mutagen exposure (Fig. S1).
Ancestral CNAs (existing in the cell lines prior to experimentation) were removed from MCF-10A lines by identifying an ancestral genome using a maximum parsimony approach (See SI). We did not expect and did not find any shared CNAs between mouse samples, as the mice had stable diploid genomes.
Genomic analysis
Putative drivers were identified using recurrence data from prior large-scale human breast sequencing projects (TCGA). A list of putative oncogenes and tumor suppressors (Table S3) were identified using the GISTICII algorithm3 thresholded to p < 0.001. For mouse
analyses, the identified human drivers were mapped to their close mouse homologs via BioMart25 (Table S3; all genomic annotations in humans had good homology to mice). For an alteration to be annotated as a driver, it was required to either be an amplification that (at least partially) overlapped an oncogene, or be a deletion that (partially) overlapped a tumor suppressor. Driver events, by design, were rare in our experimental cell lines (Table S1 & S2) and did not appreciably alter passenger load nor cell-doubling time.
We explored a wide variety of genomic features that were perturbed by passenger alterations and how these perturbations might, quantitatively, affect cell fitness. 3,804 human
housekeeping genes were identified in a previous study26 and used alongside annotations of all Open-Reading Frames (ORFs)27 to develop measures of Housekeeping Disturbance and Total Gene Disturbance, i.e. the number of (housekeeping) genes altered by a passenger weighted by their Copy Number change. Copy Number change is the absolute difference between the observed ploidy and 2 (euploid/diploid). Gene expression levels (average of replicates) of Her2-activated and w.t. MCF-10a cell lines were identified previously28 and used for estimating passenger load. Expression Disturbance was calculated by weighting the expression level of ever ORF altered by a passenger (sum of expression of each ORF) weighted by the Copy Number change of the passenger. Focal CNAs were defined as CNAs that neither began nor ended in a telomere-annotated region or a centromere-annotated
A
uthor Man
uscr
ipt
A
uthor Man
uscr
ipt
A
uthor Man
uscr
ipt
A
uthor Man
uscr
ipt
region, as defined by the Human Genome Browser at UCSC 27. Lastly, 95 genotyped and sequenced human breast cancers were also studied and obtained previously29.
A LASSO-Regularized Linear Model was constructed from a combination of all of the above features to predict cell-doubling time (for MCF-10a cell lines) and to predict driver load (for sequenced TCGA breast cancers). Regression fits were calculated numerically via the scikit-learn package30 and a consensus fit of 10,000 randomly-initiated iterations was obtained for every model. A L1 weight of α = 10−3 was chosen as this value preceded the downward inflection in adjusted-R2, relative to increasing α, that is typically seen during model selection30 (Fig. S3).
Simulations
A first-order Gillespie Algorithm8 modeled individual cells in a precancerous population. Cells could divide and die at rates determined by population size and their internal
genotypes, which acquired advantageous driver and deleterious passengers during division. Phenotypes other than cell fitness were not explicitly modeled. Driver phenotypes that increase cell division, avoid cell death, or expand the tumor microenvironment (e.g. via invasion) are mathematically equivalent in our formalism.
Results
Effect of passengers on proliferative fitness of cancer cells
To directly test for the effects of passenger load on proliferative fitness in cancer cells, we developed cell lines with nearly-identical drivers and controlled passenger loads (Fig. 2A). First, spontaneously-immortalized, and genomically-stable human breast epithelial cells (MCF-10A) were transformed with a single driver—activated Her2/Erbb2 oncogene—using a retroviral expression system23,31. To ensure genomic homogeneity of the initial
population, an individual clone was isolated after transformation and alterations in this clone were inferred and used as a baseline for subsequent genomic analysis (Fig. S1). Cells from this clone were treated with different doses of doxorubicin at sub-lethal, sub-clinical levels (0 – 30 nM) overnight. The time of exposure to mutagen was less than the time needed for a single cell division, therefore selective forces in the mutagenic environment should be minimal. Doxorubicin, a topoisomerase II inhibitor, introduces copy-number alterations, mimicking natural genomic instability32, and at rates several orders of magnitude higher than point mutations 33. Activation of the Her2 pathway suppresses repair of these alterations by suppression of double-strand break repair 23. Cell lines were then given a 2-week recovery period to eliminate any residual doxorubicin toxicity and cellular stress. Individual clones were isolated from each mutagenized population to ensure genomic homogeneity within each sample (Fig. 2A). As a control, un-transformed MCF-10A cells were subjected to the same protocol.
In agreement with our hypothesis, increasing passenger load negatively correlates with doubling time—cells with the highest passenger load (20 nM and 30 nM Doxorubicin exposure) grew >30% slower than un-mutagenized strains (Fig. 2B). Doubling times were measured by daily cell counting on plates for three days. Mutagen exposure alone cannot
A
uthor Man
uscr
ipt
A
uthor Man
uscr
ipt
A
uthor Man
uscr
ipt
A
uthor Man
uscr
ipt
explain this growth reduction since untransformed MCF-10A cells (with functioning DNA repair) exposed to doxorubicin accumulated few additional passengers and did not show reduction in growth rate (Fig. 2C). Taken together these results show that proliferative fitness of cancer cells declines with accumulated passengers load.
Genotyping of the developed cell lines, using a combination of SNP-array and low-coverage whole-genome sequencing, confirmed that (i) increasing doxorubicin levels incur greater quantities of alterations that are classified as passengers by existing methods, that (ii) very few additional known drivers accumulated (mean 1.4/sample), and that (iii) accumulated passengers did not avoid functional genomic elements, such as housekeeping genes, or genes in general. Similarly, clinical passengers do not avoid these functional elements (Table S1 & Fig. 3A). While mutations generally do not accumulate in these regions in natural
populations, the Deleterious Passenger Model argues that the selective forces that weed-out these mutations are suppressed in cancer8. Her2-transformed clones treated with 20–30nM doxorubicin acquired on average 296 novel alterations that would be classified as passengers by existing algorithms—significantly higher than the untransformed MCF-10A cells exposed to same doxorubicin levels (p < 0.005, Table S1). Thus, these lines constitute an ideal system to study the effects of increasing passenger loads on cell with nearly-identical drivers (Methods, Table S2).
Evaluating fitness effect of accumulated passengers
Next we asked whether passenger load could quantitatively predict reduction in proliferative fitness of cancer cells. We considered several measures of passenger load (detailed below) that summarize various properties of these alterations and their effects (Fig 3B). Every measure positively correlated with cell doubling time, strongly supporting the notion that passenger load slows tumor growth (Fig. 3C).
Measures, broadly speaking, can consider properties of the CNAs themselves—their length, copy number, and termini—or they can consider properties of the genes altered by each CNA. Gene naïve measures can simply consider the number of CNAs, or they can weight each CNA by its length and absolute change in copy number, termed CNA Volume 34,35 (Fig. 3B). Because CNAs vary tremendously in length (Fig. S3A), we also considered volumetric measures of CNAs that attenuate the weight given to very-long CNAs, e.g. Capped CNA Volume (which caps the weight of a CNA at 2Mbs).
Of the gene naïve measures, measures that weight CNAs by their length, but attenuate weights for very long CNAs, predict fitness effects best (Fig. 2C). Longer CNAs disturb more genetic elements and, thus, incur greater fitness cost. Fitness costs attenuate for very long CNAs in our cell line experiments and analyses of clinical breast cancers (see below). While Capped CNA Volume proved to be the most predictive, all measures negatively correlated with growth rate (p < 0.05, Fig. S2C), indicating that passengers are deleterious by any measure.
The attenuation of fitness costs for very long CNAs was unexpected, so we considered two possible explanations. First, we suspected that non-focal CNAs—alterations that either begin or end at a centromere or telomere—might confer weaker fitness effects per Mb than focal
A
uthor Man
uscr
ipt
A
uthor Man
uscr
ipt
A
uthor Man
uscr
ipt
A
uthor Man
uscr
ipt
CNAs, as they are categorically-different lengths (Fig. S2A) and less likely to form gene fusions. Ignoring non-focal CNAs predicted cell fitness better than raw CNA Volume, but still worse than attenuated CNA Volume metrics—supporting this hypothesis. Alternatively, very long CNAs may only accumulate in the tumor population when their fitness cost is considerable. If so, then the very long CNAs that do accumulate should be less deleterious. Indeed, very long CNAs in clinical cancer samples appear to be depleted relative to a null model of CNA mutations34. Therefore, the location of CNA termini and selection against very long CNAs may explain the attenuated fitness costs of very long CNAs.
We then tested ‘gene aware’ metrics of passenger load. We considered (i) the number of altered genes, termed Gene Disturbance; (ii) the number of altered housekeeping genes, termed Housekeeping Disturbance, and (iii) the number of altered genes weighted by their expression termed Expression Disturbance. For all of these measures, each passenger’s effect was also weighted by the absolute change in copy number of affected genes (See Methods). All of these measures predicted fitness of cells with variable passenger load better than CNA Volume, but not appreciably (Fig. 3C). This suggests that (essential) genes and their altered expression partial explain passenger load, but that the passenger’s harm extends beyond coding regions of the genome.
We further validated these characteristics of passenger load using clinical breast cancer data. Our evolutionary tug-of-war model predicted9 that passenger load must be counterbalanced by additional drivers (SI). Consistently with these predictions we observed a positive linear relationship between simple passenger load (e.g. number of non-synonymous passenger mutations) and the number of identified drivers in cancer genomics data9. Our improved measures of passenger load developed here can also be evaluated on their ability to correlate with the number of driver mutations in cancer genomics data. We found that our measures of passenger load, and Capped CNA volume in particular, indeed exhibited improved linear relationships with the number of driver events (Table 1), further supporting the tug-of-war between drivers and passengers8,9.
Lastly, we developed a LASSO-regularized, combined linear model that compared all passenger load metrics, including gene naïve and gene aware measures, to predict cell fitness (doubling time) and the driver load (Table 1, Table S3). Our combined model outperformed any single metric (even after correcting for degrees of freedom) when predicting either cell-doubling time in our experimental cell lines or driver load in clinical breast cancers (adjusted R2 = 0.63 & 0.74 respectively). Thus, carefully combining measures improves predictions of cell line fitness and driver load better than any single metric. In this combined model, gene aware measures were most useful, suggesting that the most accurate description of passenger fitness cost must consider multiple genomic properties of each passenger.
By vetting passenger load metrics on two orthogonal datasets with two approaches, we strengthened the conclusions of our fitness predictions. Passenger metrics that predicted cell-doubling time better also predicted driver load better (Spearman Correlation = 0.6, p < 0.001), and were also more informative to combined linear models. This consilience, which cannot be due to over-fitting of a particular dataset, favors Capped CNA as the most useful single metric.
A
uthor Man
uscr
ipt
A
uthor Man
uscr
ipt
A
uthor Man
uscr
ipt
A
uthor Man
uscr
ipt
Developed cell lines that carry differential passenger loads and the same drivers also allow us to directly measure the fitness cost of passenger alterations. By regressing the growth rate to Capped CNA Volume we find a mean fitness cost of 0.027 per MB, 95% CI [0.0213, 0.056] (Fig. 2C, p < 0.0001), i.e. a ~2.7% per Mb growth reduction for <2Mb CNAs and a ~5% growth reduction per CNA longer than 2 Mb. This measurement is in excellent agreement with our earlier inference of fitness loss per Mb for CNA in human cancers (2%-10% depending on the chromosome), which was based on analysis of ~40,000 intra-chromosomal-arm CNAs from more than 3,000 cancer specimens and Chromosome Conformation Capture, Hi-C, data34.
Moreover, this estimated CNA fitness cost further allows us to quantify the total passenger load of human breast cancers. We calculate that on average a breast cancer sample has a Capped CNA Volume of 146 MB, that translates into an estimated >300% hindrance of tumor growth by passenger CNAs. This dramatic effect of passengers helps to explain some observations in the literature. In particular, why tumors with high levels of alterations have better prognosis than those with moderate levels 18,36 and, most recently, that this is a general phenomenon across cancers 37.
While seemingly high, this large collective effect of passengers is consistent with previous evolutionary modeling and genomic analyses, which find that drivers and passengers are in a delicate balance and the total fitness cost of passengers is barely outweighed by the
collective benefit of drivers (each driver leading to a 20–60% average increase of fitness 9,38). Taken together, results of the cell line experiment combined with genomic analysis show that cancers carry a high passenger load that substantially reduces cell fitness.
Effect of passengers on tumor growth in mice
To investigate the effects of passengers of other aspects of cancer development, emphasizing clinical utility, we turned to mouse cancer models. We first used transgenic mice to
investigate the effects of increased genomic instability (inducible by cytotoxic39 and targeted40 chemotherapies) on tumor growth. Unlike traditional paradigms, where genomic instability always accelerates carcinogenesis1,41, we predicted that tumor growth can be slowed or even suppressed when mutation rates exceed a critical level9 (SI). To test this prediction, we created mouse models of breast carcinogenesis with high and low alteration rates by crossing a MMTVneu mouse model of Her2-positive breast cancer23 (mice containing a single driver— activated Her2 (NeuT) expressed in the mammary epithelium), with mice containing a homozygous deletion of histone H2AX that is necessary for DNA double-strand break repair31 (SI). Hybrid progeny carried a single copy of the NeuT oncogene and were H2AX haploinsufficient. As a control, we used animals that also carried a single copy of NeuT and both copies of H2AX gene. Tumors emerged after a median of 10 months in both H2AX+/− and in control (Fig. 4A).
Strikingly, we found that cancers grew significantly slower (p < 0.001) in mice with high mutation rates relative to control tumors (Fig. 4AB), thereby demonstrating that (i)
passengers are deleterious in organismal environments, and that (ii) genomic instability can be detrimental to tumor growth 1,42. Low-coverage sequencing of 7 isolated, un-cloned tumors identified a non-significant increase in accumulated passengers in H2AX+/− mice, as
A
uthor Man
uscr
ipt
A
uthor Man
uscr
ipt
A
uthor Man
uscr
ipt
A
uthor Man
uscr
ipt
expected (Fig. 4C, p = 0.11, two-sided t-statistic of Capped Volume). One H2AX+/+ tumor appeared to acquire a mutator phenotype and also grew slower, consistent with our model (Table S2).
We then tested additional quantitative predictions of our tug-of-war model between drivers and passengers. Since the H2AX+/− tumors grew slower, their mutation rate should exceed the critical mutation rate that we predicted theoretically for the tug-of-war model between drivers and passengers (SI). Indeed, the H2AX+/− tumors mean mutation rate (28 MB/y 95% CI: 13—44) was ~10× greater than human breast cancers (2.7 MB/y 95% CI: 2.3—3.2). The theory also predicts that more mutagenic and slowly growing cancer contain
disproportionately more passengers that prevent accumulation of more drivers and hence slow down tumor growth9. In fact, H2AX+/− tumors did not exhibit more drivers (Table S2, p > 0.5, two-sided t-statistic) than faster growing tumors, consistent with their suppressed accumulation by an overwhelming number of passenger (despite the higher mutation rate). Drivers were classified as amplified/deleted mouse homologs to the human oncogenes/tumor suppressors identified above (Table S3). This analysis provides direct support for a tug-of-war between drivers and passengers, where passengers are as consequential as drivers, in an organismal environment during cancer development.
Effect of passengers on metastases in mice
Next we asked whether passengers impacted not only primary tumor growth, but also metastatic development. Our theory (SI) indicates that passenger load is particularly detrimental for metastatic progression because it can both prevent and slow the growth of micrometatases. Because our transgenic mouse model does not metastasize, we used Her2-tranformed MCF-10A cells, with increasing passenger loads (see above), to investigate metastatic progression. These cells were (i) transfected with a luciferase reporter, (ii) injected into the tail vein of SCID female mice, and (iii) monitored for lung metastases in situ via thoracic bioluminescence. Metastases arose after week 4 (Fig. 4A) in all groups and grew faster in the unmutagenized strains, confirming our results. After 7 weeks, mice were sacrificed and the number of metastases in the mutagenized (10/20 nM Doxorubicin exposure) strains was 12-fold lower (95% CI: 9—19) than control groups, while aggregate metastatic load (bioluminescence) was 80-fold (95% CI: 54—128) lower (Fig. 4BC). Thus, both the number of metastases and their average size declined with passenger load. Fewer observed metastases could arise (i) because fewer disseminating cells colonized/engrafted into new stroma, (ii) because slower growth kept some metastases undetectable at 7 weeks, or (iii) because passengers occasionally prevent the growth of already colonized cells. Because total burden was far less than would be expected from the cell line experiments, we believe that this second hypothesis cannot fully explain our observations. Our theory argues that this final possibility—unsuccessful progression of micrometastases—explains our observations. We did not, however, directly interrogate these three possibilities. The slower observed growth rates of metastases that we measured by direct bioluminescent monitoring supports our hypothesis that passengers slow growth in a variety of microenvironmets. Overall, passenger load dramatically reduces total metastatic progression and burden in our mouse experiments.
A
uthor Man
uscr
ipt
A
uthor Man
uscr
ipt
A
uthor Man
uscr
ipt
A
uthor Man
uscr
ipt
Discussion
Our findings indicate that accumulated passengers can be directly deleterious to cancer, by reducing cell proliferative fitness, significantly slowing down cancer growth, and impeding metastatic progression. Overall, we confirm several distinctive predictions of the deleterious passenger model: (i) that aggregate passenger load can overpower drivers and slow or prevent tumor progression, (ii) that passengers have a deleterious fitness cost of ~0.1—1% per event, (iii) that exceptionally high mutation rates inhibit carcinogenesis, and (iv) that deleterious passengers can limit metastatic progression. These predictions were previously made using evolutionary simulations, theoretical analysis, and genomic analysis8,9
(summarized in the SI). In our new paradigm, genomic instability is a double-edged sword: it accelerates driver events, but eventually accumulates intolerable quantities of deleterious passengers.
Deleterious passengers can be a clinical diagnostic and a targeted phenotype. The direct anti-cancer effect of passengers that we found here can also explain how some of the most common chromosome-damaging chemotherapies work. Moreover, our findings suggest that increasing passenger load by genotoxic chemotherapies can have a more profound effect on tumors with initially higher passenger loads. This prediction is consistent with earlier findings18,19, as well as a recent and extensive pan-cancer study37, that demonstrated significant reduction in mortality from cancers with the highest load of chromosomal alterations.
Recent studies also suggest that passengers trigger anti-cancer immune responses14–17. This immunogenic role of passengers supplements and synergize with the direct effects of passengers on cancer that we demonstrate here. Lastly, our theory predicts that deleterious segregating (i.e. subclonal/private) passengers should interfere with the acquisition of new drivers43 and thus reduce genetic diversity44,45, which has been shown to be associated with drug resistance and survival both in our evolutionary modeling8 and in pan-cancer clinical analyses37. Therefore, deleterious passengers not only slow tumor progression, but also limit its mode of evolution—reducing the probability of resistance, and preventing or slowing metastatic progression.
Accurately characterizing passenger load is essential to many clinical efforts. Quantifying passenger load for use as a genomic biomarker is challenging because the effect of individual mutations varies. We addressed this challenge by weighting passenger’s impact by their length, copy number, and effect on genes, and found that all of these factors are relevant. Overall, larger CNAs tend to be more deleterious, although this effect attenuates at very large sizes and the deleterious effects of passengers are not confined to their effects on housekeeping genes. This is consistent with findings in natural populations where
moderately deleterious mutations primarily cause cytotoxic stress via protein misfolding, dis-balance and aggregation19,46,47, and not by abrogating essential gene function. Our quantitative measures accurately predicted experimentally-measured fitness and cancer genomic patterns. Experiments directly studying whole-chromosome aneuploidy report similar findings: aneuploid cells showed lower proliferative fitness20. Here, however, we were able to develop a more quantitative and precise model of this effect (by virtue of our
A
uthor Man
uscr
ipt
A
uthor Man
uscr
ipt
A
uthor Man
uscr
ipt
A
uthor Man
uscr
ipt
genotyping and study of shorter, focal CNAs). More ubiquitous and better genotyping methods (that characterize genomic rearrangements, SNMs in intergenic regions, epigenetic changes, and sub-clonal mutations) should improve our already useful measures of
passenger load.
Therapeutics could therefore target cancer’s deleterious passenger load by increasing passenger deleteriousness. Proposals to exacerbate passenger deleteriousness include (i) targeting essential cell functions lost by passenger deletions48; (ii) increasing cytotoxic stress caused by passengers19; (iii) increasing passenger load via DNA-damaging therapies49 and (iv) neoantigenic immune therapies14. Our experimental findings clinically-benefit these efforts by (a) validating passenger’s deleterious phenotype, (b) identifying a biometric to direct such therapies, and (c) suggesting that these treatments will work best at metastatic prevention and in conjunction with mutagenic therapies.
Supplementary Material
Refer to Web version on PubMed Central for supplementary material.
Acknowledgments
We would like to thank Shamil Sunyaev, Angelica Amon, Arig Ibrahim-Hashim, Priya Bapat and members of the Mirny Lab for helpful discussions.
Financial Support: This project was supported by National Cancer Institute (NCI) Grants R01CA176326 to
M.Y.Sherman and L.A.Mirny, and U54CA193419 to L.A.Mirny. C.D. McFarland was partially supported by the Cancer Systems Biology Scholars program at Stanford University (funded by NCI Grant E25CA180993). This work has been supported in part by the Shared Resources at the H. Lee Moffitt Cancer Center & Research Institute, an NCI designated Comprehensive Cancer Center (P30-CA076292).
References
1. Burrell, Ra, McGranahan, N., Bartek, J., Swanton, C. The causes and consequences of genetic heterogeneity in cancer evolution. Nature. 2013; 501:338–45. [PubMed: 24048066]
2. Vogelstein B, et al. Cancer genome landscapes. Science. 2013; 339:1546–58. [PubMed: 23539594] 3. Lawrence MS, et al. Discovery and saturation analysis of cancer genes across 21 tumour types.
Nature. 2014; doi: 10.1038/nature12912
4. Castroginer F, Ratcliffe P, Tomlinson I. The minidriver model of polygenic cancer evolution. Nat. Publ. Gr. 2015; 15:680–685.
5. Nussinov R, Tsai C. ScienceDirect “Latent drivers” expand the cancer mutational landscape. Curr. Opin. Struct. Biol. 2015; 32:25–32. [PubMed: 25661093]
6. Merlo LMF, Pepper JW, Reid BJ, Maley CC. Cancer as an evolutionary and ecological process. Nat Rev Cancer. 2006; 6:924–935. [PubMed: 17109012]
7. Bozic I, Gerold JM, Nowak MA. Quantifying Clonal and Subclonal Passenger Mutations in Cancer Evolution. PLOS Comput. Biol. 2016; 12:e1004731. [PubMed: 26828429]
8. McFarland CD, Korolev KS, Kryukov GV, Sunyaev SR, Mirny La. Impact of deleterious passenger mutations on cancer progression. Proc. Natl. Acad. Sci. 2013; 110:2910–2915. [PubMed:
23388632]
9. McFarland CD, Mirny La, Korolev KS. Tug-of-war between driver and passenger mutations in cancer and other adaptive processes. Proc. Natl. Acad. Sci. 2014; 111:15138–15143. [PubMed: 25277973]
A
uthor Man
uscr
ipt
A
uthor Man
uscr
ipt
A
uthor Man
uscr
ipt
A
uthor Man
uscr
ipt
10. Kelly LM, Barila G, Liu P, Evdokimova VN, Trivedi S. Identification of the transforming
STRNALK fusion as a potential therapeutic target in the aggressive forms of thyroid cancer. 2014; 111:4233–4238.
11. Kimura M. Model of effectively neutral mutations in which selective constraint is incorporated. 1979; 76:3440–3444.
12. Paland S, Lynch M. Transitions to asexuality result in excess amino acid substitutions. Science. 2006; 311:990–2. [PubMed: 16484491]
13. Gabriel W, Lynch M, Burger R. Muller’s Ratchet and Mutational Meltdowns. Evolution (N. Y). 1993; 47:1744.
14. Rooney MS, Shukla Sa, Wu CJ, Getz G, Hacohen N. Article Molecular and Genetic Properties of Tumors Associated with Local Immune Cytolytic Activity. Cell. 2014; 160:48–61.
15. Yadav M, et al. Predicting immunogenic tumour mutations by combining mass spectrometry and exome sequencing. Nature. 2014; 515:572–576. [PubMed: 25428506]
16. Gubin MM, et al. Checkpoint blockade cancer immunotherapy targets tumour-specific mutant antigens. Nature. 2014; 515:577–581. [PubMed: 25428507]
17. Snyder A, et al. Genetic Basis for Clinical Response to CTLA-4 Blockade in Melanoma. N. Engl. J. Med. 2014; 371:2189–2199. [PubMed: 25409260]
18. Birkbak NJ, et al. Paradoxical relationship between chromosomal instability and survival outcome in cancer. Cancer Res. 2011; 71:3447–3452. [PubMed: 21270108]
19. Sheltzer JM, Amon A. The aneuploidy paradox: costs and benefits of an incorrect karyotype. Trends Genet. 2011; 27:446. [PubMed: 21872963]
20. Williams BR, et al. Aneuploidy Affects Proliferation and Spontaneous Immortalization in Mammalian Cells. Science (80-.). 2008; 322:703–709.
21. Weaver BAA, Silk AD, Montagna C, Verdier-Pinard P, Cleveland DW. Aneuploidy acts both oncogenically and as a tumor suppressor. Cancer Cell. 2007; 11:25–36. [PubMed: 17189716] 22. Schvartzman J-M, Sotillo R, Benezra R. Mitotic chromosomal instability and cancer: mouse
modelling of the human disease. Nat. Rev. Cancer. 2010; 10:102–115. [PubMed: 20094045] 23. Yaglom JA, McFarland C, Mirny L, Sherman MY. Oncogene-triggered suppression of DNA repair
leads to DNA instability in cancer. Oncotarget. 2014; 5:8367–78. [PubMed: 25252808] 24. Klambauer G, et al. Cn.MOPS: Mixture of Poissons for discovering copy number variations in
next-generation sequencing data with a low false discovery rate. Nucleic Acids Res. 2012; 40:1– 14. [PubMed: 21908400]
25. Guberman JM, et al. BioMart Central Portal: an open database network for the biological community. Database. 2011; 2011:bar041–bar041. [PubMed: 21930507]
26. Eisenberg E, Levanon EY. Human housekeeping genes, revisited. Trends Genet. 2013; 29:569–74. [PubMed: 23810203]
27. Kent WJ, et al. The Human Genome Browser at UCSC. Genome Res. 2002; 12:996–1006. [PubMed: 12045153]
28. Aceto N, et al. Co-expression of HER2 and HER3 receptor tyrosine kinases enhances invasion of breast cells via stimulation of interleukin-8 autocrine secretion. Breast Cancer Res. 2012; 14:R131. [PubMed: 23062209]
29. Stephens PJ, et al. The landscape of cancer genes and mutational processes in breast cancer. Nature. 2012; 486:400–404. [PubMed: 22722201]
30. Pedregosa F, et al. Scikit-learn: Machine learning in Python. J. Mach. Learn. Res. 2011; 12:2825– 2830.
31. Sherman MY, Meng L, Stampfer M, Gabai VL, Yaglom Ja. Oncogenes induce senescence with incomplete growth arrest and suppress the DNA damage response in immortalized cells. Aging Cell. 2011; 10:949–961. [PubMed: 21824272]
32. Quiles JL, Huertas JR, Battino M, Mataix J, Ramírez-Tortosa MC. Antioxidant nutrients and adriamycin toxicity. Toxicology. 2002; 180:79–95. [PubMed: 12324201]
33. Donahue SL, Lin Q, Cao S, Ruley HE. Carcinogens induce genome-wide loss of heterozygosity in normal stem cells without persistent chromosomal instability. Proc. Natl. Acad. Sci. 2006; 103:11642–11646. [PubMed: 16868089]
A
uthor Man
uscr
ipt
A
uthor Man
uscr
ipt
A
uthor Man
uscr
ipt
A
uthor Man
uscr
ipt
34. Fudenberg G, Getz G, Meyerson M, Mirny La. High order chromatin architecture shapes the landscape of chromosomal alterations in cancer. Nat Biotechnol. 2011; 29:1109–1113. [PubMed: 22101486]
35. Zack TI, et al. Pan-cancer patterns of somatic copy number alteration. Nat Genet. 2013; 45:1134– 1140. [PubMed: 24071852]
36. Carter SL, Eklund AC, Kohane IS, Harris LN, Szallasi Z. A signature of chromosomal instability inferred from gene expression profiles predicts clinical outcome in multiple human cancers. Nat Genet. 2006; 38:1043–1048. [PubMed: 16921376]
37. Andor N, et al. Pan-cancer analysis of the extent and consequences of intratumor heterogeneity. Nat. Med. 2015; 22:105–113. [PubMed: 26618723]
38. Vermeulen L, et al. Defining stem cell dynamics in models of intestinal tumor initiation. Science (80-.). 2013; 342:995–998.
39. Duesberg P, Stindl R, Hehlmann R. Explaining the high mutation rates of cancer cells to drug and multidrug resistance by chromosome reassortments that are catalyzed by aneuploidy. Proc. Natl. Acad. Sci. U. S. A. 2000; 97:14295–14300. [PubMed: 11121035]
40. Wang ZC, et al. Profiles of genomic instability in high-grade serous ovarian cancer predict treatment outcome. Clin Cancer Res. 2012; 18:5806–5815. [PubMed: 22912389] 41. Frank, SA. Dynamics of cancer: Incidence, Inheritance, and Evolution. 2007.
42. Jackson, aL, Loeb, La. The mutation rate and cancer. Genetics. 1998; 148:1483–1490. [PubMed: 9560368]
43. Good BH, Desai MM. Deleterious passengers in adapting populations. 2014; 198:1–25. 44. Charlesworth B, Morgan MT, Charlesworth D. The effect of deleterious mutations on neutral
molecular variation. Genetics. 1993; 134:1289–1303. [PubMed: 8375663]
45. Bachtrog D, Gordo I. Adaptive evolution of asexual populations under Muller’s ratchet. Evolution (N. Y). 2004; 58:1403–1413.
46. Boyko AR, et al. Assessing the evolutionary impact of amino acid mutations in the human genome. PLoS Genet. 2008; 4:e1000083. [PubMed: 18516229]
47. Jordan DM, Ramensky VE, Sunyaev SR. Human allelic variation: perspective from protein function, structure, and evolution. Curr Opin Struct Biol. 2010; 20:342–350. [PubMed: 20399638] 48. Muller FL, et al. Passenger deletions generate therapeutic vulnerabilities in cancer. Nature. 2012;
488:337–342. [PubMed: 22895339]
49. Lee AJX, Swanton C. Tumour heterogeneity and drug resistance: personalising cancer medicine through functional genomics. Biochem. Pharmacol. 2012; 83:1013–1020. [PubMed: 22192819] 50. Efron B. Bootstrap Methods: Another Look at the Jackknife. Ann. Stat. 1979; 7:1–26.
A
uthor Man
uscr
ipt
A
uthor Man
uscr
ipt
A
uthor Man
uscr
ipt
A
uthor Man
uscr
ipt
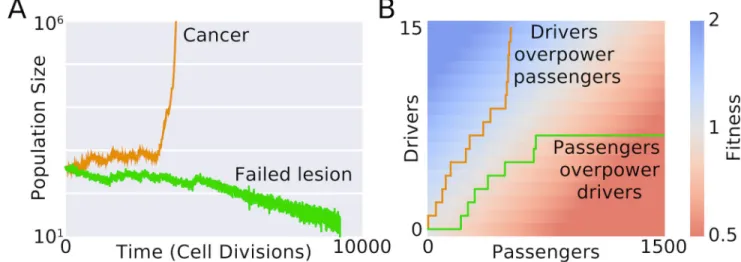
Figure 1. Accumulation of passenger mutations can slow cancer progression and lead to cancer meltdown
A. Time course of cancer development from the Deleterious Passenger Model4,5. In the model, cancer cells can acquire both strong advantageous drivers and mildly-deleterious passenger mutations. Cells divide and die stochastically depending on their fitness, while other aspects of phenotype are not explicitly modeled (Advantageous phenotypes, i.e. drivers, that increase cell division are mathematically equivalent to phenotypes that avoid cell death or expand a tumor’s microenvironment in our formalism8.) Due to a tug-of-war between drivers and passengers, initially identical lessons can either progress to cancer or regress to extinction. B Tumor fitness and population size in this model is determined by the relative abundances of drivers and passengers. Deleterious passengers accumulate in all populations despite negative selective pressures. Successful tumors acquired drivers disproportionately faster than passengers.
A
uthor Man
uscr
ipt
A
uthor Man
uscr
ipt
A
uthor Man
uscr
ipt
A
uthor Man
uscr
ipt
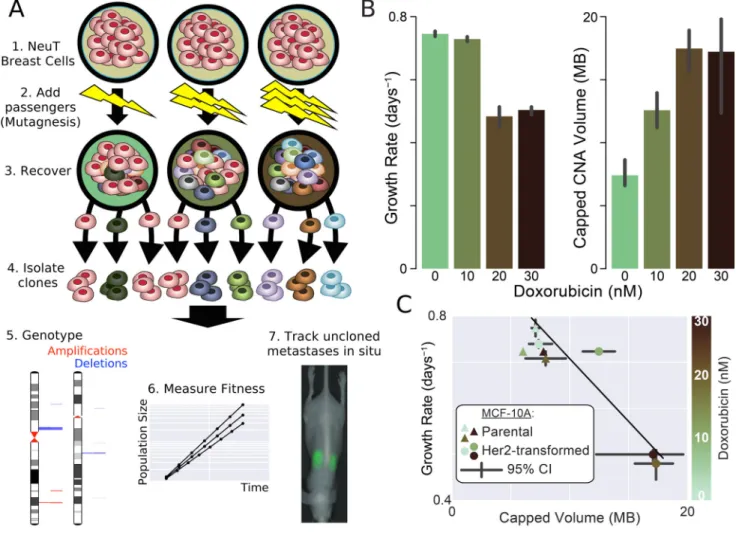
Figure 2. Passenger alterations reduce proliferative fitness of cancer cells
A Experimental design to produce cell lines with identical drivers and increasing loads of
passengers. Passenger alterations were introduced into Her2-transformed MCF-10A breast cells by low-dosage mutagenic Doxorubicin. After recovering for 2-weeks, clones were isolated, genotyped for Copy-Number Alterations (CNAs), and assayed for cell fitness and metastatic potential (Fig. 4). B Increasing dosages of mutagen decreases proliferative potential and increases passenger load, which was summarized by Capped CNA Volume (Methods, Fig. S2 & 3). C Fitness effects of cells lines versus passenger load. Data points represent the average fitness and passenger load of biological replicates at various
concentrations of Doxorubicin exposure. The fitness cost of passengers in transformed cells was 0.028 MB−1 (r2 = 84%, 95% CI: 64—99%). Untransformed cells neither acquired passengers nor decreased in proliferative potential, suggesting that passengers—not doxorubicin toxicity—reduces fitness. Error bars (95% CI) and p-values were calculated using bias-corrected bootstrapping throughout this study50.
A
uthor Man
uscr
ipt
A
uthor Man
uscr
ipt
A
uthor Man
uscr
ipt
A
uthor Man
uscr
ipt
Figure 3. Measures of passenger load predict experimental cell line fitness and mutational patterns in TCGA breast cancers
A (Left) Passenger alterations dominated the genomes of experimental cell lines, as intended
(Low Dox = 0/10 nM; High Dox = 20/30 nM Doxorubicin). (Right) Passenger alterations in both our cell lines and TCGA cancers span genes (and housekeeping genes in particular) at rates approximately expected by random chance (determined by randomly permuting gene locations across all regions not annotated as centromeres or telomeres27). Housekeeping genes were identified previously based on ubiquitous expression26. B Passenger load—the fitness cost of all passengers in a genome—may depend upon the properties of individual passengers. CNA Volume weights each alteration by its deviation from normal copy number and its length. Gene (Housekeeping) Disturbance weights each alteration by its deviation from normal copy number and the number of (housekeeping) genes perturbed. C All passenger load measures negatively correlated with cell line growth rate. Capped CNA Volume was most predictive.
A
uthor Man
uscr
ipt
A
uthor Man
uscr
ipt
A
uthor Man
uscr
ipt
A
uthor Man
uscr
ipt
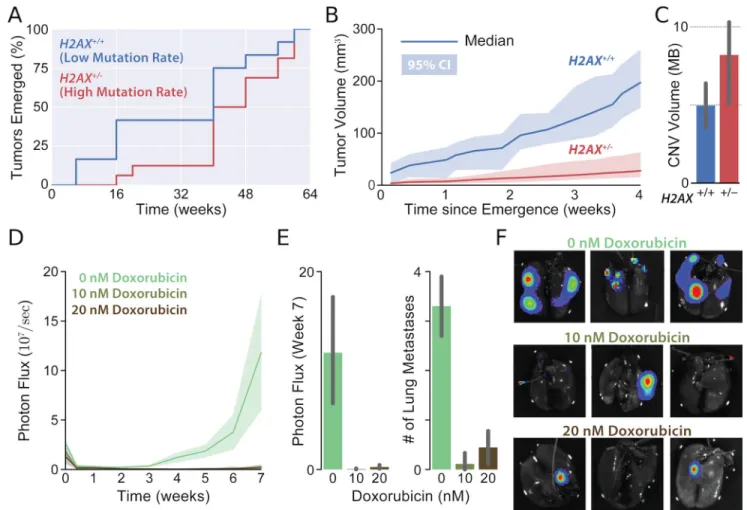
Figure 4. Elevated passenger load slows tumor growth and reduces metastasis in mice
A Her2-positive breast cancers emerged from mice in highly-mutagenic (H2AX+/−) line at similar times as in the moderate-mutagenic (H2AX+/+) line (possibly later, p = 0.05). B Tumors with elevated genomic instability (high mutation rate) grew 52% slower (95% CI: 40—66%) after emergence. Shaded regions denote 95% CI of growth determined via bootstrapping. C Genotyping confirmed that elevated mutations rates increase passenger loads. D Growth of lung metastases created by injecting Her2-transformed MCF-10A breast cells with differential passenger loads (described previously). Cell were transfected with a Luciferase reporter before mutagenesis to enable in situ thoratic bioluminescence
monitoring, and then injected into the tail-vein of SCID mice (10 per condition) without cloning. E At 7-weeks, total metastatic burden was measured and lung metastases were counted by dissection. F Representative ex-vivo bioluminescent lung images.
A
uthor Man
uscr
ipt
A
uthor Man
uscr
ipt
A
uthor Man
uscr
ipt
A
uthor Man
uscr
ipt
A
uthor Man
uscr
ipt
A
uthor Man
uscr
ipt
A
uthor Man
uscr
ipt
A
uthor Man
uscr
ipt
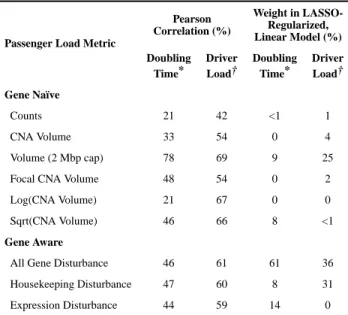
Table 1Performance of passenger load metrics
Passenger load metrics predict cell line fitness and TCGA mutational patterns in isolation and in a combined model. The Deleterious Passenger Model predicts that the tug-of-war between drivers and passengers imparts a positive linear relationship between drivers and passenger load on cancer genomes (SI)9. All measures identify this relationship in TCGA breast cancers. Combining measures into a LASSO-regularized linear model improves predictions of cell line fitness and driver load better than any single metric (adjusted R2 = 0.63 & 0.47 respectively).
Passenger Load Metric
Pearson Correlation (%) Weight in LASSO-Regularized, Linear Model (%) Doubling Time* Driver Load† Doubling Time* Driver Load† Gene Naïve Counts 21 42 <1 1 CNA Volume 33 54 0 4 Volume (2 Mbp cap) 78 69 9 25
Focal CNA Volume 48 54 0 2
Log(CNA Volume) 21 67 0 0
Sqrt(CNA Volume) 46 66 8 <1
Gene Aware
All Gene Disturbance 46 61 61 36
Housekeeping Disturbance 47 60 8 31
Expression Disturbance 44 59 14 0
*
Experimental Cell Line Data †