HAL Id: hal-00516046
https://hal.archives-ouvertes.fr/hal-00516046
Submitted on 9 Sep 2010
HAL is a multi-disciplinary open access
archive for the deposit and dissemination of
sci-entific research documents, whether they are
pub-lished or not. The documents may come from
teaching and research institutions in France or
abroad, or from public or private research centers.
L’archive ouverte pluridisciplinaire HAL, est
destinée au dépôt et à la diffusion de documents
scientifiques de niveau recherche, publiés ou non,
émanant des établissements d’enseignement et de
recherche français ou étrangers, des laboratoires
publics ou privés.
Collagen fiber network infiltration : permeability and
capillary infiltration
Elsa Vennat, Denis Aubry, Michel Degrange
To cite this version:
Elsa Vennat, Denis Aubry, Michel Degrange.
Collagen fiber network infiltration : permeability
and capillary infiltration. Transport in Porous Media, Springer Verlag, 2010, 84 (3), pp.717-733.
�10.1007/s11242-010-9537-4�. �hal-00516046�
capillary infiltration
Elsa Vennat · Denis Aubry · Michel Degrange
Received: 16 February 2009 / Accepted: 18 January 2010
Abstract In dentin restoration, collagen fiber network infiltration is an issue. Using data from the litterature, we have constructed a relevant numerical geometrical model of the network. The specificity of our model is that the fibers are taken into account implicitly using a regularized Heaviside function. This function is either used to set the viscosity or to localize the contact line where capillary forces are applied. A level set technique with respect to fluid infiltration front tracking in five fiber networks using the level set method and Navier-Stokes equations with capillary terms is used to point out efficient critical infiltration parameters. A variational formulation which can be implemented in FEM is proposed both for the infiltration front and the contact line. Because of lack of knowledge on fiber orientation, different configurations were tested through permeability assessment of the whole network. Fiber orientation, interfibrillar space and contact angle influence were investigated.
Keywords Demineralized dentin· Collagen fiber network modeling · Permeability · Level set method· Capillarity
1 Introduction
In restorative dentistry, adhesion to dentin is currently achieved by creating a mi-cromechanical seal between a resin and demineralized dentin. Demineralized dentin is a porous medium made of enlarged tubules and interfibrillar spaces between colla-gen fibrils that have been uncovered by demineralization (Figure 1). Infiltration of the
E. Vennat
Laboratoire M´ecanique des Sols, Structures et Mat´eriaux, Ecole Centrale Paris, Grande Voie des Vignes 92295 Chatenay Malabry, France
E-mail: [email protected] D. Aubry
Laboratoire M´ecanique des Sols, Structures et Mat´eriaux, Ecole Centrale Paris, Grande Voie des Vignes 92295 Chatenay Malabry, France
M. Degrange
Unit´e de Recherche Biomat´eriaux et Interfaces, Facult´e de Chirurgie Dentaire (Universit´e Paris-Descartes), 1 rue Maurice Arnoux, 92120 Montrouge, France
restorative material in the tubules leads to the creation of resin tags and the fibrous tissue infiltration leads to what is called a hybrid layer consisting of encapsulated col-lagen fibrils. This hybrid layer or micromechanical interlocking was first observed by Nakabayashi et al. [1] who stated that good bonding was not provided by resin tags. Consequently, the restoration retention quality is ruled by the quality of the hybrid layer.
Practitioners encounter a lack of durability of the seal [2] due to the incomplete and heterogeneous infiltration of this layer leading to degradation of the bond. Monomers do not always fully penetrate the porous substrate [3, 4]. A phase separation was reported by Spencer Wang [5], the collagen network playing the role of filter between resin phases. These defects of the hybrid layer lead to further degradation [6], which affects bonding durability [7].
Fig. 1: The two types of porosity of demineralized dentin
A better understanding of the infiltration of the collagen scaffold is thus a prereq-uisite to the improvement of bonding conditions. In this study, we try to model the dentinal collagen tissue geometry and its infiltration using a level set method and finite elements. This method is often used to track a front: Prodanovic & Bryant [8] used it to determine critical curvatures for drainage and imbibition for example, but to the authors’ knowledge no front tracking using this method has been done on fiber beds. Clague & Phillips [9] used the Lattice-Bolzmann method to determine layered arrays of cylinders and Schultz et al. [10] developed a Full Morphology (FM) model studying two-phase flow in an array with cylinders randomly oriented in parallel planes. The FM approach was compared to Lattice Bolzmann by Vogel et al. [11]. We chose to use the level set method since a special meshing of the front to be tracked is not needed e.g. at fiber intersections. Here, the fibers are only described through the localization of capillary forces at the triple line junction.
The final aim of this study was to test the numerically infiltrated collagen network with its future oral loading to highlight infiltration parameters that lead to sufficient quality of bonding. Thus, in this paper a model of the network and infiltration tests depending on parameters such as fluid surface tension properties and network charac-teristics are presented. We first present how we have modeled the network and validated it through Darcy’s permeability numerical tests. Then we deal with the infiltration of 3 types of network differing by the orientation of the fibers The crucial role of fiber
spac-ing and of fiber orientation is pointed out. The contact angle effect on the rise or fall of the front is also assessed. And the effect of crossing fibers that enhance infiltration rate is observed.
2 Collagen tissue modeling
After briefly describing the real network made of collagen fibers, the numerical collagen fiber network model and its validation with respect to permeability comparison with literrature values are presented.
2.1 Network modeling
It is customary to model biological materials by using magnetic resonance imaging to build a mesh. Here we are not especially interested in one realization that would need statistical analyses of many images, but by the qualitative mean features of the network. This is why we preferred to build directly a numerical network. Furthermore, the network is not modeled in a classical way: we avoid meshing problems by defining the fibers and the surrounding fluid as an heterogeneous fluid. Before detailing our modeling approach, we present basic knowledge about this network so as to have entry parameters for the model.
2.1.1 Characteristics of the real network
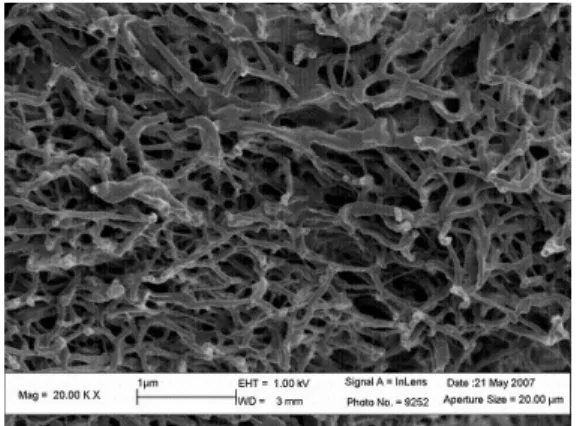
This network has been widely observed, especially by transmission electron microscopy (TEM), scanning electron microscopy (SEM) [12] and atomic force microscopy (AFM) [13]. Figure 2a is a FESEM image of the collagen network obtained after drying, which is why the fibers diameter are smaller than in the hydrated state, where the range of diameters is 50-100 nm [13]. The collagen fiber network porosity was assessed using mercury porosimetry and is roughly 55% [14]. No quantitative study on fiber orientation was done, although a dependence on localization was observed [15–17]. So, different types of network are studied in the following sections.
2.1.2 An implicitly materialized network
In our model the collagen fiber network is a cylinder network. Cylinder diameter is 80 nm and its height is larger than the control volume (a representative volume element is discussed in 2.2.2).
The geometry is not explicitly modeled but taken into account using a variable viscosity. Thus, we consider a heterogeneous fluid with two different viscosities instead of a solid immersed in a homogeneous fluid: the cylinders have a much larger viscosity than the surrounding fluid. As fiber orientation is not known deterministically, we propose to take randomly oriented networks of cylinders (RAND networks). Networks with a preferential orientation of the fibers are also built and called PAR or VERT networks. The target porosity fixes the number of cylinders in the control volume. Each cylinder center Xiis randomly set in a control volume. Then its direction aiis randomly taken for realizations of RAND networks. For PAR networks, ai verifies ai.iz= 0 with izthe third vector of the basis, that is to say, in PAR networks cylinders are placed in
(a) The collagen fiber network (b) The numerical network
Fig. 2: Real and modeled collagen fiber network
parallel planes perpendicular to izdirection. For VERT networks, aiverifies ai.iz= 1, that is to say, in VERT networks cylinders are parallel to the iz(the flow direction).
The cylinders are materialized using a Boolean sum of regularized Heaviside func-tions cyl(x, y, z) representing the cylinder distribution. Figure 2b illustrates fiber dis-tribution through the viscosity representation within the control volume. The viscosity is set (with µf, the fluid viscosity):
µ(x, y, z) = µf+ 1000∗ cyl(x, y, z) (1)
2.2 Model validation through comparison with explicit modeling and permeability assessment
2.2.1 Flow around one single fiber to validate the implicit model
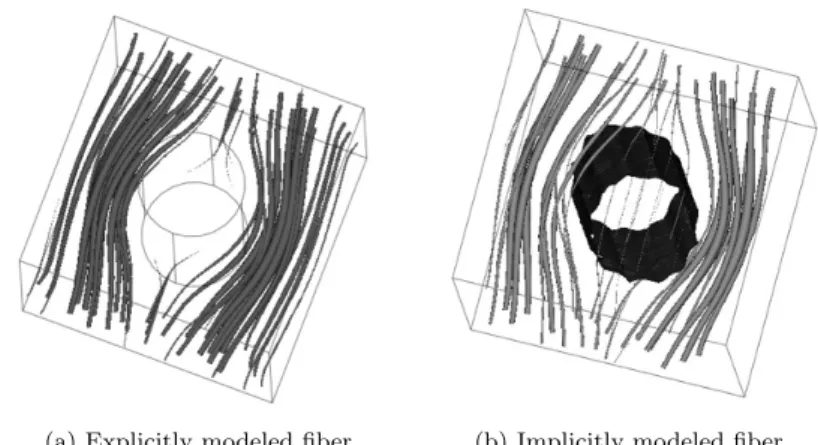
To validate our model, the equivalence between an explicitly modeled fiber (that is to say a solid fiber immersed in a fluid) and a fiber constructed with the method presented above is tested. The same pressure gradient and boundary conditions are applied to the same control volume, first with a fiber modeled as a solid cylinder then with a fiber materialized by a high viscosity. The results are illustrated in figure 4.
The flows around the two fibers are comparable and the flow inside the high vis-cosity area is vanishingly small (figure 3b). The discharge is in the same range in the two cases with one fiber (see table 1). These results confirm that the model is well fitted to simulate the flow around fibers. It is possible to set the parameters of the regularized Heaviside function (diameter and dimension of the smoothed transition) to exactly reach the same results in the two cases, but as we only know the range of the real diameter of dentinal collagen fibers, it is unnecessary to invoke such accurate computations in our study.
(a) Explicitly modeled fiber (b) Implicitly modeled fiber
Fig. 3: Streamline and velocity field plot around one fiber. (a): The fiber is explicitly modeled. The tube radius of the streamline is proportional to the velocity field. (b): The fiber is implicitly modeled : the fiber is represented by the isovalue 0.5 of the function cyl
one implicit fiber one explicit fiber no fiber Figure 3b Figure 3a (ref)
R udS
(RudS)ref(%) 12.5 17.5 100
Table 1: Permeability comparison in three cases: one implicit fiber, one explicit fiber and no fiber
2.2.2 Permeability assessment
For porous media, permeability is a key parameter. Its assessment is a way to validate our model by comparing our results with known values. The permeability changes with regards to fiber orientation are discussed in section 4, but here only a RAND network is considered. The first step in determining permeability is to choose the control volume and the boundary conditions. Then a pressure gradient is applied and Darcy’s permeability is determined.
RVE and boundary conditions
To assess permeability we have to choose an appropriate control volume that has to be a representative volume element (RVE). The RVE is usually regarded as a volume V of heterogeneous material that is sufficiently large to be statistically representative of the whole material [18]. The RVE must be sufficiently large to include a sampling of all microstructural features of the material, which means here that the RVE must include a large number of fibers. Giman et al. [19] remark that the RVE should contain enough information on the microstructure yet be sufficiently smaller than the macroscopic structural dimensions. Finally, we choose a volume of roughly 25 times a fiber diameter to assess the network permeability so that a cube of 2 µm is chosen. Whereas this modeling of the fibers has certain advantages concerning meshing, the shortcoming of the implicitly modeled fibrils is that a no slip boundary condition is necessary to prevent
the network from following the induced flow. So the RVE has to be taken inside a larger volume where we set no slip conditions (larger cube of size 4 µm) and the auxiliary smaller cube is used to assess permeability. Using such technical precautions, pertinent permeability estimations can be obtained.
Darcy’s permeability
Darcy’s permeability K was assessed using a representative control volume (defined in 2.2.2).
To determine the permeability tensor, a pressure gradient is applied to two parallel faces of the control volume:
u =−K
µ∇p (2)
This law links u, the bulk-averaged flow velocity (m/s), to the pressure gradient∇p (Pa/m) applied, µ the fluid viscosity (Pa.s) via Darcy’s specific permeability K (m2). The mean permeability for a collagen fiber network with a fiber diameter of 80 nm randomly set in the RVE to reach 55% porosity is found to be approximately:
KRAN D= 10−18m2 (3)
Comparison with other studies
This value is in agreement with experimental and semi-empirical studies (see the review of Swartz & Fleury [20]). Happel [21] proposed a relationship that gives the estimated flow resistance as a summation of the resistance of cylindrical fibers parallel and perpendicular to flow:
K = εr 2 h k , (4) where rh = (s 2 − d2)
4d ,k = (2/3)k++ (1/3)k−, s is fiber spacing (50 nm), d is fiber diameter (80 nm), ε is the network porosity (55% in our case) and given expressions of k+and k− (functions of ε).
This semi-empirical expression gives a permeability of 1.7 10−17m2.
An experimental value is also presented in the review of Swartz & Fleury [20]: according to Anand et al. [22], in vitro collagen gel permeability range is 10−16-10−18 m2. So our numerical results are in agreement with such values. We may also notice that the permeability we have found numerically is also two to four orders smaller than that of a sandstone (oil sand) (data from Scheidegger adapted by Kaviany [23]). To sum up, in this section we have defined the collagen network geometric model and validated it through different tests. The infiltration of this network and the description of influencing parameters are the purpose of the following sections.
3 Infiltration modeling
The resin flow within the network remains to be determined to better understand ”hy-bridization”. For etch-and-rinse adhesives, the resins are currently applied mechanically by practitioners with a brush or sponge. We think that both pressure and capillarity play a role in the infiltration. Our aim is to track the flow through time to see which parameters are critical for a quality seal. The challenge is to handle one more fluid (the
resin) interacting with fibers and the substrate fluid and to take into account capillary rise. To do this, the level set method is used coupled with the Navier-Stokes equations to track the front. Thus, both fibers and capillary membranes are implicitly modeled, avoiding interface meshing difficulties, but in this part the fibers are only geometrically defined to avoid stopping the level set front.
3.1 The capillary membrane
Although the equations of fluid at rest with capillary forces are classical, we derive here these equations directly from the conservation of momentum in a three dimensional framework. This is important for finite element simulations to have available a direct and complete derivation. The equilibrium equations of the membrane are thus written and some mathematical background is provided in the Appendix.
3.1.1 Equations inside the capillary membrane: interface surface between two fluids
Let a, a=1,2, two fluid domains which are adjacent along the curved surface S. Let n be the unit normal of the interface pointing from 1 towards 2. The subscript S will either stand for the partial derivative tangential to the surface or the tangential component of a vector or a tensor. Div A stands for the usual divergence operator applied to an order two tensor like the one appearing in the equilibrium equations:
(DivA)i= X
j
∂Aij/∂xj (5)
Let σa be the stress tensor inside each fluid (a=1, 2) and σm the stress tensor of the interface which is assumed to be a tangential tensor which means:
σm(n) = 0 (6)
Then the superficial equilibrium equation of the interface reads, with n directed from fluid 2 to fluid 1:
DivSσm+ (σ1− σ2)(n) = 0 (7) According to equation (40) (in the Appendix), this equation splits into a normal and tangential components:
T r(σm.DSn) + ((σ1− σ2)(n), n) = 0 (8) (DivSσm)S+ ((σ1− σ2)(n))S = 0 (9) The classical assumption of an isotropic state of membrane stress pmgives:
pmdivSn + ((σ1− σ2)(n), n) = 0 (10) ∇Spm+ ((σ1− σ2)(n))S = 0 (11) These equations are exactly those proposed by Landau & Lifschitz [24].
When the surrounding fluids are at equilibrium or are inviscid, the superficial gra-dient of the tension pm vanishes so that the tension is constant over the membrane. Then pm, called the surface tension coefficient is given by:
pm=−((σ1− σ2)(n), n)/divSn (12) In the academic case the surface can be given parametrically by Z(x, y). n and DSn are functions of Z which is the sole unknown of the problem and which thus satisfies a partial differential equation (see subsection 3.2).
3.2 The simplified case of vertical fibers in two fluids at rest
The previous equations have been used in the case of a simplified geometry. In this part, the influence of several parameters on the capillary rise is determined. The generalized Laplace equation (see [25]) is to be solved in the case of a chosen geometry undergoing capillary forces with a fluid at rest under gravity forces:
ρgZ
pm = divSn(Z) (13)
with, n(Z) = −∇S0Z+iz
$−∇S0Z+iz$, the external normal vector of the capillary membrane,
S the capillary membrane surface and S0 the horizontal surface, that is to say the initial capillary membrane surface (see figure 4a and 4b).
(a) Vector definitions (b) Surface definitions
Fig. 4: Surface and vector definitions
The weak formulation of equation (13) can be written with w, a scalar test function: Z S0 ρg pmZwdS0= Z S0 wdivSndS0 (14)
As, in the special case here:
divSn = divS0n (15)
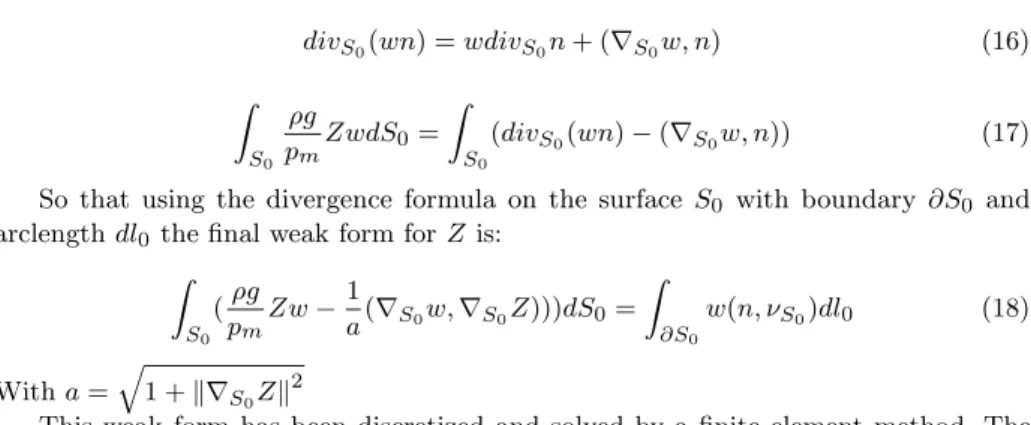
divS0(wn) = wdivS0n + (∇S0w, n) (16) Z S0 ρg pmZwdS0= Z S0 (divS0(wn)− (∇S0w, n)) (17)
So that using the divergence formula on the surface S0 with boundary ∂S0 and arclength dl0the final weak form for Z is:
Z S0 (ρg pmZw− 1 a(∇S0w,∇S0Z)))dS0= Z ∂S0 w(n, νS0)dl0 (18) With a = q 1 +$∇S0Z$ 2
This weak form has been discretized and solved by a finite element method. The contact angle θ is set at the contact with the fibers through the boundary condition at the interface with the fibers:
(n, νS0) =−cosθ (19)
The following example has been chosen. The chosen geometry represents five verti-cal fibers (figure 5) in a square domain. Boundary conditions are periodic on the faces of the square, that is to say:
Z(x1, y) = Z(x3, y) (20) Z(x, y2) = Z(x, y4) (21)
Fig. 5: Geometry for the Laplace formula to be solved
Let us discuss the numerical results obtained by solving this equation. The inter-fibrillar space is an important parameter. The height of rise in vertical fibers with 80 nm-interfibrillar distance is roughly 10 cm (see table 2). In the practical case of a collagen network, this space is roughly 50 nm so capillarity will not be negligible in the height of rise. Furthermore, the meniscus is affected by this interfibrillar dis-tance, but its height is negligible in comparison with the global rise (table 2). It is also observed that when the contact angle is changed the fluid motion direction can be
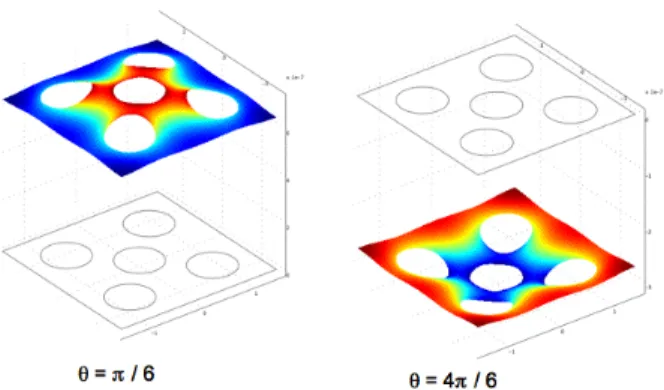
Fig. 6: Interfibrillar space influence (θ = π/6). The color scale indicates the value of Z − Zmin (Zmin is defined figure 4a) varying from 0 in blue to 3.5 10−7m in red (distance d1) or from 0 to 1.3 10−7m (distance d2)
Fig. 7: Contact angle influence. The color scale indicates the value of Z− Zminvarying from 0 in blue to 1.3 10−7m in red (θ = π/6) or from 0 in red to -1.3 10−7m in blue (θ = 4π/6)
inverted(figure 7). The results obtained by varying the contact angle or the interfibril-lar space are shown in figure 7 and detailed in table 2. The values found are perfectly symmetric for a contact angle of 2π/6 or 4π/6.
The observations made in this case provide some basic knowledge worth adding to in a more complex study. However, parameters like fiber orientation and infiltration time have to be checked with respect to our initial problem. To reach this goal, a full Navier-Stokes model with contact line boundary conditions was coupled with the level set method and solved in a finite element code.
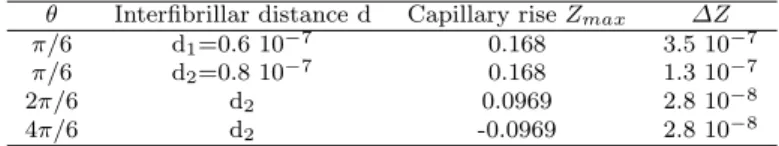
Table 2: Parametric study of capillary rise Zmaxand meniscus height ∆Z
θ Interfibrillar distance d Capillary rise Zmax ∆Z
π/6 d1=0.6 10−7 0.168 3.5 10−7
π/6 d2=0.8 10−7 0.168 1.3 10−7
2π/6 d2 0.0969 2.8 10−8
4π/6 d2 -0.0969 2.8 10−8
3.3 The coupled model used to follow the flow in the collagen fiber network
3.3.1 The level set method to track the front
The level set method was introduced by Osher and Sethian [26] to track the evolution of interfaces. It has already been used in a wide range of applications, especially incom-pressible and comincom-pressible two-phase flows. The method consists in tracking an isolevel of a signed distance function φ(x, y, z). The movement of the interface is governed by the following equation:
∂φ
∂t + (u.∇)φ = 0 (22)
Here, φ(x, y, z) = 0.5 localizes the tracked front. This method allows us to avoid a specific meshing at the moving interface. This equation is coupled through u and φ to the Navier-Stokes equation in which capillary forces have to be accounted. This issue is discussed in the next subsection. The variable φ is also considered to compute the unit normal n(φ) to the capillary surface:n(φ) =#∇φ#∇φ )
3.3.2 The Navier-Stokes equations in the whole domain translated into weak terms in the virtual power principle
The membrane equilibrium
To take into account capillarity, a method inspired by the continuum method proposed by Brackbill et al. is used. In this method the crucial hypothesis is to take the following form for σm(as was also done to find the Laplace formula in 3.1.1):
σm= pmIS (23)
Where pmis constant. The virtual power principle is written for each fluid (a=1, 2): Z Ωa (ρa(aa− g), u)dV = Z Ωa (Divσa, u)dV (24)
Using equation (42) and the divergence formula: Z Ωa (ρa(aa− g), u)dV + Z Ωa T r(σaDu)dV = Z S (σa(na), u)dS (25)
where na is the normal vector pointing to the exterior of the fluid 2 (n1=−n(φ) and n2= n(φ)).
Then the virtual power principle is written for the capillary membrane: Z S (DivSσm, u)dS + Z S ((σ1− σ2)n(φ), u)dS = 0 (26)
Thus if we add the three expressions of the virtual power principle (for the mem-brane and for each fluid):
Z Ω (ρ(a− g), u)dV + Z Ω T r(σDu)dV = Z S (DivSσm, u)dS (27)
It can be shown using ideas similar to those in section 3.1.1 and equation (23) that:
(DivSσm, u) = (DivSσm, unn(φ)) + (DivSσm, uS) (28)
(DivSσm, unn(φ)) =−unpmdivSn(φ) (29) and
(DivSσm, uS) = 0 (30)
By integration of (DivSσm, u) over the whole capillary membrane, we have: Z S (DivSσm, u)dS =− Z S unpmdivSn(φ)dS (31)
Using the fact that divSn(φ) = divn(φ) andRSundivn(φ) = R
S−(Du(n(φ)), n(φ))dS+ R
∂S(u, ν)dl (taking into account fluid incompressibility), the virtual power principle over the membrane and the two fluids gives:
Z Ω (ρ(a− g), u)dV + Z Ω T r(σDu)dV + Z S pm(−(Du(n(φ)), n(φ)))dS = Z ∂S pm(ν, u)dl (32) The third term can be approximated as follows:
Z S pm(−(Du(n(φ)), n(φ)))dS = km Z R3 pm(−(Du(n(φ)), n(φ)))δm(φ)dV (33)
Where kmis a normalized parameter and δm(φ) the delta function defining the mem-brane so surface tension is only applied on that particular layer. The fourth term can be approximated as follows (δw is the delta function defining the solid wall):
Z ∂S
pm(ν, u)dl = kl Z
R3pm(−n(φ)cosθ + nw, u)δwδm(φ)dV (34)
Where klis a model parameter: in the present paper applications, kl= 5 is chosen to enhance capillary effects.
Thus, the boundary condition is only applied at the intersection of the membrane and the solid wall because of the definition of δwand δm(φ)
Application to one fiber
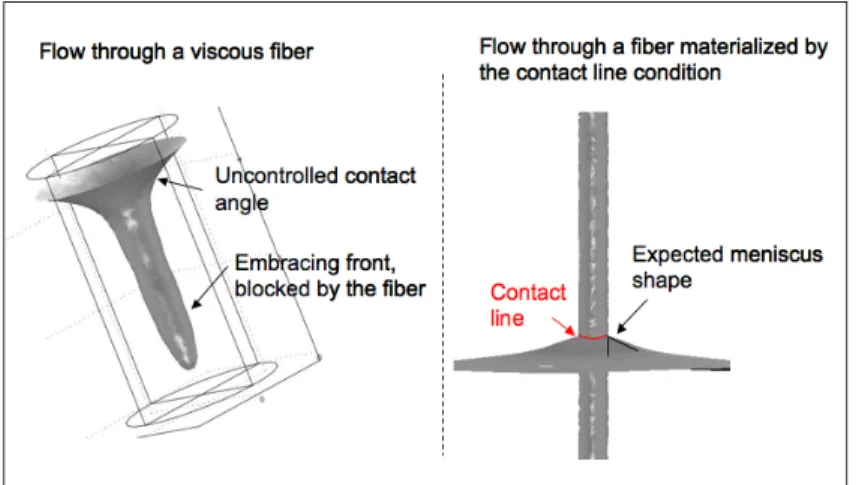
To test the model, it is applied to the case of one fiber only using a high viscosity (as it was done to assess permeability) and by adding the boundary condition force on the triple line. The results are presented figure 8. The high viscosity of the fiber tends to stop the front and the isovalue of the level set function wrappes the fiber boundaries like a latex glove. However, if the fibers are only taken into account by their effect on the contact line, the expected meniscus shape is found. That is why the fibers are considered that way in what follows.
To sum up, the idea used in Darcy’s permeability of using a heterogeneous viscosity is adapted. This time, instead of using cyl(x, y, z) for the viscosity function it is used to define the boundary of the cylinders (δw). This can be explained by the fact that to allow the front to move at the interface with a wall (here, a fiber), a small zone surrounding the fibers has to be defined with a low viscosity. So here we took the whole fiber with low viscosity.
We have also pointed out here one of the limitation of the level set method: the surface attached to the level set should not be too shaky with large curvature oscillation.
Fig. 8: Fiber viscosity effect on the advancing front. The gray area represents the moving capillary membrane, and it also indicates the vertical fiber on the second part of the figure
4 Analysis of fiber configuration and fluid properties
In this last section, we study the role of diverse parameters of the network with respect to meniscus slope and infiltration profile.
4.1 Interfibrillar space influence
A vertical fiber network is a simple and convenient type of network to appreciate the effect of fiber distance. Two networks are built with different distances between
five fibers surrounded by a wall. Figure 9 presents the front shape depending on the distance between fibers. There seems to exist a threshold distance above which no interaction between fibers occurs. When the interfibrillar space d is 0.8 µm (Figure 9A), the meniscus of the central fiber interacts with its neighbors. Its meniscus is higher than its neighbors, whereas when this distance is increased the interaction decreases (d=1.6 µm, Figure 9B). The solid wall meniscus interacts with fibers when d=1.6 µm so the results are really meaningful in a zone close to the center only. To overcome this numerical artifact, periodic boundary conditions were used hereafter.
Fig. 9: influence of the distance between fibers. A: d=0.8 µm. B: d=1.6 µm
4.2 Orientation influence
In this section, the influence of fibers orientation on permeability and on the infiltration front is studied using the three types of network: RAND, PAR, VERT.
4.2.1 On the network permeability
Using the method described in 2.2.2, we computed the mean permeability of collagen fiber networks (porosity 55%) with different fiber orientations and we obtained:
KRAN D= 10−18m2 (35) KP AR= 10−18m2 (36) KV ERT = 10−18m2 (37) The Darcy’s permeability of the different networks is of the same order of magni-tude. Nevertheless when the porosity of the PAR network is lowered to 27%
4.2.2 On the infiltration front through the network
To investigate the influence of fiber orientation, three types of network with periodic boundary conditions were built:
- a network with five vertical fibers randomly set in the control volume (VERT) - a network with five fibers in planes perpendicular to the front direction (PAR)
- a network with five fibers randomly set in the control volume (no constraint on their position and direction) (RAND)
We chose to use a limited number of fibers to clarify the effect of fiber orientation on the front.
Fig. 10: Advancing front through the three different networks
The results are illustrated by figure 10. The vertical fiber (VERT) network infil-tration is deeply influenced by the distance between fibers. The capillary rise is higher when the fibers are closer (red arrow), so the conclusion of the previous section is confirmed, with periodic boundary conditions that avoid meniscus interaction with exterior walls (figure 10 A, black arrow).
In the PAR network the front seems less driven by capillarity. This is because the capillary membrane and the fiber walls do not always intersect. We may remark here that the PAR network is the closest to the collapsed state of collagen fibers, so the collapse of the fibrous network is less propitious than RAND (the closest to the real network) or VERT networks. The dashed arrow shows that fibers nevertheless attract the membrane, but only when the front is approaching. The black arrow points out an area that stems from the periodic boundary condition.
In the RAND network, the main observation is that the orientation variation of two close fibers may drastically increase the front rise (figure 10 C, red arrow). It can be figured out that a large gradient of orientation may lead to a local acceleration of the infiltration process and consequently to a heterogeneous penetration.
Interfibrillar space is a crucial parameter. As in a capillary tube (where the larger the diameter of the tube, the higher the capillary rise for physical reasons) when the fibers are closer the front rise is higher. But in our case, this space cannot be lowered that much because then the molecules of the resin are too large to creep through it.
The capillarity effects influence the flow through a vertical fiber network more than through a network with fibers perpendicular to the front direction, because the boundary condition term that gives the expected meniscus shape is active only when the front is passing through fibers. This term is always active in VERT networks. So,
it is believed that changing the network into a VERT network can enhance infiltration. Using this idea, Pasquantonio et al. (2007) applied an electric field to demineralized dentin and showed that it improved bonding. One of the possible reasons could be that the field is reorienting the network into a VERT network.
4.3 Contact angle influence
In this section, the contact angle influence is investigated. First, the right meniscus shape is obtained when the contact angle is larger than or equal to π/2 (figure 11). The front is moving down: there is a capillary fall. We can thus model the mercury entrance in a penetrometer of a porosimetry test, for example, and see if the simulation is in agreement with porosimetry experiments. In the PAR network, when the contact angle is lowered (so the force at the contact line is closer to the vertical), the front moves faster (figure 12). This means that in restorative dentistry, it should be more efficient to use an adhesive with a low contact angle with collagen fibers.
Fig. 11: Advancing front through the PAR network with different contact angles at t=1.5e-8s
Fig. 12: Advancing front through the VERT network with different contact angles at t=1.5e-8s
5 Conclusion
We have modeled the dentinal collagen network, revealed by demineralization and crucial for bonding quality in dental restoration. Its permeability was assessed and is within the range 10−20-10−18m2. Three simplified fiber networks were infiltrated by a fluid using the level set method and the Navier-Stokes equations with capillary terms to validate the method. The fronts were computed for different fiber orientations and the evolving front was discussed qualitatively. The front was successfully computed through the three types of network. It was observed that the front is significantly influenced by fiber orientation, interfibrillar space and contact angle. We may wonder whether those parameters can be changed to improve dentinal infiltration. This work will be applied to demineralized dentin collagen network infiltration in restorative dentistry to assess the heterogeneity of resin penetration essential to the adhesion of the seal. Macroproperties like equivalent capillary pressure and relative permeability can be estimated from the simulation described here. Furthermore, we may simulate porosimetry tests to validate the whole model of demineralized dentin, which has an heterogeneous porosity.
References
1. Nakabayashi, N. Kojima, K. Masuhara, E. : The promotion of adhesion by infiltration of monomers into tooth substrates, J. Biomed. Mater. Res., 16, 265–273 (1982)
2. Van Meerbeek, B. Perdigao, J. Lambrechts, P. Vanherle, G. : The clinical performance of adhesives, J. Dent., 26, 1–20 (1998)
3. Nakabayashi, N. Pashley, D.H. : Hybridization of dental hard tissues. Quintessence Pub-lishing Co. Ltd., Tokyo (1998)
4. Breschi, L. Mazzoni, A. Ruggeri, A. Cadenaro, M. Di Lenarda, R. De Stefano Dorigo, E. : Dental adhesion review: Aging and stability of the bonded interface, Dent. Mat., 24(1), 90–101 (2008)
5. Spencer, P. Wang, Y. : Adhesive phase separation at the dentin interface under wet bonding conditions, J. Biomed. Mat. Res., 62,447–456 (2002)
6. De Munck, J. Van Landuyt, K. Peumans, M. Poitevin, A. Lambrechts, P. Braem, M. Van Meerbeek, B. : A Critical Review of the Durability of Adhesion to Tooth Tissue: Methods and Results, J. Dent. Res., 84, 118-132 (2005)
7. Yang, B. Adelung, R. Ludwig, K. Bmann, K. Pashley, D.H. Kern, M. : Effect of structural change of collagen fibrils on the durability of dentin bonding, Biomaterials, 26:5021–5031 (2005)
8. Prodanovic, M. Bryant, S.L. : A level set method for determining critical curvatures for drainage and imbibition, J. Colloid Interface Sci., 304(2), 442–458 (2006)
9. Clague, D. S. Phillips, R. J. : A numerical calculation of the hydraulic permeability of three-dimensional disordered fibrous media, Physics of Fluids, 9, 1562–1572 (1997) 10. Schulz, V. P. Becker, J. Wiegmann, A. Partha, P. M. Wang C.-Y. : Modeling of Two-Phase
Behavior in the Gas Diffusion Medium of PEFCs via Full Morphology Approach, Journal of The Electrochemical Society, 154, 419–426 (1997)
11. Vogel, H.-J. Tolke, J. Schulz, V. P. Krafczyk, M. Roth, K. : Comparison of a Lattice-Boltzmann Model, a Full-Morphology Model, and a Pore Network Model for Determining Capillary Pressure-Saturation Relationships, Vadose Zone J., 4, 380–388 (2005)
12. VanMeerbeek, B. Dhem, A. Goret-Nicaise, M. Braem, M. Lambrechts, P. VanHerle, G. : Comparative SEM and TEM examination of the ultrastructure of the resin-dentin interdif-fusion zone, J. Dent. Res., 72(2),495–501 (1993)
13. Habelitz, S. Balooch, M. Marshall, S.J. Balooch, G. Marshall, G.W. Jr. : In situ atomic force microscopy of partially demineralized dentin collagen fibrils, J. Struct. Biol., 138, 227– 236 (2002)
14. Vennat, E. Bogicevic, C. Fleureau, J.M. Degrange M. : Demineralized dentin 3D porosity and pore size distribution using mercury porosimetry, Dent. Mat., accepted paper
15. Lin,CP Douglas, WH Erlandsen, SL. : Scanning Electron Microscopy of Type I Colla-gen at the Dentin-Enamel Junction of Human Teeth, The Journal of Histochemistry and Cytochemistry, 41(3), 381–388 (1993)
16. Kinney, J.H. Pople, J.A. Marshall, G.W. Marshall, S.J. : Collagen orientation crystallite size in human dentin: A Small Angle X-ray Scattering study, Calcif Tissue Int, 69, 31–37 (2001)
17. Elbaum, R Tal, E Perets, A.I. Oron, D. Ziskind, D. Silberberg, Y. Wagner, H.D. : Dentin micro-architecture using harmonic generation microscopy, J Dent, 35, 150–155 (2007) 18. Kanit, T. Forest, S. Galliet, I. Mounoury, V. Jeulin, D. : Determination of the size of the
representative volume element for random composites: statistical and numerical approach, Int. J. Solids Struct., 40, 3647–3679 (2003)
19. Gitman, I.M. Askes, H. Sluys, L.J. : Representative volume: Existence and size determi-nation, Engineering Fracture Mechanics, 2518-2534 (2007)
20. Swartz, M.A. Fleury, M.E. : Interstitial flow and its effects in soft tissues, Annu. Rev. Biomed. Eng., 9, 229–256 (2007).
21. Happel, J. : Viscous flow relative to arrays of cylinders, AIChE J, 5, 174–177, (1959) 22. Anand, S. Wu, J.H. Diamond, S.L. : Enzyme-mediated proteolysis of fibrous biopolymers:
dissolution front movement in fibrin or collagen under conditions of diffusive or convective transport, Biotech. Bioeng, 48, 89–107 (1995)
23. Kaviany, M. : Principles of Heat Transfer in Porous Media, Springer, Berlin (1995) 24. Landau, Lifschitz : Fluid mechanics, Pergamon (1987)
25. Finn, R. : Capillary surface interfaces, Not. Am. Math. Soc., 46, 770–781 (1999) 26. Sethian, JA. : Level set methods : Evolving interfaces in geometry, fluid mechanics,
com-puter vision, and material science. Cambridge University Press, Cambridge (1996)
27. Brackbill, J. U. Kothe, D. B. Zemach, C. : A continuum method for modeling surface tension, J. Comput. Phys., 100, 335-354 (1992)
28. Pasquantonio, G Tay, FR Mazzoni, A Suppa, P Ruggeri, A Falconi, M Di Lenarda, R Breschi, L. : Electric device improves bonds of simplified etch-and-rinse adhesives, Dent. Mat., 23(4), 513–518 (2007)
6 Appendix
6.1 Mathematical definitions
A vector a is decomposed according to (see figure 13):
a = aS+ ann (38)
ann
aS
n
S
with a similar decomposition for an order two tensor A:
A = AS+ A(n)S⊗ n + n ⊗ A(n)S+ Annn⊗ n (39) The DivSAS vector, which involves a derivative only along the surface S, can also be decomposed according to:
DivSAS = (DivSAS)S+ (DivSAS, n)n (40)
but if we develop the following identity, which involves the surface curvature tensor DSn assuming that AS is symmetric:
0 = divSAS(n) = (DivSAS, n) + T r(AS.DSn) (41)
we can write: