Validation of the Kiswahili version of the SF-36
Health Survey in a representative sample of an
urban population in Tanzania
K. Wyss*, A. K. Wagner, D. Whiting, D. M. Mtasiwa, M. Tanner, B. Gandek and P. M. Kilima
Department of Public Health and Epidemiology, Swiss Tropical Institute, Basel, Switzerland (K. Wyss, M. Tanner); The Health Institute, New England Medical Center, Boston, MA, USA (A. K. Wagner, B. Gandek); Department of Medicine, Medical School, University of Newcastle upon Tyne, Newcastle upon Tyne, UK (D. Whiting); Ministry of Health, Dar es Salaam, Tanzania (D. M. Mtasiwa, P. M. Kilima)
The objective of this study was to assess the validity of a Kiswahili translation of the SF-36 Health Survey (SF-36) among an urban population in Tanzania, using the method of known-groups validation. People were randomly selected from a demographic surveil-lance system in Dar es Salaam. The representative sample consisted of 3,802 adults (15 years and older). Health status differences were hypothesized among groups, who differed in sex, age, socio-economic status and self-reported morbidity. Mean SF-36 scale scores were calculated and compared using t-test and ANOVA. Women had significantly lower mean SF-36 scale scores (indicating worse health status) than men on all scales and scores were lower for older people than younger on all domains, as hypothesized. On five of the eight SF-36 scales, means were higher for people of higher economic status compared to those of lower socio-economic status. People who reported an illness within the previous 2 weeks scored significantly lower on all scales compared to those who were healthy, as did people who said they had a disability or a chronic condition.
Qual. Life Res. 8:111–120 © 1999 Kluwer Academic Publishers
Key words: Tanzania; health status assessment;
health-related quality of life; SF-36 Health Survey; known-groups validity; cross-cultural studies.
Introduction
In recent years, interest has grown in identifying new measures to assess health across different populations and countries.1,2
Traditionally, indicators such as the infant mortality rate or life expectancy at birth have been used as indicators of health in industrialized and low-income countries. Although informative, these measures are limited, as they only evaluate fatal health outcomes and, thus, provide no information about morbidity and disability. Furthermore, they do not comprehensively assess health as it is defined by the World Health Organization, namely a ‘state of complete physical, mental, and social well-being and not merely the absence of disease or infirmity’3
. Two main approaches to measuring non-fatal health outcomes exist. One approach focuses on estimating quality-adjusted life years (QALYs) by defining a set of health states spanning from death to perfect health and attaching weights for time spent in each of them. Disability-adjusted life years (DALYs) have been developed as a type of QALY and have widely been proposed as a tool for priority setting of
*To whom correspondence should be addressed at Support Centre for International Health, Swiss Tropical Institute, Socinstr. 57, 4002 Basel, Switzerland. Tel: ++41/ 61/284 81 40; Fax: ++41/61/271 79 51; email: wyssk@ ubaclu.unibas.ch
The Swiss Agency for Development and Co-operation (SDC) gave financial support for the study through the Urban Health Project and the British Department for International Development (DFID) through the Adult Morbidity and Mortality Project. The Swiss Tropical Institute provided financial assistance for a Master of Public Health Programme to Dr Kaspar Wyss, during which this article was written. Dr Wagner and Ms Gandek were supported by the International Quality of Life Assessment (IQOLA) Project, which is sponsored by Glaxo Wellcome Inc. and Schering-Plough Corporation, with additional support from other pharmaceutical companies.
health interventions in developing countries.4
Another approach is the measurement of self-reported health status or health-related quality of life through standardized questionnaires. Increasingly, consensus has been reached about the core domains of general health status questionnaires.5
Data on the reliability and validity of numerous general health status questionnaires for use in the countries in which they were developed, generally the US and the UK, are available. Efforts have also been ongoing to translate general health status questionnaires for use in other countries.5–7
One widely used general health status question-naire is the SF-36 Health Survey (SF-36).5,8,9The SF-36
was developed from a more extensive set of questions used in the Medical Outcomes Study (MOS), to ‘assess health concepts that represent basic human values that are relevant to everyone’s functional status and well-being’.8
The SF-36 consists of 36 questions, assessing eight domains of general health status: physical functioning, role limitations due to physical health problems, bodily pain, general health, vitality, social functioning, role limitations due to emotional health problems and mental health; in addition, self-reported health transition is assessed. Within the International Quality of Life Assessment (IQOLA) Project, the SF-36 is being translated into more than 40 languages, spoken by more than half of the world’s population.
Health status measures for use across languages and cultures must fulfil two requirements. The questionnaires and their scoring must be standardized such that the same health attributes are measured in each setting. At the same time, however, question-naires must be meaningful within each country’s culture. To create culturally appropriate translations that are conceptually equivalent to the source version, psychometrically sound, valid and interpretable IQOLA researchers employ an iterative forward and backward translation process, psychometric evalu-ation of the assumptions underlying the scoring of the SF-36 scales, tests of validity and normative studies of the translated questionnaires. Results to date indicate that it is possible to create a carefully translated and adapted health status questionnaire that can be used across Western European, North American and Asian countries.5,7,9–11
To date, however, no data have been published of translations of the SF-36 for use in Africa.
Using IQOLA methods, the SF-36 has been trans-lated into Kiswahili, the national language of Tanzania, spoken throughout East Africa and Burundi and the East of Congo. Wagner et al.12
reported the results of the translation and psychometric evaluation of the Kiswahili SF-36. Data indicate that the Kiswahili
SF-36 fulfils the psychometric requirements under-lying the scoring of the eight SF-36 scales and that scale scores are reliable. Good psychometric character-istics and reliability, however, are necessary but insuf-ficient criteria for the use of a translated questionnaire. A translation needs to be valid, that is it needs to measure what it is supposed to measure, in the country in which it is to be used. Validity can be assessed in a number of complementary ways.13 A
common approach is that of comparing scale scores of groups that differ in demographic, socioeconomic or clinical characteristics and who, based on these, would be hypothesized to differ in their perceived health status as measured by the SF-36 (known-groups validity).
The objective of this paper is to begin to validate a Kiswahili translation of the SF-36 for an East African general, urban population using demographic and socioeconomic characteristics as well as information on self-reported morbidity.
Methods
Data collection and questionnaire administration
This validity study was conducted as part of a larger cross-sectional household survey of a sample of the general population of Dar es Salaam, Tanzania, which also evaluated the utilization of different types of health care.14
Dar es Salaam is, with approximately 2 million inhabitants, the biggest city of Tanzania and borders the Indian Ocean. For purposes of the household survey, a cross-sectional cluster sample was selected. The sample was based on a population census 3 months prior to the survey in a demographic surveillance area, covering eight branches of the city. Further details of the ongoing surveillance system have been described by Kitange et al.15
A two-stage cluster sampling design was used. In the first stage, a random sample of a fixed number of households in the branches of Dar es Salaam was selected with a probability proportional to the population size of the branches. In the second stage, registered members of each household chosen in the first stage were selected. A total of 7,844 individuals were selected from the census database to be included in the study, among them 5,162 adults age 15 years or older.
Twenty-eight field workers of both sexes undertook data collection. They were selected from students with a non-medical background and were trained for 4 days. Initially, two attempts were made to interview each adult. If it was not possible to interview an adult
on the third visit, another adult member of the household acted as proxy for that individual. For 9% of adults, a proxy answered for the selected person and those interviews were not included in the analysis. One medical assistant accompanied the field team to examine any person who requested medical advice. No treatment was given and no money or transport were provided to assist those who wished to go to the hospital. The interviewers were supervised in their daily work by two female field research coordinators. They were responsible for the coordination of the work and control of the data collection procedure, ensuring that interviewers completed the questionnaires honestly and thoroughly. Other controls were also introduced to minimize possible errors: households were revisited to ensure that all the individuals were interviewed, approximately 5% of the interviews were conducted in the presence of the supervisor and the completed questionnaires were verified by the field research coordinators. If necessary, the interviewers were asked to return to the household to collect any missing data.
Questionnaire and measures
The SF-36 measures eight health concepts with multi-item scales.8They are (1) physical functioning (PF), (2)
role limitations due to physical health problems (RP), (3) bodily pain (BP), (4) general health (GH), (5) vitality (VT), (6) social functioning (SF), (7) role limita-tions due to emotional health problems (RE) and (8) mental health (MH). Scales are constructed by recoding items that need to be recoded, summing the response choice values of their respective items and transforming scores to a 0–100 scale (where 100 indicates best health on each scale), according to standard scoring algorithms.16 In more than seven
countries studied to date, SF-36 scale scores follow a two-dimensional structure that has been characterized as representing physical and mental health constructs.5,16,17
Based on results from factor analyses in other countries, scales are ordered in this paper from the scale shown to be the best measure of PF to the one shown to be the best measure of MH.
Preliminary to the known-groups validation, the translation and the psychometric properties of the Kiswahili version of the SF-36 were assessed.12Results
of the back translations showed that the Kiswahili version is conceptually equivalent to the US English SF-36 and that data quality was excellent. Median item–scale correlations varied from 0.46 to 0.85 for the whole sample, median scaling success rates were 100% and median internal consistency reliability of
the eight scales was 0.84 (range 0.70–0.92). Furthermore, Wagner et al.12
pointed out that floor effects were low, but that on five of eight scales ceiling effects were high.
The Kiswahili SF-36 was administered to respon-dents as the first part of a larger questionnaire that also contained questions about demographic charac-teristics of the interviewee: morbidity, utilization of health care during the previous 2 weeks and charac-teristics of the household. Morbidity was assessed through closed-ended questions about (1) a recent acute illness, (2) disabilities and (3) chronic conditions. Individuals who endorsed being sick in the previous 2 weeks were classified as sick. Disabilities were assessed by asking respondents whether or not they suffered restrictions in or lacked the ability to perform functions in a ‘normal’ manner (ability to see, hear, use arms/hands, use legs, speak and back problems). People who reported having at least some difficulty with one or more of the functions assessed were classified as being disabled. Chronic conditions were assessed by nine yes/no questions (diabetes, hyper-tension, epilepsy, cancer, stroke, asthma, tuberculosis, sickle cell disease and other heart disease). Adults who answered yes to at least one of the questions were classified as having a chronic condition. If a person reported no sickness in the previous 2 weeks, no disability and no chronic condition, he or she was classified as ‘healthy’. Women 45 years old and younger who endorsed infertility problems were classified as having infertility problems.
In order to test the reliability and validity of self-reported morbidity it was decided at the end of the study to attempt clinical diagnosis for some of the self-reported conditions detected by the questionnaire. For hypertension, diabetes, stroke and other heart disease, two nurses visited the households of each person who reported one of these conditions and performed appropriate tests (e.g. blood pressure and testing the urine by Uristicks). People who reported visual disability and skin or speech problems, were invited to attend special clinics at the Muhimbili Medical Center, the top referral hospital and only teaching hospital of Tanzania. Detailed results of this validation work are given in a report on policy implications of adult morbidity and mortality of the Ministry of Health of Tanzania.18 Overall, the results of the
validation exercise show that the validity of data collected using self-reported morbidity questionnaires is in reasonably good agreement with different morbidities. For example, 92.2% of those who visited the referral hospital and reported to have visual problems did have eye problems. Or, among those who were found to have skin or speech problems
93 and 90%, respectively, had skin or speech problems at the time of examination.
Zone of residence and socioeconomic class14
served as proxy measures to assess the socioeconomic status of the interviewees. For classification into zone of residence, the eight branches of the sentinel surveil-lance system were separated into four groups consid-ering the socioeconomic status of the whole area. Main infrastructural characteristics of the branches such as roads, quality of housing, status of urban planning, availability of a sewage system, etc., were used to rank them.
Socioeconomic classes were also constructed with the help of a point system: a score was assigned to each household. The composite revenue scoring was based on the occupation status of the resident (owner, tenant etc.), the number of rooms available and crowding (number of people per room), type of construction of the house (cement, mud bricks and wood), availability of basic infrastructure (water and electricity), means of transportation owned and possession of household goods (refrigerator, television, radio, sewing machine and sofa). Scores were assigned between 0 and 3 points to each charac-teristic and a total score of 0 to 36 was assigned to each household, allowing categorization of the households into one of four classes, class 1 representing the poorest households and class 4 the richest.18
Hypotheses and statistical analysis
Based on published SF-36 data9–11,16,19–20
and before analysing the data, hypotheses were formulated about differences in SF-36 scale scores between groups (Table 1). For example, the hypothesis was stated that men have higher mean scale scores on all scales than women.
Respondents’ answers were entered using FoxPro version 2.5. Data were entered twice and logical checks helped ensure the accuracy of data entry. Data analysis and statistical testing was done using SAS for Windows, version 6.1. Mean scale scores of different demographic and socioeconomic groups as well as those of ‘healthy’ people and people with an acute illness, one or more disabilities and one or more chronic conditions were compared using two-sided t-tests and ANOVA. Among women who were 45 years old and younger, mean scale scores of those who reported infertility were compared to those who denied such problems, using two-sided t-tests.
In addition to calculating unadjusted mean scores for the groups, analyses were also conducted using multiple linear regression to control for sex, age and
self-reported morbidity status. There were only minor differences in results from the unadjusted and adjusted analyses and the conclusions of the analyses remained the same. Therefore, for simplicity of presentation, unadjusted results are presented here.
Results
Response rate and characteristics of the respondents
From the sentinel surveillance system, 5,126 persons 15 years or older were selected to be included in the survey. During the 30 days of field data collection, 3,802 adults could be interviewed directly, corre-sponding to a response rate of 74%. For different age categories and for men and women, this percentage varied between 70% (males between 25 and 34 years) and 85% (females between 35 and 45 years). The response rate was slightly higher for women (75 versus 72% for men). The interview could not be realized for approximately 17% of the selected persons, most frequently (10%) because individuals had moved away. Some (1%) of the selected individuals had died since the last census. Of those for whom another reason was advanced for ‘no interview’ (6%), most were people who had left Dar es Salaam temporarily for harvest. No effort was made to locate these individuals.
The mean age of respondents was 31.2 years (median 28.3 years) with the oldest respondent being 87.4 years old. Men were slightly older than women (mean 32.6 years for men versus 29.9 years for women and median 29.4 versus 26.4 years).
Validity in relation to demographic characteristics
Table 2 presents mean SF-36 scale scores for men and women and results of tests for significant differences in means between the two sexes. Men scored higher (indicating better health) than women on all scales. More than half of both, men and women, scored at the highest possible level on five scales (PF, RP, BP, SF and RE, data not shown). This indicates, for example, that they could perform all types of physical activities, including the most vigorous ones, without limitations due to health (PF) or that they had no problems with work or other daily activities as a result of physical health problems (RP) during the previous month.
Mean scale scores for people in different age categories are also shown in Table 2. Different from
Table 1. Hypothesized differences in SF-36 scale scores between groups of people who differ in sociodemographic and economic characteristics and self-reported morbidity
Hypothesized differencesa,b
Characteristics Primarily physical health Physical and mental Primarily mental health (PF, RP and BP) health (GH, VT and SF) (RE and MH) Sex Men have higher mean scale Men have higher mean scale Men have higher mean
scores than women scores than women scale scores than women Age Younger people have higher Younger people have slightly No strong difference
mean scale scores than older higher mean scale scores
people than older people
Marital status No hypothesis No hypothesis No hypothesis Level of education People with higher education People with higher education People with higher
have higher mean scale have higher mean scale education have higher scores than those with less scores than those with less mean scale scores than
education education those with less education
Socioeconomic class People of higher socio- People of higher socio- People of higher socio-economic status have higher economic status have higher economic status have mean scale scores than those mean scale scores than those higher mean scale scores of lower status of lower status than those of lower status Zone of residence People living in more affluent People living in more affluent People living in more
zones have higher mean scale zones have higher mean affluent zones have higher scores than those living in scale scores than those mean scale scores than poorer zones living in poorer zones those living in poorer zones Illness within the People who reported illness People who reported illness No strong difference previous 2 weeks have lower mean scale have lower mean scale
scores than healthy people scores than healthy people
Disabilities People who reported disability People who reported disability People who reported have lower mean scale scores have lower mean scale scores disability have lower mean than healthy people; than healthy people scale scores than healthy differences greater for physical people; differences greater heath scales than for mental for physical health scales
health scales than for mental health
scales
Chronic conditions People who reported a People who reported a People who reported a chronic condition have lower chronic condition have lower chronic condition have mean scale scores than mean scale scores than lower mean scale scores healthy people; differences healthy people than healthy people; greater for physical health differences greater for scales than for mental health physical health scales than
scales for mental health scales
Infertility (women only) No strong difference Woman who reported infertility Woman who reported have lower mean scale scores infertility have lower mean than healthy women for SF scale scores than healthy
women
a
Separation of SF-36 scale scores based Ware et al.,16,17
.
b
Hypothesis based on Ware et al.,9,16,17
Jenkinson et al.,10
Sullivan et al.,11
United Republic of Tanzania,18
Behavioural Epidemiology Unit19and H. Hemingway et al.,21.
previous hypotheses, older people scored significantly lower on all scales than younger people, not only on those scales that mostly assess physical health. However, the greatest differences were found on the PF scale.
Mean SF-36 scale scores also differed according to marital status, with ‘never married’ individuals having highest scores and widowed individuals having lowest scores. As the multiple linear regression analysis revealed small differences, results of these analyses, such as presented here, are not adjusted for sex and age. While women who reported being married monogamously had higher scores on all scales than those who reported living in a polygamous household, differences were significant only for the RP and BP scales (RP t = 2.3 and p < 0.05 and BP t = 2.3 and p < 0.05).
Validity in relation to level of education and socioeconomic characteristics
Mean SF-36 scale scores varied significantly with level of education (Table 3). On all scales, people without
formal education scored lower than those with higher education (secondary, university or post-secondary training). Mean scale scores of those who had primary education were in between these two groups. For example, people with higher education reported fewer problems with work or other daily activities as a result of emotional problems during the previous month than people without formal education.
Mean scale scores of people also differed according to their socioeconomic class (Table 3; 199 adults had to be excluded from the analysis as data used for the establishment of the composite revenue scoring were missing). People of the poorest class (class 1) scored lowest on all scales and those of the richest class (class 4) scored highest. Differences were significant for five scales. According to zone of residence, an alternative proxy for the socioeconomic status of a household, group means differed significantly on all but two (PF and VT) scales. However, tendencies were less clear and not always consistent. For example, people who lived in the zone 1, classified as the one with the poorest socioeconomic status, had slightly higher mean GH scale scores than those living in zone 2, while people living in zone 4, considered the one with Table 2. Mean SF-36 scale scores for groups who differ according to demographic characteristics
Mean scale score (standard error)
n PF RP BP GH VT SF RE MH Entire population 3,802 93.8 (0.2) 84.2 (0.5) 82.8 (0.4) 62.9 (0.3) 74.9 (0.3) 88.2 (0.3) 86.3 (0.5) 82.2 (0.3) Sex Female 1,903 91.8 (0.3) 80.9 (0.8) 80.0 (0.6) 61.6 (0.4) 73.2 (0.5) 86.8 (0.5) 84.4 (0.8) 80.7 (0.4) Male 1,899 95.8 (0.3) 87.4 (0.7) 85.5 (0.5) 64.1 (0.4) 76.5 (0.4) 89.6 (0.4) 88.2 (0.7) 83.6 (0.4) t 8.0* 6.2* 6.6* 4.3* 5.2* 4.3* 3.8* 4.8* Age category 15–24 years 1,492 96.6 (0.3) 86.8 (0.7) 85.7 (0.6) 65.1 (0.4) 76.9 (0.5) 90.5 (0.4) 88.9 (0.7) 83.8 (0.4) 25–34 years 1,122 95.5 (0.4) 84.8 (0.9) 83.6 (0.8) 64.0 (0.5) 76.1 (0.6) 88.5 (0.6) 86.6 (0.9) 82.7 (0.5) 35–44 years 612 93.6 (0.6) 84.3 (1.3) 82.3 (1.1) 61.9 (0.7) 74.3 (0.8) 87.7 (0.8) 85.0 (1.3) 81.3 (0.7) 45–54 years 320 89.8 (1.1) 81.8 (2.0) 77.6 (1.5) 58.3 (1.0) 72.7 (1.1) 87.5 (1.1) 85.2 (1.8) 80.1 (1.1) 55–64 years 172 81.0 (1.9) 75.0 (3.0) 74.2 (2.5) 54.8 (1.6) 66.7 (1.9) 79.1 (2.1) 79.7 (2.9) 76.5 (1.6) 65 years and more 84 64.8 (3.2) 53.9 (5.0) 60.3 (3.8) 49.7 (2.3) 52.7 (3.0) 67.3 (3.7) 65.1 (4.9) 71.4 (2.7)
F 117.9* 20.8* 23.8* 26.6* 33.5* 31.3* 11.9* 13.1* Marital statusa Single 1,591 96.6 (0.3) 87.6 (0.7) 86.0 (0.6) 64.9 (0.6) 76.5 (0.4) 89.4 (0.5) 89.4 (0.7) 83.6 (0.4) Married monogamous 1,781 93.2 (0.4) 83.5 (0.8) 82.0 (0.6) 62.3 (0.4) 74.9 (0.5) 87.7 (0.5) 85.3 (0.8) 82.1 (0.4) Married polygamous 111 91.3 (1.6) 76.1 (3.5) 76.0 (2.5) 60.4 (1.8) 71.9 (1.8) 86.2 (1.9) 81.7 (3.2) 78.7 (1.7) Separated, divorced 224 88.5 (1.4) 76.0 (2.5) 73.5 (2.0) 56.8 (1.3) 70.0 (1.4) 81.2 (1.7) 78.6 (2.6) 77.3 (1.4) Widow, widower 93 73.5 (3.1) 67.7 (4.4) 72.8 (3.3) 56.1 (2.1) 62.2 (2.6) 79.4 (3.0) 76.3 (4.1) 74.2 (2.3) F 66.8* 16.5* 19.6* 16.0* 16.7* 16.8* 11.1* 12.0* *p < 0.001, **p < 0.01, ***p < 0.05, ****p < 0.1.
the highest socioeconomic status, had lower mean RE scale scores than those living in zone 3.
Validity in relation to self-reported morbidity and infertility (women only)
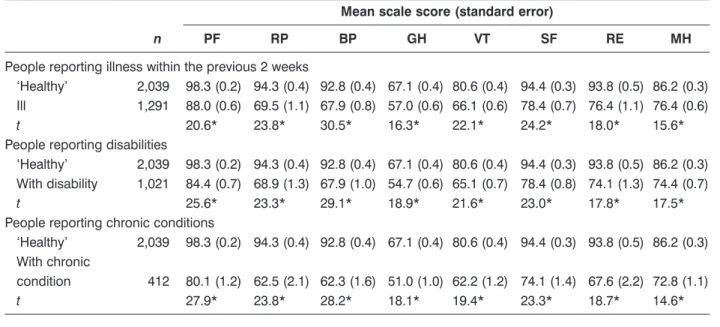
Of the 3,802 adults included in the analysis, 1,291 (34%) reported an illness within the previous 2 weeks. Illnesses ranged from a headache lasting 1 day to injuries subsequent to a road accident. Among the interviewed, 1,021 persons (27%) indicated that they had a disability and 412 (11%) indicated that they had a chronic condition. Groups of people with a recent illness, a diability or a chronic condition were not mutually exclusive. More than half of the respondents (n = 2,039, 54%) were classified as healthy, as they denied an acute illness, a disability and a chronic condition. Mean SF-36 scale scores of each of the three groups of people with morbidities were lower than those of ‘healthy’ people (Table 4). A priori, differences
in group means between the ‘healthy’ and those who reported an illness during the previous 14 days were hypothesized to manifest mainly on the mostly physical health scales (PF, RP and BP), as well as GH. Tests for equality of means confirmed these hypotheses and further indicated that group means on those scales that largely assess mental health (SF, RE and MH) and on the VT scale were significantly lower for people with a recent illness, a disability and/or a chronic condition compared to ‘healthy’ people. Therefore, as expected, the presence of a physical disability has a larger impact on physical measures than on mental measures and the F statistics for the physical measures are larger than for the mental ones. Before the analysis, it was hypothesized that the women’s place in society would be adversely affected by infertility, that the effects of infertility would be largely on the mental side and that they primarily can be seen on the SF and RE scales. Table 5 shows that women 45 years old and younger who reported infer-tility had significantly lower group means for all Table 3. Mean SF-36 scale scores for groups who differ according to socioeconomic characteristics
Mean scale score (standard error)
n PF RP BP GH VT SF RE MH Level of education No formal education 402 84.0 (1.2) 72.6 (2.1) 72.5 (1.6) 57.0 (1.0) 69.0 (1.2) 80.7 (1.4) 77.3 (2.0) 77.3 (1.1) Primary 1–4, adult education 356 92.1 (0.9) 83.6 (1.7) 81.3 (1.4) 60.3 (1.0) 73.0 (1.2) 87.1 (1.1) 86.4 (1.6) 80.5 (1.1) Primary 5–8 2,186 95.1 (0.3) 84.2 (0.7) 83.0 (0.5) 63.7 (0.4) 75.7 (0.4) 88.5 (0.4) 86.5 (0.7) 82.6 (0.4) Secondary, university, post-secondary 856 96.0 (0.4) 89.8 (0.9) 87.7 (0.7) 65.5 (0.6) 76.7 (0.6) 91.2 (0.5) 90.2 (0.9) 84.0 (0.6) F 70.9* 27.8* 32.6* 23.2* 20.1* 27.5* 15.9* 13.9* Socioeconomic classa Class 1 689 93.6 (0.6) 79.9 (1.3) 78.9 (1.1) 61.1 (0.7) 73.5 (0.8) 86.2 (0.8) 84.0 (1.3) 79.7 (0.8) Class 2 1,419 93.7 (0.4) 85.4 (0.8) 83.0 (0.7) 62.7 (0.5) 74.8 (0.5) 87.8 (0.5) 86.7 (0.8) 82.2 (0.5) Class 3 1,153 94.0 (0.4) 83.7 (1.0) 83.7 (0.8) 63.6 (0.5) 75.8 (0.6) 89.1 (0.6) 87.2 (0.9) 83.4 (0.5) Class 4 340 94.3 (0.7) 90.1 (1.4) 85.4 (1.2) 65.3 (0.9) 75.8 (1.0) 91.4 (1.0) 88.5 (1.6) 84.6 (0.9) F 0.3 8.7* 6.8* 4.9** 2.3**** 6.5* 2.2**** 7.9* Zone of residenceb Zone 1 1,652 93.7 (0.4) 84.1 (0.8) 82.5 (0.7) 62.2 (0.4) 74.7 (0.5) 87.7 (0.5) 87.0 (0.7) 81.6 (0.5) Zone 2 700 92.8 (0.6) 77.9 (1.4) 79.3 (1.0) 60.3 (0.7) 73.8 (0.8) 84.7 (0.8) 80.4 (1.4) 80.2 (0.7) Zone 3 914 94.5 (0.5) 87.5 (1.0) 85.3 (0.8) 64.9 (0.6) 75.4 (0.6) 90.6 (0.6) 89.4 (0.9) 83.9 (0.6) Zone 4 536 94.5 (0.6) 86.6 (1.3) 83.8 (1.1) 65.1 (0.7) 75.8 (0.8) 90.0 (0.7) 86.7 (1.3) 83.5 (0.8) F 2.1 13.3* 7.5* 12.3* 1.4 13.8* 12.0* 6.9*
aClasses are defined by a composite scoring (see methods); class 1 represents the poorest and class 4 the richest. b
Zones are defined by main infrastructural characteristics of the branches of the demographic surveillance system; zone 1 represents the one with the poorest status and zone 4 the one with the richest status.
scales. The strongest differences could, as expected, be found on the SF scale. This indicates that women with infertility reported significantly more interference with their normal social activities due to physical and emotional problems than women of the same age and morbidity status, but without infertility problems.
Discussion
IQOLA researchers have divided the process of readying the SF-36 for use in different countries into four steps: translation, evaluation of scale construction, validation and norming.5
The present and an accompanying paper12
report results from at least three of the four steps for the Kiswahili trans-lation of the SF-36, the first transtrans-lation into an African
language. These results are encouraging and challenging at the same time.
The interative translation process produced a conceptually equivalent Kiswahili translation. Multitrait analyses indicated that the assumptions underlying the scoring of the eight SF-36 scales were met well. In a large, representative sample of the adult population in Dar es Salaam, SF-36 scales differen-tiated among groups hypothesized to differ. As it was not feasible to gather clinical data about individuals, people were grouped and hypotheses formulated based on self-reported morbidity information. Sicker people, assessed by acute illness and disability as well as chronic conditions, scored lower than ‘healthy’ people. This provides evidence of the known-groups validity of the Kiswahili translation of the SF-36, supporting the hypothesis that the SF-36 is able to Table 4. Mean SF-36 scale scores for groups who differ according to self-reported morbidity
Mean scale score (standard error)
n PF RP BP GH VT SF RE MH
People reporting illness within the previous 2 weeks
‘Healthy’ 2,039 98.3 (0.2) 94.3 (0.4) 92.8 (0.4) 67.1 (0.4) 80.6 (0.4) 94.4 (0.3) 93.8 (0.5) 86.2 (0.3) Ill 1,291 88.0 (0.6) 69.5 (1.1) 67.9 (0.8) 57.0 (0.6) 66.1 (0.6) 78.4 (0.7) 76.4 (1.1) 76.4 (0.6)
t 20.6* 23.8* 30.5* 16.3* 22.1* 24.2* 18.0* 15.6*
People reporting disabilities
‘Healthy’ 2,039 98.3 (0.2) 94.3 (0.4) 92.8 (0.4) 67.1 (0.4) 80.6 (0.4) 94.4 (0.3) 93.8 (0.5) 86.2 (0.3) With disability 1,021 84.4 (0.7) 68.9 (1.3) 67.9 (1.0) 54.7 (0.6) 65.1 (0.7) 78.4 (0.8) 74.1 (1.3) 74.4 (0.7)
t 25.6* 23.3* 29.1* 18.9* 21.6* 23.0* 17.8* 17.5*
People reporting chronic conditions
‘Healthy’ 2,039 98.3 (0.2) 94.3 (0.4) 92.8 (0.4) 67.1 (0.4) 80.6 (0.4) 94.4 (0.3) 93.8 (0.5) 86.2 (0.3) With chronic
condition 412 80.1 (1.2) 62.5 (2.1) 62.3 (1.6) 51.0 (1.0) 62.2 (1.2) 74.1 (1.4) 67.6 (2.2) 72.8 (1.1)
t 27.9* 23.8* 28.2* 18.1* 19.4* 23.3* 18.7* 14.6*
*p < 0.001, **p < 0.01, ***p < 0.05, ****p < 0.1.
Table 5. Mean SF-36 scale scores for women who differ according to infertility status
Mean scale score (standard error)
n PF RP BP GH VT SF RE MH
Women (45 years and less) reporting infertility
‘Healthy’ 1,387 94.6 (0.3) 84.1 (0.9) 83.1 (0.7) 63.7 (0.5) 75.0 (0.5) 89.2 (0.5) 87.2 (0.8) 82.2 (0.5) With infertility 172 88.0 (1.6) 74.9 (3.0) 70.6 (2.4) 57.0 (1.5) 69.2 (1.7) 79.5 (1.9) 74.6 (3.0) 75.8 (1.7)
t 5.8* 3.5* 6.0* 4.7* 3.6* 6.3* 5.0* 4.3* *p < 0.001, **p < 0.01, ***p < 0.05, ****p < 0.1.
measure what the questionnaire is supposed to measure (health status).
Problems associated with high ceiling effects on five of the eight scales (PF, RP, BP, SF and RE) of the Kiswahili SF-36 translation were pointed out and discussed by Wagner et al.12Questions were raised by
the authors whether this is related to translation issues or cultural norms or whether this reflects a good health status of a comparatively young population. However, ceiling effects on these scales were much lower for people with an acute illness, disability or chronic condition sustaining the hypothesis that high SF-36 scale scores in the subgroup of ‘healthy’ people echo sound levels of health.12
The validity of the Kiswahili translation is supported by observations which are similar to those in the US,16UK,10Sweden,11and Australia.19SF-36 scale
scores were generally lower for women than for men and older people scored lower on measures of physical health domains than younger people. As observed in the UK10,21
albeit with a very different classification system, people who were of lesser socioeconomic status scored lower than those of higher socioeconomic status. These results lend support to the notion that it is possible to translate a general health status instrument developed in a highly industrialized country for use in a low-income African country, more importantly in a country with markedly different sociocultural and socioeconomic characteristics.
Different from observations in the US,16
UK10,13,21
Sweden11
and Germany,7
older people also scored lower than younger people on those SF-36 scales that predominantly measure psychological health and well-being. Two distinct explanations of these findings are possible. Kiswahili items and scales, particularly those that address what are termed mental health concepts, may carry a different inter-pretation for people in Dar es Salaam than they do for people in other countries. Alternatively, the health of the general population in Dar es Salaam may differ from that of other general populations studied to date.
Assuming that, based on the favourable results of the translation process, the psychometric evaluation and the known-groups validation analyses, in conjunction with the representative sampling results, SF-36 scale scores truly reflect the general health status of the adult Dar es Salaam population, people are healthier than the US general population on average. However, residents of Dar es Salaam are generally a young population (mean age 31 years median 28 years). Mean scale scores of the Tanzanian popula-tionx12
are similar to those of people between 25 and 34 years of age in the US general population16
in all but
the GH, VT and MH scales (mean scale scores for Tanzania/US: PF 94/92, RP 84/89, BP 83/81, GH 63/77, VT 75/61, SF 88/85, RE 86/82 and MH 82/73).
To explore these similarities and differences in scale scores further, more information about the meaning of SF-36 scale scores and more research into the under-lying factor structure of the eight scales in Tanzania is needed. To this end, future known-groups validation studies in Tanzania should involve different popula-tions such as rural populapopula-tions and other populapopula-tions such as those with specific disorders and include reliable external measures of clinical and other criteria that define, for example, groups of people with clinically diagnosed mental and physical health problems and groups of people in clearly different socioeconomic classes.
Once more information about the validity and interpretation of the Kiswahili SF-36 is gathered, multiple uses of this general health status measure within Tanzania and across African countries and non-African countries become possible. For example, in this study, although based on a small sample, people who were in a polygamous marriage had lower SF-36 scale scores than those in a monogamous marriage. Within the increasing focus on gender issues and in the context of the discussions of women’s rights, it might be interesting to explore further the potential differences in the well-being of people who are in a monogamous marriage compared to those who are in a polygamous marriage. Similarly, the health burden of conditions common to people in Tanzania, such as HIV/AIDS and the relative health benefits of different treatments can be assessed.
As further studies support the validity of the Kiswahili SF-36, the mean scale scores of people in this sample may serve as normative values for this adult, urban population. SF-36 population norms in Tanzania will allow clinicians, researchers and health officials to monitor the health of the general population over time, as changes in the country’s health care systems occur and to estimate the poten-tially differential health impact of those changes on groups of the population. In addition, general population norms allow for comparisons of health status profiles across countries. To date, SF-36 general population norms of industrialized countries have been compared.5,9
Methodological differences notwithstanding, data from this and further studies of the SF-36 in Tanzania may provide an interesting opportunity for comparisons of perceived health status of people in this East African country with those of people in industrialized countries.
Acknowledgements
The authors would like to thank the Dar es Salaam City Council, the collaborators of the Dar es Salaam Urban Health Project and the population of the sentinel surveillance area for their support and their participation in the study. We greatly appreciate the contributions of Mary Lewanga and all interviewers during data collection.
This paper is dedicated to Professor Donald G. McLarty, whose work contributed not only to this study but also to the improvement of health services in Tanzania. Sadly, Professor McLarty died before this paper could be completed.
References
1. Murray JL, Lopez AD. Evidence-based health policy – lessons from the Global Burden of Disease Study. Science 1996; 274 (5288): 740–743.
2. Murray JL, Lopez AD, eds. Global Comparative Assessments in the Health sector. Disease Burden, Expenditures and Intervention Packages. Geneva: World Health Organization, 1994.
3. World Health Organization. World Health Organisation Constitution. In: World Health Organization, eds. Basic Documents. Geneva: World Health Organization, 1948. 4. World Bank. World Development Report 1993: Investing in
Health. Washington, DC: World Bank, 1993.
5. Ware JE, Gandek B, Keller SD et al. Evaluating instru-ments used cross-nationally: methods from the IQOLA Project. In: Spilker B, ed. Quality of Life and Pharmacoeconomics in Clinical Trials. Philadelphia: Lippiconcott-Raven Publishers, 1996: 681–692.
6. Anderson RT, Aaronson NK, Leplège AP, Wilkin D. International use and application of generic health-related quality of life instruments. In: Spilker B, ed. Quality of Life and Pharmacoeconomics in Clinical Trials. Philadelphia: Lippiconcott-Raven Publishers, 1996: 613–632.
7. Bullinger M. German translation and psychometric testing of the SF-36 Health Survey: preliminary results from the IQOLA Project. Soc Sci Med 1995; 41 (10): 1359–1366.
8. Ware JE, Sherbourne CD. The MOS 36-Item Short-Form Health Survey (SF-36). I. Conceptual framework and item selection. Med Care 1992; 30 (6): 473–483.
9. Ware JE, Keller SD, Gandek B et al. Evaluating transla-tions of health status questionnaires: methods from the IQOLA Project. Int J Technol Assess Health Care 1995: 11(3): 525–551.
10. Jenkinson C, Coulter A, Wright L. The Short-Form 36 (SF-36) Health Survey questionnaire: normative data for adults of working age. BMJ 1993; 306: 1437–1440. 11. Sullivan M, Karlsson J, Ware JE. The Swedish SF-36
Health Survey: I. Evaluation of data quality, scaling assumption, reliability and construct validity across general populations in Sweden. Soc Sci Med 1995; 41(10): 1349–1350.
12. Wagner AK, Wyss K, Gandek B, Kilima P, Lorenz N, Whiting D. A Kiswahili version of the SF-36 Health Survey for use in Tanzania: translation and tests of scaling assumptions. Qual Life Res 1998; 7: 000–000. 13. Stewart AL, Hays RD, Ware JE. Methods of validating
MOS health measures. In: Stewart Al, Ware JE, eds. Measuring Functioning and Well-being: The Medical Outcomes Study Approach. Durham, NC: Duke University Press, 1992: 309–324.
14. Wyss K, Whiting D, Kilima P et al. Utilisation of government and private health services in Dar es Salaam. E Afr Med J 1996; 73(6): 357–363
15. Kitange HM, Machibya H, Mtasiwa D et al. Outlook for survivors of childhood in sub-Saharan Africa: adult mortality in Tanzania. BMJ 1996; 312: 216–220.
16. Ware JE, Kosinski M, Gandek B. SF-36 Health Survey. Manual and Interpretation Guide. Boston, MA: The Health Institute, New England Medical Center, 1993.
17. Ware JE, Kosinski M, Keller SD. SF-36 Physical and Mental Health Summary Scales. Boston, MA: The Health Institute, New England Medical Center, 1994.
18. United Republic of Tanzania. Policy Implications of Adult Morbidity and Mortality. End of Phase 1 Report. Dar es Salaam: Ministry of Health, 1997: 209–232.
19. Behavioural Epidemiology Unit. South Australian Population Norms for the Short Form 36 (SF-36) Health Status Questionnaire. Adelaide; South Australian Health Commission, 1995.
20. McHorney CA, Ware JE, Raczek AE. The MOS 36-Item Short-Form Health Survey (SF-36): II. Psychometric and clinical tests of validity in measuring physical and mental health constructs. Med Care 1993; 31(3): 247–263. 21. Hemingway H, Nicholson A, Stafford M, Roberts R,
Marmot M. The impact of socioeconomic status on health functioning as assessed by the SF-36 questionnaire: the Whitehall II study. Am J Public Health 1997 (September); 87(9):1484–90.
(Received 26 November 1997; accepted 8 May 1998)