HAL Id: hal-02962507
https://hal.archives-ouvertes.fr/hal-02962507
Submitted on 12 Oct 2020HAL is a multi-disciplinary open access
archive for the deposit and dissemination of sci-entific research documents, whether they are pub-lished or not. The documents may come from teaching and research institutions in France or abroad, or from public or private research centers.
L’archive ouverte pluridisciplinaire HAL, est destinée au dépôt et à la diffusion de documents scientifiques de niveau recherche, publiés ou non, émanant des établissements d’enseignement et de recherche français ou étrangers, des laboratoires publics ou privés.
Identifying the Stoichiometry of Metal/Ligand Complex
by Coupling Spectroscopy and Modelling: a
Comprehensive Study on Two Fluorescent Molecules
Specific to Lead
William René, Catherine Branger, Madjid Arab, Katri Laatikainen, Stéphane
Mounier, Véronique Lenoble
To cite this version:
William René, Catherine Branger, Madjid Arab, Katri Laatikainen, Stéphane Mounier, et al.. Identi-fying the Stoichiometry of Metal/Ligand Complex by Coupling Spectroscopy and Modelling: a Com-prehensive Study on Two Fluorescent Molecules Specific to Lead. Journal of Fluorescence, Springer Verlag, 2019, 29 (4), pp.933-943. �10.1007/s10895-019-02405-0�. �hal-02962507�
HAL Id: hal-02184958
https://hal.archives-ouvertes.fr/hal-02184958
Submitted on 9 Dec 2019HAL is a multi-disciplinary open access
archive for the deposit and dissemination of sci-entific research documents, whether they are pub-lished or not. The documents may come from teaching and research institutions in France or abroad, or from public or private research centers.
L’archive ouverte pluridisciplinaire HAL, est destinée au dépôt et à la diffusion de documents scientifiques de niveau recherche, publiés ou non, émanant des établissements d’enseignement et de recherche français ou étrangers, des laboratoires publics ou privés.
Identifying the stoichiometry of metal/ligand complex
by coupling spectroscopy and modelling: a
comprehensive study on two fluorescent molecules
specific to lead
William René, Madjid Arab, Katri Laatikainen, Stéphane Mounier, Catherine
Branger, Véronique Lenoble
To cite this version:
William René, Madjid Arab, Katri Laatikainen, Stéphane Mounier, Catherine Branger, et al.. Identi-fying the stoichiometry of metal/ligand complex by coupling spectroscopy and modelling: a compre-hensive study on two fluorescent molecules specific to lead. Journal of Fluorescence, Springer Verlag, 2019, 29 (4), pp.933-943. �10.1007/s10895-019-02405-0�. �hal-02184958�
Identifying the stoichiometry of metal/ligand complex by coupling spectroscopy and
modelling: a comprehensive study on two fluorescent molecules specific to lead.
W. René
a,b,c, C. Branger
a, M. Arab
b, K. Laatikainen
d, S. Mounier
c, V. Lenoble
ca MAPIEM Laboratory, University of Toulon, CS 60584, 83041 Toulon Cedex 9, France b IM2NP Laboratory, University of Toulon, CS 60584, 83041 Toulon Cedex 9, France c MIO Laboratory, University of Toulon, CS 60584, 83041 Toulon Cedex 9, France
d Laboratory Separation Technology, Lappeenranta University of Technology, P.O. Box 20, FI-53851 Lappeenranta, Finland
ABSTRACT
Two new chemosensors for lead (II) were synthesized based on 5-((anthracen-9-ylmethylene) amino)quinolin-10-ol (ANQ): (10-(8-hydroxyquinolin-5-ylimino)methyl)anthracen-9-yl)methyl methacrylate (ANQ-MMA) and
((10-((4-vinylbenzoloxy)methyl)anthracen-9-yl)methyleneamino)quinoline-8-ol (ANQ-ST). Complexation of those molecules with Pb2+ was studied
at room temperature using Visible absorption and fluorescence spectroscopies. Thanks to the UV-visible absorption spectroscopy it appeared that ANQ-MMA formed 1:1 and 1:2 complexes with lead (II) and ANQ-ST only 1:1 complex. For both molecules, the fluorescence excitation-emission matrices (EEM) signal intensity increased from 0 to 100 µmol.L-1 of lead (II) followed by a saturation for
higher concentrations. The decomposition of the obtained EEMs gave a set of empiric fluorescent components that have been directly linked to the distribution of lead complexes obtained with the UV-visible absorption spectroscopy study. This correlation allowed to evidenced metal/ligand complex stoichiometry and emerge as a new method to identify empiric components. Moreover, the two ligands showed a promising selectivity for Pb2+, turning them interesting probes for this hazardous metal.
Introduction
Lead is one of the most toxic metal for humankind and the environment. Lead naturally exists in Earth’s crust but its presence in the environment is mainly due to human activities such as fuel combustion and industrial processes [1]–[3]. This trace metal can accumulate in water and soil organisms and influence the global balances and food chains [4]. Taken up from food, air or drinking water, lead causes inhibition of brain development, kidney and physical growth impairments [5], [6]. The maximum concentration level in drinking water is set at 10µg.L-1 [7]. The development of probes
and sensors to detect lead therefore appears to be necessary especially for its most toxic species, the ionic lead (II) form. Fluorescence probes for the detection of trace metal ions is getting attention due to easy signal transduction and high sensitivity [8]. Fluorescent ligand for lead (II) have been recently developed based on fluorescein [9], rhodamine [10], [11], crown ether derivates [12], [13] or scaffold molecules [14]–[16].
Typical fluorescent chemosensors, also called fluoroionophores, include a recognition site or chelating group responsible for the efficiency of the binding and a fluorescent part that converts the ion
recognition into a fluorescent signal. Upon ion complexation, their fluorescence response can be either quenched or enhanced but the turn-on response is preferable in order to avoid interferences with external factors that can be observed in the case of turn-off response [17]. One of the possible mechanism responsible for a turn-on fluorescence response is the photoinduced electron transfer (PET) process [18]–[20]. This process is based on a quenching of the fluorescence response of the fluorophore moiety by an electron transfer from the ionophore. Upon ion binding, this electron transfer is prevented and consequently fluorescence intensity is enhanced.
Anthracene is widely used as a fluorophore to design chemosensors, owing to the ease to modify its structure [21]. Anand et al. synthesized 5-((anthracen-9-ylmethylene)amino)quinoline-10-ol (ANQ), based on an anthracene platform, to detect lead (II) with a turn-on fluorescence response based on PET process [22].
In the present study, ANQ was modified to design two new fluorescent ligands for lead (II): (10-(8-hydroxyquinolin-5-ylimino)methyl)anthracen-9-yl)methyl methacrylate (ANQ-MMA) and ((10-((4-vinylbenzoloxy)methyl)anthracen-9-yl)methyleneamino)quinoline-8-ol (ANQ-ST). The formation of
the complexes between lead (II) with ANQ-MMA and ANQ-ST was first investigated using UV-visible absorption spectroscopy and the distribution of the various complexes (free metal, 1:1 complex, 1:2 complex, 1:3 complex and free ligand) was calculated. In parallel, the fluorescence response of the two ligands upon the addition of lead (II) was analysed. Within this step, the recovered fluorescent signal was decomposed into a combination of fluorescent components. These components were then correlated to the above-mentioned possible 1:1 and 1:2 complexes. Such innovative
correlation allowed to associate a modelled fluorescent signal with a complex of known-stoichiometry, an approach that opens a range of possibilities in the field of material synthesis.
Experimental
1.1. Reagents and Instruments
Anthraquinone, sodium hydride (60% in oil dispersion), lithium bromide, triethylamine, 4-vinylbenzylchloride, 18-crown-6 ether and 5-amino-8-hydroxyquinoline dihydrochloride were purchased from Sigma-Aldrich (reagent grade).
AgNO3, CaCO3, ZnSO4 and NaNO3 were purchased from Fisher Scientific (Analytical grade),
Al(NO3)3, CdSO4, Co(NO3)2 and CuSO4 were from Merk (pro analysis grade), Pb(NO3)2 and Fe(NO3)3
were purchased from Carlo Erba (Analytical grade).
All other chemical reagents and solvents were purchased from Acros Organics (reagent grade). Dry solvents were purchased as extra dry grade (Acros Organics).
1H, 13C and 1H - 13C heteronuclear single quantum coherence (HSQC) nuclear magnetic resonance
(NMR) measurements were obtained on a Bruker 400 MHz Ultrashield spectrometer. Mass spectra were measured on Bruker Esquire 6000 instrument.
Melting points were determined on Bushi M-560 apparatus.
1.2. Synthesis of (10-(8-hydroxyquinolin-5-ylimino)methyl)anthracen-9-yl)methyl methacrylate (ANQ-MMA)
Step 3: Synthesis of (10-formylanthracen-9-yl)methyl methacrylate
2.51 mL of freshly distilled methacryloyl chloride (26 mmol) were added to a solution of
10-(hydroxymethyl)anthracen-9-carbaldehyde (3.04 g, 13 mmol) and triethylamine (10.76 mL, 77 mmol) in tetrahydrofuran cooled at 0°C. The solution mixture was stirred at 0°C for 2h and then at room temperature for 20h. The solvent was distilled off under reduced pressure. The crude product was solubilized in dichloromethane, washed five times with 100 mL of a saturated potassium carbonate solution and then twice with 100 mL of distilled water. The product was finally dried over magnesium sulphate to give 3.48 g of (10-formylanthracen-9-yl)methyl methacrylate. (Scheme 1a) Yield: 89 %. Melting point: 132.7°C
1H NMR (400 MHz, DMSO-d
6, δ in ppm), δ: 11.45 (s, 1H, CHO), 8.90 (dd, J = 7.6, 2.2 Hz, 2H,
position 4), 8.54 (dd, J = 7.5, 2.1 Hz, 2H, position 7), 7.73 (m, 4H, position 5 and 6), 6.25 (s, 2H, CH2), 5.94 (s, 1H, position 13), 5.63 (s, 1H, position 13), 1.83 (s, 3H, CH3). (Fig. A)
13C NMR (400 MHz, CDCl
3, δ in ppm), δ: 194.05 (C10), 167.37 (C11), 135.93 (C2), 134.15 (C12),
131.14(C8), 130.66(C3), 128.39(C5), 127.74(C9), 126.82 (C6), 126.53 (C13), 124.92 (C7), 124.24 (C4),
58.94 (C1), 18.39 (C14). (Fig. B)
LC-MS: calculated: 304. Found: 305.13 ((10-formylanthracen-9-yl)methyl methacrylate+ H)+ (Fig. C)
Step 4: Synthesis of (10-(8-hydroxyquinolin-5-ylimino)methyl)anthracen-9-yl)methyl methacrylate (ANQ-MMA)
100 mL of an ethanolic solution containing (10-formylanthracen-9-yl)methyl-methacrylate (1.10 g, 3.62 mmol), 5-amino-8-hydroxyquinoline dihydrochloride (0.84 g, 3.62 mmol) and 5 drops of triethylamine was refluxed for 4h. Then the solvent was removed under reduced pressure. The crude product was washed with 100 mL of diethyl ether then with 100 mL of a solution containing
potassium carbonate (0.55 g, 3.98 mmol) and extracted with dichloromethane. After distillation under reduced pressure, 1.21 g of the product ANQ-MMA is obtained. (Scheme 1b) Yield: 75 %. Melting point: 220.0°C.
1H NMR (400 MHz, DMSO-d
6, δ in ppm), δ: 10.03 (s, 1H, OH), 9.96 (s, 1H, position 10), 8.95 (dd, J
= 4.1, 1.6 Hz, 1H, position 15), 8.80 (d, J = 9.4 Hz, 2H, position 4), 8.73 (dd, J = 8.5, 1.6 Hz, 1H, position 14), 8.54 (d, J = 8.2 Hz, 2H, position 7), 7.78 (d, J = 8.2 Hz, 1H, position 13), 7.67 (m, 5H, position 5, 6 and 19), 7.25(d, 1H, position 18), 6.30 (s, 2H, CH2), 5.96 (s, 1H, position 22), 5.65 (s,
1H, position 22), 1.86 (s, 3H, CH3). (Fig. D) 13C NMR (400 MHz, DMSO-d
6, δ in ppm), δ: 167.05 (C20), 159.14 (C10), 153.24 (C17), 149.26 (C15),
139.58, 138.92, 136.23, 132.80, 130.70, 130.18, 130.01, 127.29, 126.79, 126.30, 125.26, 122.65, 115.34 (C18), 111.81 (C19), 59.39 (C1), 18.55 (C23). (Fig. E)
LC-MS: calculated: 446. Found: 447.14 (ANQ-MMA + H+) (Fig. F)
1.3. Synthesis of ((10-((4-vinylbenzyloxy)methyl)anthracene-9-yl)methyleneamino)quinoline-8-ol (ANQ-ST)
Synthesis of 4-vinylbenzyliodide
This synthesis was inspired from Chalal et al. work.[23] A mixture of 4-vinylbenzylchloride (5.0 g, 32.9 mmol) and NaI (7.0 g, 42.7 mmol) in acetone under argon was refluxed for 20h. After cooling, the mixture was poured into water and extracted with dichloromethane. To neutralize the excess of iodine, the mixture was washed twice with 100 mL of Na2SO3 satured solution. Then the organic
phase was washed twice with 100 mL of water and dried over MgSO4. After removal of the solvent
under reduced pressure, 7,9 g of product was obtained. (Scheme 2a) Yield: 99 %.
1H NMR (400 MHz, CDCl
3, δ in ppm), δ: 7.38 (s, 4H, aromatic H), 6.74 (dd, J= 17.6, 10,7 Hz, 1H,
position 6), 5.82 (dd, J=17.6, 0.7 Hz, 1H, position 7), 5.32 (dd, 10.7, 0.7 Hz, 1H, position 7), 4.50 (s, 2H, position 1). (Fig. G))
13C NMR (400 MHz, CDCl
3, δ in ppm), δ: 138.95 (C2), 137.32 (C5), 136.39 (C6), 129.13 (C3), 126.81
(C4), 114.58 (C7), 6.09 (C1). (Fig. H) 1H - 13C HSQC NMR (400 MHz, CDCl
3): Expected crosspeaks signals were observed. (Fig I)
Step 3’: Synthesis of 9-((4-vinylbenzyloxy)methyl)anthracene-10-carbaldehyde
In a 250 mL flask, 287 mg of sodium hydride (7.2 mmol), 35 mg of 18-crown-6 ether and 10 mL of dry tetrahydrofuran were added. The mixture was put under argon and cooled down with a water/ice bath. Then 1 g of 10-(hydroxymethyl)anthracen-9-carbaldehyde (4.23 mmol) dissolved in 100 mL of dry tetrahydrofuran were slowly added. After one hour of stirring at room temperature and under argon, the mixture was cooled with a water/ice bath and 1,76 mg of 4-vinylbenzyliodide (7.2 mmol) diluted in 10 mL of dry tetrahydrofuran was added dropwise. The mixture was stirred for 24 hours under argon at room temperature, then a few drops of water were added and the tetrahydrofuran was distilled off under reduced pressure. The crude product was extracted with dichloromethane and dried over magnesium sulphate. The dichloromethane was distilled off under reduced pressure to give a residue which was washed twice with 50 mL of cold hexane and purified on a silica gel column eluting with ethyl acetate–cyclohexane (1:9, v/v).to obtain 490 mg of the product as a yellow oil. (Scheme 2b) Yield: 33 %.
1H NMR (400 MHz, CDCl
3, δ in ppm), δ: 11.46 (s, 1H, CHO), 8.87 (d, J= 8.8 Hz, 2H, position 13),
8.36 (d, J=8.8 Hz, 2H, position 14), 7.61 (dtd, 4H, positions 4 and 7), 7.42 (dd, 4H, positions 5 and 6), 6.78 (dd, J=17.6, 10.9 Hz, 1H, position 16), 5.82 (dd, J=17.6, 0.8Hz, 1H, CH2), 5.42 (s, 2H, position 1), 5.31 (dd, J=10.9, 0.8 Hz, 1H, CH2), 4.73 (s, 2H, position 11). (Fig. J) 13C NMR (400 MHz, CDCl 3, δ in ppm), δ: 193.96 (C10), 137.57 (C2), 137.45 (C15), 136.75 (C12), 136.60 (C16), 131.28 (C8), 130.53 (C9), 128.45 (C5), 128.33 (C6), 126.82 (C3), 126.46 (C7), 126.36 (C4), 125.23 (C14), 124.07 (C13), 114.18 (C17), 72.71 (C11), 64.05 (C1). (Fig. K)
1H - 13C HSQC NMR (400 MHz, CDCl
3): Expected crosspeaks signals were observed. (Fig L)
Step 4’: Synthesis of ((10-((4-vinylbenzoloxy)methyl)anthracen-9-yl)methyleneamino)quinoline-8-ol (ANQ-ST)
100 mL of an ethanolic solution containing 9-((4-vinylbenzyloxy)methyl)antharcene-10-carbaldehyde (380 mg, 1.08 mmol), 5-amino-8-hydroxyquinoline dihydrochloride (252 mg, 1.08 mmol) and 10 drops of triethylamine was refluxed for 4 hours. Then the solvent was removed under reduced pressure and the crude product was washed twice with 100 mL of diethyl ether. After distillation under reduced pressure of the filtrate, the product was chromatographed on silica gel 60 eluting with ethyl acetate– cyclohexane (1:9, v/v). Evaporation of the appropriate fractions gave 160 mg of ANQ-ST.as brown powder. (Scheme 2c) Yield: 30%. Melting point: 210°C
1H NMR (400 MHz, CDCl
3, δ in ppm), δ: 9.84 (s, 1H, position 10, 8.89 (dd, J=4.2, 1.6 Hz, 1H,
position 15) 8.85 (dd, j=8.5, 1.6 Hz, 1H, position 13), 8.78 (m, 2H, position 22), 8.44 (m, 2H, position 23), 7.60 (m, 4H, positions 4 and 7), 7.52 (dd, J=8.5, 4.5 Hz, 1H, position 14), 7.44 (m, 5H, positions 5, 6 and 19), 7.31 (m, 1H, position 18), 6.77 (dd, J=17.6, 10.9 Hz, 1H, position 25), 5.80 (dd, J=17.6, 0.8 Hz, 1H, CH2), 5.57 (s, 2H, position 1), 5.29 (dd, J=10.9, 0.8 Hz, 1H, CH2), 4.76 (s, 2H, position 20). (Fig M) 13C NMR (400 MHz, CDCl 3, δ in ppm), δ: 158.84 (C10), 151.33(C17), 148.59 (C15), 140.88 (C11), 138.33 (C16), 137.87 (C2), 137.35 (C21), 136.64 (C25), 133.48 (C13), 132.39 (C24), 130.90 (C9), 130.34 (C8), 129.69 (C3), 128.38 (C5), 126.67 (C6), 126.41 (C7), 126.22 (C4), 125.52 (C22), 125.19 (C12), 124.14 (C23), 122.00 (C14), 114.02 (C19), 113.94 (C26), 109.72 (C8), 72.38 (C20), 64.20 (C1). (Fig. N)
LC-MS: calculated: 494. Found: 495.18 (ANQ-ST + H+) (Fig. O) 1H -13C HSQC NMR (400 MHz, CDCl
Scheme 2. Indexation of the carbons observed on the 13C NMR spectrum of a) 4-vinylbenzyliodide, b)
9-((4-vinylbenzyloxy)methyl)anthracene-10-carbaldehyde and c) ANQ-ST
1.4. Lead (II) and ANQ-MMA (or ANQ-ST) species distribution modelling from UV-visible spectra
Lead (II) complexation by ANQ-MMA and ANQ-ST was studied in acetone (80%) - water (20%) mixture at room temperature. The experiments were performed in 3 mL quartz Suprasil cells. The combined concentration of lead (II) (0.01-0.09 mmol.L-1) and ANQ-MMA or ANQ-ST (0.09-0.01
mmol.L-1) was kept constant (0.1 mmol.L-1), but the ratio ligand/lead was varied from 0.1 to 10 using
Pb(NO3)2 as lead source. For the two molecules, 14 spectra were recorded using UV-vis spectrometer.
At equilibrium, the distribution of the various species (free metal, 1:1 complex, 1:2 complex, 1:3 complex and free ligand) was calculated using a commercial program (HypSpec) based on the least-squares minimization scheme[24], [25]. Stability constants, extinction coefficients and concentrations of all absorbing components were simultaneously estimated. For uncomplexed lead (II), the extinction coefficients were calculated from independent measurements.
1.5. Fluorescence Measurements
All experiments and measurements were performed at room temperature, in acetone (80%) - water (20%) mixture. AgNO3, CaCO3, NaNO3, CdSO4, Co(NO3)2, CuSO4, Pb(NO3)2, ZnSO4 Al(NO3)3, and
Fe(NO3)3 were used as metal sources.
1.5.1. Lead experiments
The fluorescent signal as a function of increasing lead concentration was studied. Solutions containing 50 µmol.L-1 of the fluoroionophore ANQ-MMA or ANQST and 0, 5,10, 30, 50, 100 and 300 µmol.L-1
of lead (II) were prepared and analysed.
The fluorescence signal of each the two synthesized molecules in presence of lead or other ions, taken separately, was measured. Solutions containing 50 µmol.L-1 of the molecule and 200 µmol.L-1 of lead
(II) or 200 µmol.L-1 of silver (I), sodium (I), calcium (II), cadmium (II), cobalt (II), copper (II), zinc
(II), aluminium (III) or iron (III) were prepared and analysed for their fluorescence signal. Then, the fluorescent signal of a constant lead concentration in presence of interfering ions was studied. A solution containing 50 µmol.L-1 fluoroionophore, 100 µmol.L-1 of lead and 100 µmol.L-1 of
one interfering ion was prepared. The interfering ion was chosen among silver (I), sodium (I), calcium (II), cadmium (II), cobalt (II), copper (II), zinc (II), aluminium (III) or iron (III).
1.5.2. Excitation-Emission Matrix (EEM) of fluorescence Measurement
The EEMs were measured on a HITACHI F4500 spectrofluorimeter. The excitation wavelength ranges from 320 to 460 nm, with a step of 10 nm and an excitation slit of 1 nm. The corresponding emission spectra were acquired from 350 to 550 nm with a scan speed of 2400 nm.min−1 and a slit of 1
nm. The photomultiplicator tension was fixed 950 V and the integration time set at 0.1 s. The extraction of the 5 nm stepped emission was obtained by FL-Solution software.
1.5.3. CP/PARAFAC Analysis
First, all the EEMs were cleaned from the diffusion signals: Rayleigh by cutting the diffusion band (20 nm) and Raman from first and second order by applying Zepp procedure[26]. Then, CP/PARAFAC algorithm was used[27], [28]. This algorithm allows the decomposition of a dataset of matrices into a set of fluorescent components, considering that all the considered EEM are constituted by a linear combination of the same independent components. The correct number of component needed to model the dataset is defined by evaluating the CORCONDIA score. Users have to test a range of model, i.e. number of components, to detect the best number of components.[29] In this work, decomposition investigation was done from two to five components and the higher number of component giving a CORCONDIA test over 60 %was selected as the optimal component number.[30] Then some components given by this decomposition were directly linked to the complexes metal-ligand evidenced by the UV-visible study.
2. Results and discussions
2.1. Synthesis and properties of fluoroionophores ANQ-MMA and ANQ-ST
The synthesis of ANQ-MMA and ANQ-ST took place in four steps with an overall yield of 63 % for ANQ-MMA and 10% for ANQ-ST (Scheme 3). The preparation of the intermediate,
10-(hydroxymethyl)anthracen-9-carbaldehyde, was inspired by the work of various authors[31]–[34]. For ANQ-MMA, the third step is an esterification reaction catalysed by a tertiary amine, followed by a coupling between the intermediate compound and the 5-amino-8-hydroxyquinoline dihydrochloride. In order to synthesize ANQ-ST, the intermediate compound, 4-vinylbenzyliodide, was prepared to couple 10-(hydroxymethyl)anthracen-9-carbaldehyde by its hydroxyl group with 4-vinylbenzyle before the final Schiff-base formation reaction. Molecular structures were characterized by 1H NMR, 13C NMR, 1H-13C HSQC NMR and LC-MS techniques (see Experimental section).
Scheme 3. Synthesis route of ANQ-MMA and ANQ-ST
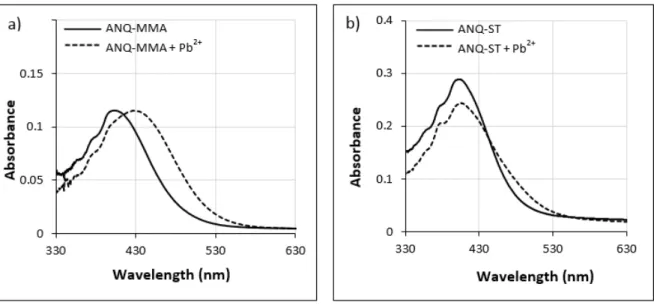
The photophysical properties of ANQ-MMA and ANQ-ST were investigated. Both molecules showed a major absorption band at 405 nm. Upon addition of Pb2+, the absorbance of ANQ-MMA (Fig. 1a)
and ANQ-ST (Fig. 1b) underwent a red shift of 25 and 3 nm, respectively. This result emphasized a photophysical effect of lead (II) complexation by those molecules.
Complex formation was studied by keeping the overall concentration of lead and fluoroionophore constant while varying their molar ratio. The distribution of the complexes formed between Pb2+ and
the two fluoroionophores was calculated using HypSpec, a commercial program, based on the least squares minimization method (Fig. 2)[24], using the following equilibrium equations:
M +L
⇔ML with K
ML=
ML
M . L
ML+ L
⇔M L
2with K
ML2=
M L
2ML . L
L
0=
L+ML+2 M L
0M
0=
M +ML+M L
2The amount of each complex is given as a fraction of the total distribution and stability constants are shown in Table 1. According to the distribution diagrams, for ANQ-MMA, 1:1 and 1:2 complexes coexist up to a ratio of 1 between Pb2+ and ANQ-MMA, then only the 1:1 remains in solution. For
ANQ-ST, whatever the ratio used, only the 1:1 complex is formed in solution. Stability constants values proved that the formation of all the complexes is quantitative with a higher Log (β1) value for ANQ-MMA.
Log (β1) Log (β2)
ANQ-MMA 7.2 11.8
ANQ-ST 5.1 /
Table 1. Stability constants of the complexes formed with lead for ANQ-MMA and ANQ-ST
Fig. 1. Absorbance spectra of a) ANQ-MMA and b) ANQ-ST (50 µmol.L-1) in acetone-water (4:1, v/v) solution and in presence of 100 µmol.L-1 of Pb2+.
Fig. 2. Metal and ligand species distribution calculated from UV-vis spectra using HypSpec program[25] for lead and a) ANQ-MMA or b) ANQ-ST. Solvent: acetone-water (4:1, v/v).
2.2. Fluorescent detection of Pb2+
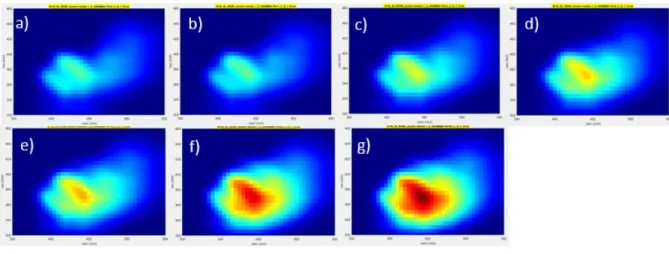
The fluorescence of the molecules was monitored upon the addition of lead (II). The EEMs show a massive peak located at (λex/λem) = 388/425 nm for ANQ-MMA (Fig. 3) and at (λex/λem) = 380/420 nm
for ANQ-ST (Fig. 4). For both molecules, the fluorescence signal increased with increasing lead concentration (Fig. 5). The relative peak intensity of the EEMs underwent an important increase from 0 to 100 µmol.L-1 of lead (II) followed by a saturation for higher concentrations.
Fig. 3. EEMs obtained for acetone-water (4:1, v/v) solutions containing 50 µmol.L-1 of ANQ-MMA and a)0, b)5, c)10, d)30, e)50, f)100 or
g)300 µmol.L-1 of Pb2+
Fig. 4. EEMs obtained for acetone-water (4:1, v/v) mixtures solutions containing 50 µmol.L-1 of ANQ-ST and a)0, b)5, c)10, d)30, e)50, f)100 or g)300 µmol.L-1 of Pb2+
Fig. 5. Relative fluorescence intensity of acetone/water (4:1, v/v) solutions containing 50µmol.L-1 of a) ANQ-MMA or b) ANQ-ST upon the addition of lead ion and the modelled curves.
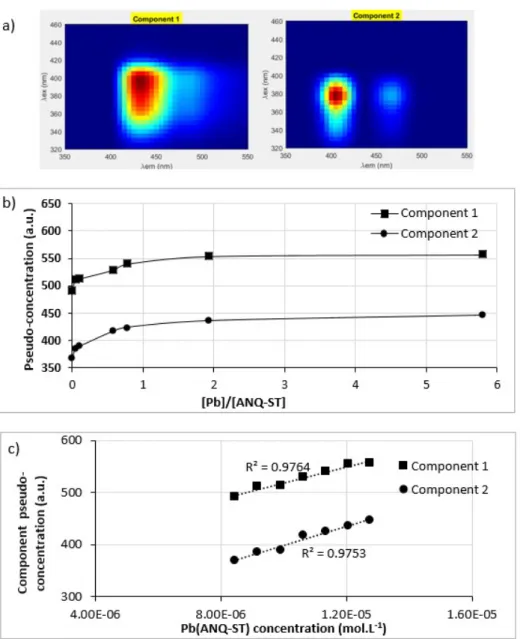
For ANQ-ST ligand, PARAFAC treatment gave optimum results for two components (CORCONDIA = 94 %). CORCONDIA scores obtained for 2 to 5 components decomposition are given in Table A. Component 1 showed a maximum located at λex/λem = 385-405/430-440 nm. Component 2 showed a
maximum located at λex/λem = 370-385/405-420 nm (Fig. 6a). Once those components extracted, the
contribution to fluorescence of each component to each EEM was calculated (Fig. 6b). Each
component fluorescence contribution is proportional to their concentration and to a quantum yield of fluorescence [35]. Coupling PARAFAC decomposition with the species distribution (see section 2.1), it seemed difficult to directly linked an empiric component to species with known stoichiometry. Indeed, the two empiric components given by the decomposition had the same contribution evolution. Correlating components contribution to Pb(ANQ-ST) complex concentration, both components had a good correlation with the formed complex (Fig. 6c). In other terms, it appeared that PARAFAC decomposition was not able to identify and separate real substances. It was probably because of the too close fluorescence fields of the real species. Indeed, a small 3 nm red-shift was observed on absorbance spectra when lead (II) was added to ANQ-ST (Fig. 1) meaning that free ANQ-ST and complexed ANQ-ST have probably close fluorescence fields.
Fig. 6. Component 1 and 2 obtained with PARAFAC decomposition with an optimum CORCONDIA score, b) their pseudo-concentration for ANQ-ST lead range study and c) their pseudo-concentration correlated to Pb(ANQ-ST) concentration
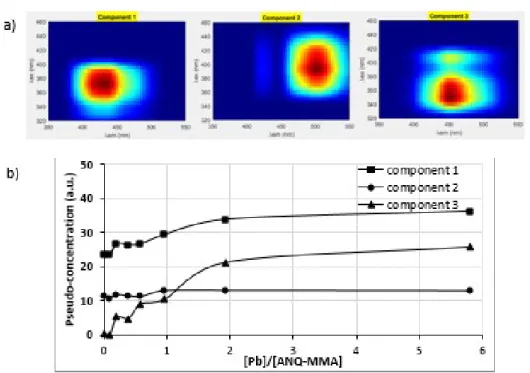
For ANQ-MMA ligand, PARAFAC treatment decomposition gave an optimum result for three components (CORCONDIA = 77 %). CORCONDIA scores obtained for 2 to 5 components
decomposition are given in Table A. Component 1 presented an excitation wavelength maximum at 365-385 nm and emission maximum at 420-440 nm. Component 2 presented an excitation wavelength maximum at 385-400 nm and emission maximum at 495-505 nm. Component 3 showed two maxima: one located at λex/λem = 410/450 nm and the other one located at λex/λem = 345-350/445-455 nm (Fig.
7a). The contribution of each component to each EEM measurements is depicted in Fig. 7b. Coupling PARAFAC decomposition with the species distribution (see section 2.1), it was possible to directly
linked an empiric component to species with known stoichiometry. By correlation it can be assumed that component 3 is directly linked to the predominant complex Pb(ANQ-MMA). Indeed component 3 contribution is increasing starting from zero. Moreover correlating components contribution to Pb(ANQ-MMA) complex concentration, it appeared that components 1 and 3 could be linked to this complex (Fig. 7c). But the 25 nm red-shift observed on absorbance spectra when lead (II) was added to ANQ-MMA (Fig. 1) indicated that component 3 was more likely to be associated to Pb(ANQ-MMA) complex. As a matter of fact, the fluorescence emission field of this component, higher than that of free ANQ-MMA, explained the 25 nm red-shift. In that case, it was therefore possible to link the fluorescent modeled component to an existing complex and to further demonstrate its
stoichiometry.
Fig. 7. Component 1, 2 and 3 obtained with PARAFAC decomposition with an optimum CORCONDIA score and b) their pseudo-concentration for ANQ-MMA lead range study and c) their pseudo-pseudo-concentration correlated to Pb(ANQ-MMA) pseudo-concentration
2.3. Competition analysis
In a preliminary study, the fluorescence properties of ANQ-MMA and ANQ-ST were measured in presence of different metal ions, showing that both fluoroionophores could almost selectively
recognize Pb2+ via fluorescence “off-on” responses. Indeed, an exaltation of the fluorescence intensity
fluorescent signal was also recorded in presence of Na+ (Fig. Q) and for ANQ-ST in presence of Co2+
(Fig. R) but the extent of the measured fluorescence was clearly below that obtained in presence of Pb2+.
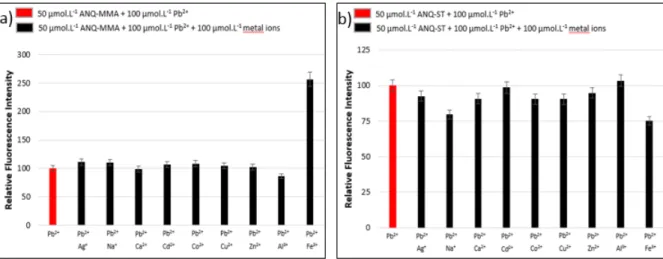
To determine the effect of other metal ions on the selectivity of ANQ-MMA and ANQ-ST for Pb2+,
competition experiments were carried out by measuring the fluorescence behaviour of the molecules in presence of Pb2+ ions and another metal ion (Ag+, Na+, Ca2+, Cd2+, Co2+, Cu2+, Zn2+, Al3+ or Fe3+)
(Fig. S and Fig. T). As seen in Fig. 8, for both molecules, all solutions containing an interfering ion, except for Fe3+, showed very weak variation of fluorescence intensity compared to the fluorescence
intensity of the solution containing lead (II). These results demonstrate that ANQ-MMA and ANQ-ST can act as selective probes for fluorescence detection of Pb2+
Fig. 8. Competition analysis of a) ANQ-MMA and b) ANQ-ST (50 µmol.L-1) in acetone-water (4:1, v/v) at room temperature
3. Conclusion
Two fluorescent ligands specific to lead (II) were synthesized: ANQ-MMA and ANQ-ST. Their turn-on fluorescence respturn-onse upturn-on the addititurn-on of Pb2+ was modelled with good correlation coefficients.
The decomposition of the fluorescence excitation-emission matrices allowed to give the number of fluorescent components involved in the fluorescent signal. The coupling those results with the
complex distribution of ANQ-MMA and ANQ-ST with lead (II) given by a UV-visible study allowed to link a modelled fluorescent component to a real complex of a known stoichiometry. Comparing fluorescence decomposition and UV-visible study appeared to be a new promising way to identify
species. Moreover, the two synthesized ligands showed interesting properties which could turn them as interesting probes, specific for lead (II). As a matter of fact, in addition to their modelled turn-on fluorescence responses upon the addition of lead (II), the performed competition analysis
demonstrated their selectivity.
Acknowledgements
This work is part of the PREVENT program. This work was supported by the University of TOULON, TPM council and Regional council.
[1] H. N. Kim, W. X. Ren, J. S. Kim, and J. Yoon, “Fluorescent and colorimetric sensors for detection of lead, cadmium, and mercury ions,” Chem. Soc. Rev., vol. 41, no. 8, pp. 3210–3244, Mar. 2012.
[2] C.-T. Chen and W.-P. Huang, “A Highly Selective Fluorescent Chemosensor for Lead Ions,” J. Am.
Chem. Soc., vol. 124, no. 22, pp. 6246–6247, Jun. 2002.
[3] A. R. Flegal and D. R. Smith, “Current needs for increased accuracy and precision in measurements of low
levels of lead in blood,” Environ. Res., vol. 58, no. 1, pp. 125–133, Jun. 1992.
[4] M. Wierzbicka and D. Antosiewicz, “How lead can easily enter the food chain — a study of plant roots,”
Sci. Total Environ., vol. 134, pp. 423–429, Jan. 1993.
[5] L. Wang, Y. Jin, J. Deng, and G). Chen, “G)old nanorods-based FRET assay for sensitive detection of Pb2+
using 8-17DNAzyme,” Analyst, vol. 136, no. 24, pp. 5169–5174, Nov. 2011.
[6] Y. Wei, R. Liu, Y. Wang, Y. Zhao, Z. Cai, and X. G)ao, “Hairpin oligonucleotides anchored terbium ion: a
fluorescent probe to specifically detect lead(II) at sub-nM levels,” Analyst, vol. 138, no. 8, pp. 2302–2307, Mar. 2013.
[7] The European Union, “Council Directive 98/83/EC of 3 November 1998 on the quality of water intended
for human consumption,” Off. J. Eur. Communities, vol. L 330, pp. 32–54, Dec. 1998.
[8] Y. Chen and K. Wang, “Azacrown[N,S,O]-modified porphyrin sensor for detection of Ag+, Pb2+, and
Cu2+,” Photochem. Photobiol. Sci., vol. 12, no. 11, pp. 2001–2007, Oct. 2013.
[9] H. Zheng, X.-Q. Zhan, Q.-N. Bian, and X.-J. Zhang, “Advances in modifying fluorescein and rhodamine
fluorophores as fluorescent chemosensors,” Chem. Commun., vol. 49, no. 5, pp. 429–447, Dec. 2012. [10] Z.-Q. Hu et al., “Highly sensitive and selective turn-on fluorescent chemosensor for Pb2+ and Hg2+ based
on a rhodamine–phenylurea conjugate,” Chem. Commun., vol. 46, no. 21, pp. 3765–3767, May 2010. [11] A. Pal, B. Bag, M. Thirunavoukkarasu, S. Pattanaik, and B. K. Mishra, “Solvent mediated tuning of
selectivity in a rhodamine based probe and bioimaging for Pb(II) detection in plant tissues,” RSC Adv., vol. 3, no. 40, pp. 18263–18266, Sep. 2013.
[12] W.-S. Xia, R. H. Schmehl, C.-J. Li, J. T. Mague, C.-P. Luo, and D. M. G)uldi, “Chemosensors for Lead(II) and Alkali Metal Ions Based on Self-Assembling Fluorescence Enhancement (SAFE),” J. Phys. Chem. B, vol. 106, no. 4, pp. 833–843, Jan. 2002.
[13] J. Park and Y. Kim, “A colorimetric probe for the selective naked-eye detection of Pb(II) ions in aqueous media,” Analyst, vol. 137, no. 14, pp. 3246–3248, Jun. 2012.
[14] Y. Chen and J. Jiang, “Porphyrin-based multi-signal chemosensors for Pb2+ and Cu2+,” Org. Biomol.
Chem., vol. 10, no. 24, pp. 4782–4787, Jun. 2012.
[15] R. Pandey, R. K. G)upta, M. Shahid, B. Maiti, A. Misra, and D. S. Pandey, “Synthesis and Characterization of Electroactive Ferrocene Derivatives: Ferrocenylimidazoquinazoline as a Multichannel Chemosensor Selectively for Hg2+ and Pb2+ Ions in an Aqueous Environment,” Inorg. Chem., vol. 51, no. 1, pp. 298– 311, Jan. 2012.
[16] S. G)oswami and R. Chakrabarty, “Highly Selective Colorimetric Fluorescent Sensor for Pb2+,” Eur. J.
Org. Chem., vol. 2010, no. 20, pp. 3791–3795, Jul. 2010.
[17] B. Valeur and M. N. Berberan-Santos, Molecular Fluorescence: Principles and Applications. John Wiley & Sons, 2012.
[18] B. Valeur and I. Leray, “Design principles of fluorescent molecular sensors for cation recognition,”
Coord. Chem. Rev., vol. 205, no. 1, pp. 3–40, août 2000.
[19] Z. Liu, W. He, and Z. G)uo, “Metal coordination in photoluminescent sensing,” Chem. Soc. Rev., vol. 42, no. 4, pp. 1568–1600, Jan. 2013.
[20] A. P. de Silva et al., “Signaling Recognition Events with Fluorescent Sensors and Switches,” Chem. Rev., vol. 97, no. 5, pp. 1515–1566, Aug. 1997.
[21] E. J. Jun, K. M. K. Swamy, H. Bang, S.-J. Kim, and J. Yoon, “Anthracene derivatives bearing thiourea group as fluoride selective fluorescent and colorimetric chemosensors,” Tetrahedron Lett., vol. 47, no. 18, pp. 3103–3106, May 2006.
[22] T. Anand, G). Sivaraman, A. Mahesh, and D. Chellappa, “Aminoquinoline based highly sensitive fluorescent sensor for lead(II) and aluminum(III) and its application in live cell imaging,” Anal. Chim.
Acta, vol. 853, pp. 596–601, Jan. 2015.
[23] M. Chalal, D. Vervandier-Fasseur, P. Meunier, H. Cattey, and J.-C. Hierso, “Syntheses of
polyfunctionalized resveratrol derivatives using Wittig and Heck protocols,” Tetrahedron, vol. 68, no. 20, pp. 3899–3907, May 2012.
[24] M. Laatikainen et al., “Complexation of Nickel with 2-(Aminomethyl)pyridine at High Zinc
Concentrations or in a Nonaqueous Solvent Mixture,” J. Chem. Eng. Data, vol. 59, no. 7, pp. 2207–2214, Jul. 2014.
[25] P. G)ans, A. Sabatini, and A. Vacca, “SUPERQUAD: an improved general program for computation of formation constants from potentiometric data,” J. Chem. Soc. Dalton Trans., vol. 0, no. 6, pp. 1195–1200, 1985.
[26] R. G). Zepp, W. M. Sheldon, and M. A. Moran, “Dissolved organic fluorophores in southeastern US coastal waters: correction method for eliminating Rayleigh and Raman scattering peaks in excitation– emission matrices,” Mar. Chem., vol. 89, no. 1, pp. 15–36, Oct. 2004.
[27] R. Bro, “PARAFAC. Tutorial and applications,” Chemom. Intell. Lab. Syst., vol. 38, no. 2, pp. 149–171, Oct. 1997.
[28] Stedmon Colin A. and Markager Stiig, “Resolving the variability in dissolved organic matter fluorescence in a temperate estuary and its catchment using PARAFAC analysis,” Limnol. Oceanogr., vol. 50, no. 2, pp. 686–697, Mar. 2005.
[29] Bro Rasmus and Kiers Henk A. L., “A new efficient method for determining the number of components in PARAFAC models,” J. Chemom., vol. 17, no. 5, pp. 274–286, Jun. 2003.
[30] S. Mounier, H. Zhao, C. G)arnier, and R. Redon, “Copper complexing properties of dissolved organic matter: PARAFAC treatment of fluorescence quenching,” Biogeochemistry, vol. 106, no. 1, pp. 107–116, Oct. 2011.
[31] N. O. Mahmoodi, S. Mirkhaef, and A. G)havidast, “Synthesis of anthracene derivatives of 1,3-diazabicyclo[3.1.0]hex-3-ene,” J. Mol. Struct., vol. 1081, pp. 248–253, février 2015.
[32] M. Yu, F. He, Y. Tang, S. Wang, Y. Li, and D. Zhu, “Non-Ionic Water-Soluble Crown-Ether-Substituted Polyfluorene as Fluorescent Probe for Lead Ion Assays,” Macromol. Rapid Commun., vol. 28, no. 12, pp. 1333–1338, Jun. 2007.
[33] K. Varazo, F. Xie, D. G)ulledge, and Q. Wang, “Synthesis of triazolyl anthracene as a selective fluorescent chemosensor for the Cu(II) ion,” Tetrahedron Lett., vol. 49, no. 36, pp. 5293–5296, Sep. 2008.
[34] Y.-I. Lin, S. A. Lang, C. M. Seifert, R. G). Child, G). O. Morton, and P. F. Fabio, “Aldehyde Syntheses. Study of the preparation of 9,10-anthracenedicarboxaldehyde,” J. Org. Chem., vol. 44, no. 25, pp. 4701– 4703, décembre 1979.
[35] D. K. Ryan and J. H. Weber, “Fluorescence quenching titration for determination of complexing capacities and stability constants of fulvic acid,” 01-May-2002. [Online]. Available:
![Fig. 2. Metal and ligand species distribution calculated from UV-vis spectra using HypSpec program[25] for lead and a) ANQ-MMA or b) ANQ-ST](https://thumb-eu.123doks.com/thumbv2/123doknet/13746829.437452/15.892.114.768.105.408/metal-ligand-species-distribution-calculated-spectra-hypspec-program.webp)