HAL Id: cirad-00193590
http://hal.cirad.fr/cirad-00193590
Submitted on 4 Dec 2007HAL is a multi-disciplinary open access archive for the deposit and dissemination of sci-entific research documents, whether they are pub-lished or not. The documents may come from teaching and research institutions in France or abroad, or from public or private research centers.
L’archive ouverte pluridisciplinaire HAL, est destinée au dépôt et à la diffusion de documents scientifiques de niveau recherche, publiés ou non, émanant des établissements d’enseignement et de recherche français ou étrangers, des laboratoires publics ou privés.
Production structure and Cost efficiency of irrigated
agriculture: A shadow cost approach
L. Zaibet, Mohamed Salah Bachta, H. Ben Salem
To cite this version:
L. Zaibet, Mohamed Salah Bachta, H. Ben Salem. Production structure and Cost efficiency of irrigated agriculture: A shadow cost approach. Les instruments économiques et la modernisation des périmètres irrigués, 2005, Kairouan, Tunisia. 12 p. �cirad-00193590�
Actes du séminaire Euro Méditerranéen
« Les instruments économiques et la modernisation des périmètres irrigués », M.S. Bachta (éd. sci.) Séance 3. Analyse de l’offre d’eau et choix technologiques
21-22 novembre 2005, Sousse, Tunisie.
Production structure and Cost efficiency of irrigated agriculture:
A shadow cost approach
L. Zaibet1, M.S. Bachta2, H. Ben Salem1
1
Ecole Supérieure d’Agriculture, Mograne, Tunisie
Lzaibet@yahoo.fr
2
Institut National Agronomique de Tunisis, Tunisie
Summary
The improvement of irrigated agriculture needs sound performance assessment based on economic principles. This is particularly relevant to design adequate policies in terms of water allocation. In this paper we endeavour to assess irrigation efficiency using a behavioural approach in which the cost function (shadow cost) is based on shadow prices of inputs. This approach is useful to derive price distortion coefficients to indicate the level of allocative efficiency in two irrigated areas: Jendouba and Kairouan, in Tunisia. Results show that in the case of Jendouba price ratio shows an even distribution around one with 50% of farmers having values below one and 50% greater than one. In the case of Kairouan the same distribution is observed except that the magnitude of the distortion is greater (values around Two). This shows that inefficiencies are greater in Kairouan than in Jendouba. Such difference is explained by the prevalence of irrigation tradition which is older in Jendouba than in Kairouan.
Key words: water allocation, efficiency, shadow cost, Tunisia
1 Introduction
Irrigation water has become increasingly scarce for agriculture. Past policies have been inclined to the development of water supplies to meet increasing demand for food. This has been accompanied by heavy costs to develop adequate irrigation infrastructure as well as important subsidies to encourage farmers to efficiently use irrigation water. These “water- supply» policies were not sufficient to guide efficient use of water in the absence of market oriented management policies. Nowadays it is recognized the need for performance assessment based on sound economic principles to design adequate policies in terms of water allocation. Institutions such as users’ irrigation associations were initiated to ensure better use and management of water. These institutions in turn are suffering from inherent agency costs and arising transaction costs that are inhibiting their role to enhance better performance of irrigation water use.
Improving the performance of irrigation water use is achieved by better management and higher efficiency. In the literature, irrigation water efficiency has been defined on the basis of engineering concepts. Economists have been devoted to improving water use efficiency by assessing allocative or cost efficiency (Karagiannis et al., 2003 ; Omezzine and Zaibet, 1998). The latter concepts are related to market prices and look into optimal allocation of resources based on changing economic conditions. In this context the production structure (allowing for the possibilities of substitution among factors) and cost efficiency are useful tools to assess the performance of farmers.
In this paper we use a behavioural approach in which the cost function (shadow cost) is estimated based on shadow prices of inputs to derive farm specific indicators of allocative inefficiency. This research builds on models developed in Parikh et al. (1995), Reinhard and Thijsssen (2000), and Getachew and Sickles (2003). Factors that are presumed to affect the level of allocative efficiency are to be incorporated to explain the inefficiency error term. These variables include adoption of irrigation technology and irrigation management as well as other farm and farmers’ characteristics. We intend to derive useful information on the level of cost efficiency achieved by farmers as well as the economic behaviour in terms of the ability of farmers to react to changes in the economic conditions.
2 Economic efficiency measures
Let the technology relationship be represented by a cost function based on the composed error model (Aiger, Knox-Lovell, and schmidt):
ln C =
α
0+
α
Y+
ln
y
+
∑
α
iln
ω
i +γ
YY( )
y
+
∑∑
γ
ijln
ω
iln
ω
j2
1
²
ln
2
1
+∑
γ
Yiln
y
ln
ω
i +γ
Lln
L
+γ
LL(
ln
L
)
²
+
∑
γ
Liln
L
ln
ω
i2
1
+γ
LQln
L
ln
y
+
ε
i (1) And iε
= vi + ui C: total costY: total value of output wi : variable input i price
L: land (area) to account for returns to scale
The error term is composed into two independent elements where:
vi : account for random variation in cost due to factors outside the farmer’s control (crop
disease, whether, etc.), ui: reflects cost inefficiency
Measurement of farm level inefficiency requires first the estimation of the error term U which requires the decomposition of
ε
into its two individual components: U and V. Following Jondrow et al. (1982), the conditional mean of U givenε
is as follows:E
[
u
/
ε
]
= ⎥ ⎥ ⎥ ⎥ ⎦ ⎤ ⎢ ⎢ ⎢ ⎢ ⎣ ⎡ − ⎟ ⎠ ⎞ ⎜ ⎝ ⎛ Φ − ⎟ ⎠ ⎞ ⎜ ⎝ ⎛ σ ελ σ ελ σ ελ φ σ σ σ µ υ 1 (2) Where V U σ σ λ = And σ²=σ²U+σ²V =φ Standard normal density function (PDF) =
Φ Standard normal distribution function (CDF)
Determinants of cost inefficiency could be related to the nature of farming as well as socioeconomic and environmental factors:
- When farming is characterized by subsistence crops, farmers may be prevented from reaching the efficiency frontier. The reason is that scarce resources are allocated based on their marginal shadow values instead of the marginal value productivities. Therefore, inefficiency may arise from these differences.
- Non physical inputs such as experience, information and supervision might influence the ability of producer to use the available technology efficiently.
- There are other factors that influence farmer’s efficiency such as land (farm) size, land tenure, credit availability, extension and education.
- We are also particularly interested in irrigation management and technology, and related factor to explain inefficiency.
In a two step procedure, cost inefficiency is regressed on the various explanatory variables that were identified:
C Ii = f(Zi) (3)
Where Zi= variables assumed to explain the level of inefficiency at each farm.
3 Allocative efficiency: A shadow cost approach
In current farming systems, the quantity of inputs used in particular water, is likely to differ from the cost-minimizing level of inputs and therefore shadow prices may deviate from market price, as suggested by Reinhard and Thijessen, (2000). In these situations, a shadow cost system is more adequate to reflect farm behavior instead of a standard cost system.
A firm efficiency is decomposed into technical efficiency and allocative efficiency. A firm could be inefficient either by obtaining less than the maximum output available from a determined group of inputs (technically inefficient) or by not using the best package of inputs given their pieces and marginal productivities (allocative inefficient) (Murillo-Zamorano, 2004 ; Kumbhakar et al., 1989).
Using duality theory, the technology could be represented by the following (translog) cost system:
∑
+
+
=
Yy
i iC
α
α
α
ln
ω
2
1
ln
ln
0( )
+
∑∑
+
γ
yyy
γ
ijln
ω
iω
j2
1
²
ln
2
1
∑
+
+
γ
yiln
y
ln
ω
iε
C And∑
≠+
+
+
=
i j c j ij yi i iy
S
α
γ
ln
γ
ln
ω
ξ
∑
S
i= 1
In a context where allocative inefficiency exists and the production function is homothetic,
c
ε
will represent the cost of both technical and allocative efficiency whereas ξc will representpurely allocative efficiency.
Assuming the most general case, a cost system that accounts for cost inefficiency could be written as (Murillo-Zamorano, 2004):
( )
ω
+
+
+
ν
=
C
y
T
A
C
ln
,
ln
ln
ln
(
)
c i iS
y
S
=
,
ω
+
ε
∑
Si = 1Where lnT represent the increase in cost due to technical inefficiency, lnA the increase in cost due to allocative inefficiency, ν is a statistical noise, and
ε
c is the disturbance on the inputshares equation which is a mix of allocative and technical inefficiency and noise.
The shadow cost approach assumes that farms minimize shadow costs instead of actual cost. The standard neoclassical approach assuming minimum cost subject to an output constraint yields the first order conditions (FOC) as follows:
j i j i w
f
f
w
=
The FOC indicate that. the ratio of marginal rate of technical substitution is equal to the ratio of market prices for any two factors.
Assuming however other constraints in the environment are added so that deviations in allocating inputs are introduced. In this case the above FOC becomes:
j w i w j i
f
f
* *=
4Where w* represent shadow or effective prices with a deviation from actual prices captured by price distortionθ. (w*=θw).
The shadow cost being function of w* instead of w, it could be proven using the duality theory (Shepard lemma) that the actual cost CA be defined in terms of the shadow cost C* as follows:
(
,
,
)
,
* * * *∑
=
j j j RS
q
y
C
C
θ
ω
wherew*: a vector of shadow prices q : a vector of fixed inputs S* : the shadow cost share
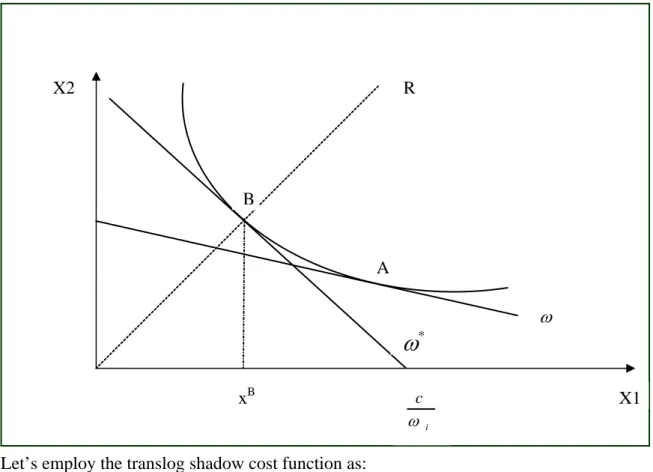
Figure 1 shows that farm B is technically efficient, but not allocatively efficient because the ratio of inputs is optimal for shadow prices
( )
ω* but not for actual prices( )
ω .Figure 1. Deviation of shadow prices from actual prices.
5 X2 R B A ω *
ω
xB X1 i c ω Let’s employ the translog shadow cost function as:∑
+
∑∑
+
=
j l li ji jl ji j iC
* 0 *ln
*ln
*2
1
ln
ln
α
α
ω
α
ω
ω
( )
+
∑
+
+
j ji i yj i yy i yy
Y
y
*ln
ln
²
ln
2
1
ln
β
α
ω
β
+∑
+
∑∑
n mi ni nm ni nq
ln
q
ln
q
2
1
ln
γ
γ
∑∑
+
∑
+
n j n i ni ny ji ni njln
q
ln
ln
q
ln
y
*β
ω
α
Where: * iω
: the vector of shadow prices of the variable inputs (water, intermediate inputs), iy
: the output (value)i
q
: a vector of (quasi) fixed inputs (labor, capital) The actual cost CR will be as follows:(
)
⎟⎟
⎠
⎞
⎜⎜
⎝
⎛
+
=
∑
− j ji ji i R iC
y
q
S
c
ln
* *,
,
ln
* 1ln
ω
θ
i.e. θ i A i R iC
C
C
ln
ln
ln
=
+
and the cost share equations:
6 A
C
is the cost-efficiency costsA
C
w
X
S
iA=
i i/
θC
is the increase in cost due to allocative inefficiency.Price distortion coefficient θ could be modeled as a function of a set of variables that are assumed to explain price deviations.
4 Estimation procedure
A well behaved cost function should satisfy the homogeneity condition in factor prices. So we imposed the homogeneity condition as well as the usual symmetry conditions. Because the translog cost function has a large number of parameters then we need to estimate the cost function jointly with the cost share equation
( )
S
*j . This is suggested also because of the fact that the translog cost function is only an approximation of the true functional from so that avalid analysis requires estimation of the cost function equation along the share equations. However, the cost shares sum to unity which requires that one cost share equation be omitted. Such condition imposed also that only relative price efficiency measures are identified.
The LSQ (non linear least squares) procedure using TSP was used to estimate the cost system (the cost function along the input share equations). We also imposed the homogeneity and homotheticity restrictions on the parameters. The cost inefficiency parameters (θ i) are included and are assumed to be a linear function of explanatory variables:
- Family labor vs hired labor - Transfers / off-farm income (OFI) - Farmer’ age (AGE)
- Education and or experience (EDU) - Distance to market
- Institutional factors (such as the case where a farmer belongs to a farmers’ association) - Subsistence needs vs market oriented
- Technical variables such as irrigation system (IS) and water supply or source (WS) We tried these variables but only few variables were retained in the estimation because of the large number of parameters. Different specifications are used in the literature (exponential, linear or quadratic): in this study a linear function is estimated:
OFI
WS
IS
EDU
Age
i j i j i j i j j j jiε
0ε
1ε
2ε
3ε
4ε
5θ
=
+
+
+
+
+
We estimated first a restricted model (assuming θ = 1) using a cost frontier and then we used the parameters as starting values in the shadow cost system.
The data were collected over a cross section sample survey administered to 22 and 37 farmers respectively in Kairouan and Jendouba. A full description of the questionnaire and data construction is found in Bachta and Talbi (2005) and Boumediene (2005). As indicated above we estimated a short run cost function where labor (L) and capital (K) are held quasi-fixed for the period of study. We used an aggregated measure of output value since prices do not vary over farms. Water (w) and variable intermediate inputs’ prices were derived from the survey on the basis of total expenses on these inputs.
Table 1. Parameter Estimation of the cost system (restricted vs unrestricted) in the case of Kairouan
Parameter / variable Restricted model Unrestricted model A (intercept) .94 * 2.91* B1 : L .35 * .30 * B2 : K .33 * .77 * B3 : w -.069 * -.63 * B11: LL .010 * .057 * B22: KK .025 * .116 * B33: WW -00.84 -.042* 7
B12: LK .014 * -.015* B13: LW .018 * .526043E-03 B23: KW .041 * .013750 * C0: Y .238 * -.159278 CC: YY .0048 * .113447 * C1: YL -.002 -.052780 * C2: YK .039 * -.135121 * C3: YW .018 * .228678 * L1 (constant term) 1.53997 * L2 (education) .537257E-02 L3 (irrigation system) .265676 * L4 (age) .848645E-02* L5 (water supply) -.073389 * L6 (off farm income) -.121293E-04* Log likelihood 419.7 411.871 Convergence Achieved
(N° Iterations)
282 71
Table 2. Parameters Estimation of the cost system (restricted vs unrestricted) in the case of Jendouba.
Parameter / variable Restricted model Unrestricted model A (intercept) -2.92* -.81 B1 : L 1.27* .22* B2 : K 1.46* 1.27* B3 : w -0.18* -.21* B11: LL 0.02* .062* B22: KK 0.11* .10* B33: WW 0.81 .014* B12: LK -0.12* -.01* B13: LW 0.04* -.029* B23: KW 0.01* .077* C0: Y 1.29* 1.24* CC: YY -0.03* -.053* C1: YL -0.05* -.091* C2: YK -0.09* -.02* C3: YW 0.03* .045* L1 (constant term) .94* L2 (education) -.06* L3 (irrigation system) -.30* 8
L4 (age) .006* L5 (water supply) -.103* L6 (off farm income) .000016* Log likelihood 229.011 253.552 Convergence Achieved
(N° Iterations)
618 720
5. Interpretation and conclusions
Estimation results are shown in Tables 1 and 2 respectively in the case of irrigated areas in Kairouan and Jendouba which are the two areas selected for this study. Most parameters are significantly different from zero at the 5% level. Convergence is achieved for all models (restricted and non restricted). It also appears that parameter estimates in the non restricted model are indeed different from those issued from the restricted model.
The resulting price distortion coefficient is a measure of relative price efficiency. If θ = 1 for input j then farmer is price-efficient in input use, while ifθ ≠1 there exist price inefficiencies. Implications of price distortions could be interpreted in the following manner (which could be established on Figure 1):
- θ < 1 indicates the existence of relative price inefficiencies and overuse of the resource; - θ > 1 means the existence of price distortions engendered by relative price inefficiencies and resources are under-utilized;
Since price ratio = MRS between any two pairs of inputs, θ ≠1 indicates MRS exceeds the market price ration which could reveal the distortionary impact of factor pricing.
Figure 2. Cost inefficiency parameter in the case of Jendouba.
0 1 2 3 4 5 6 7 8 0,8-0,9 0,91-0,99 1-1,2 1,2-1,34 Fr e q u e nc e 9
Figure 3. Price distortion coefficient for water in the case of Jendouba. 0 0,2 0,4 0,6 0,8 1 1,2 1,4 1,6 1 2 3 4 5 6 7 8 9 10 11 12 13 14 15 16 17 18 19 20 farmers k
Figure 4. Price distortion coefficient in the case of Kairouan.
0 2 4 6 8 10 12 14 1,7-1,8 1,8-1,9 1,9-2 2-2,1 2,1-2,8 Fr e q 10
Figure 5. Price distortion coefficient in the case of Kairouan. 0 0,5 1 1,5 2 2,5 3 3,5 1 3 5 7 9 11 13 15 17 19 21 23 25 27 29 31 33 35
Price distortion coefficients were evaluated based on the parameter estimates from the non restricted model. In the case of Jendouba this parameter shows an even distribution around one with 50% of farmers having values below one and 50% greater than one. In the case of Kairouan the same distribution but the magnitude of the distortion is greater (values around Two). This shows that inefficiencies are greater in Kairouan than in Jendouba. Such difference could be due to irrigation tradition which is older in Jendouba than in Kairouan. Factors presumed to explain such price distortion are presented in Tables 1 and 2. it appears that the off farm income and the source of water (private vs public) are significant factors in reducing the level of inefficiency in Kairouan, while education and irrigation technology are the significant factors in the case of Jendouba.
Figure 6. Cost efficiency on the basis of the cost frontier.
Cost efficiency 0 2 4 6 8 10 12 0,55-0,6 0,61-0,66 0,67-0,7 0,7-0,79 0,8-0,94 Eff Fre q 11
These results suggest that education and off-farm income along with the adoption of irrigation technology and private sources of water are significant factors that could contribute to improve the level of allocative efficiency observed in the case of irrigation water. These preliminary results would enlighten policy makers to foster policies oriented toward water management. Further research however is needed to improve the above estimation results by introducing technical efficiency measures in the cost shadow estimation procedure as well as deriving specific allocative efficiency measures for each farmer.
References
Bachta M.S., Talbi B., 2005. Productivités et allocation des facteurs en agriculture irriguée et pluviale en Tunisie: une comparaison. Séminaire Euro-méditerranéen sur la modernisation de l’agriculture irriguée: instruments économiques. 21-24 Novembre 2005, Sousse-Tunisie. Boumediene J., 2005. Activité agricole irriguée et revenu des exploitations. Séminaire Euro- Méditerranéen sur la modernisation de l’agriculture irriguée: instruments économiques. 21-24 Novembre 2005, Sousse-Tunisie.
Getachew and Sickles. 2003. The regulatory environment, relative price efficiency and the Egyptian private manufacturing sector: 1987/88-1995/96. DEPRA, USAID/Egypt.
Jondrow J., Lovell C.A.K., Materov I., Schmidt P., 1982. On the estimation of technical inefficiency in the stochastic production function model. Journal of Econometrics, 19: 233-238.
Karagiannis G., Tzouvelekas V., Xepapadeas A., 2003. Measuring irrigation water efficiency with a stochastic production frontier. Environmental and resource economics, 26: 57-72.
Kumbhakar S.C., Ghosh S., McGuckin J.T., 1989. A generalized production frontier approach for estimating determinants of inefficiency in U.S. dairy farms, Journal of business and economic statistics, 9:279-286.
Murillo-Zamorano L., 2004. Economic efficiency and frontier techniques, Journal of economic surveys, 18: 33-45.
Omezzine A., Zaibet L., 1998. Management of modern irrigation systems in Oman: allocative vs. irrigation efficiency. Agricultural water management, 37: 99-107.
Parikh A., Ali F., Mir Shah K., 1995. Measurement of economic efficiency in Pakistan agriculture. American Journal of agricultural economics, 77: 675-685.
Reinhard S., Thijssen G., 2000. Nitrogen efficiency of Dutch farms: a shadow cost system approach. European Review of Agricultural Economics, 27: 167-186.