HAL Id: hal-01892439
https://hal.umontpellier.fr/hal-01892439
Submitted on 10 Oct 2018
HAL is a multi-disciplinary open access
archive for the deposit and dissemination of
sci-entific research documents, whether they are
pub-lished or not. The documents may come from
teaching and research institutions in France or
abroad, or from public or private research centers.
L’archive ouverte pluridisciplinaire HAL, est
destinée au dépôt et à la diffusion de documents
scientifiques de niveau recherche, publiés ou non,
émanant des établissements d’enseignement et de
recherche français ou étrangers, des laboratoires
publics ou privés.
Aedes aegypti in its ancestral range, Africa
Panayiota Kotsakiozi, Benjamin Evans, Andrea Gloria-Soria, Basile Kamgang,
Martin Mayanja, Julius Lutwama, Gilbert Le Goff, Diego Ayala, Christophe
Paupy, Athanase Badolo, et al.
To cite this version:
Panayiota Kotsakiozi, Benjamin Evans, Andrea Gloria-Soria, Basile Kamgang, Martin Mayanja, et
al.. Population structure of a vector of human diseases: Aedes aegypti in its ancestral range, Africa.
Ecology and Evolution, Wiley Open Access, 2018, 8 (16), pp.7835-7848. �10.1002/ece3.4278�.
�hal-01892439�
Ecology and Evolution. 2018;8:7835–7848. www.ecolevol.org
|
7835 Received: 29 May 2017|
Revised: 22 May 2018|
Accepted: 29 May 2018DOI: 10.1002/ece3.4278
O R I G I N A L R E S E A R C H
Population structure of a vector of human diseases: Aedes
aegypti in its ancestral range, Africa
Panayiota Kotsakiozi
1| Benjamin R. Evans
1| Andrea Gloria-Soria
1|
Basile Kamgang
2| Martin Mayanja
3| Julius Lutwama
3| Gilbert Le Goff
4,5|
Diego Ayala
4,6| Christophe Paupy
4| Athanase Badolo
7| Joao Pinto
8|
Carla A. Sousa
8| Arlete D. Troco
9| Jeffrey R. Powell
1This is an open access article under the terms of the Creative Commons Attribution License, which permits use, distribution and reproduction in any medium, provided the original work is properly cited.
© 2018 The Authors. Ecology and Evolution published by John Wiley & Sons Ltd. Data archival location: VectorBase project ID VBP0000295 1Yale University, New Haven, Connecticut 2Centre for Research in Infectious Diseases, P.O. Box 13591, Yaoundé, Cameroon 3Uganda Virus Research Institute, Entebbe, Uganda 4MIVEGEC Laboratory (UMR IRD 224-5290 CNRS-UM), Institut de Recherche pour le développement (IRD), Montpellier, France 5IRD La Réunion-GIP CYROI, La Réunion, France 6Centre International de Recherches Médicales de Franceville (CIRMF), Franceville, Gabon 7Laboratoire d’Entomologie Fondamentale et Appliquée, Université Ouaga 1 Pr Joseph KI-ZERBO, 03 BP 7021, Ouagadougou 03, Burkina Faso 8Global Health and Tropical Medicine, GHTM, Instituto de Higiene e Medicina Tropical, IHMT, Universidade Nova de Lisboa, UNL, Lisbon, Portugal 9Programa Nacional de Controle da Malária, Direcção Nacional de Saúde Pública, Ministério da Saúde, Luanda, Angola Correspondence Jeffrey R Powell, Yale University, New Haven, Connecticut. Email: jeffrey.powell@yale.edu Present Address: Andrea Gloria-Soria, The Connecticut Agricultural Experiment Station, New Haven, Connecticut Funding information National Institute of Allergy and Infectious Diseases, Grant/Award Number: RO1 AI101112
Abstract
Aedes aegypti, the major vector of dengue, yellow fever, chikungunya, and Zika vi-ruses, remains of great medical and public health concern. There is little doubt that the ancestral home of the species is Africa. This mosquito invaded the New World 400- 500 years ago and later, Asia. However, little is known about the genetic struc-ture and history of Ae. aegypti across Africa, as well as the possible origin(s) of the New World invasion. Here, we use ~17,000 genome-wide single nucleotide polymor-phisms (SNPs) to characterize a heretofore undocumented complex picture of this mosquito across its ancestral range in Africa. We find signatures of human- assisted migrations, connectivity across long distances in sylvan populations, and of local ad-mixture between domestic and sylvan populations. Finally, through a phylogenetic analysis combined with the genetic structure analyses, we suggest West Africa and especially Angola as the source of the New World’s invasion, a scenario that fits well with the historic record of 16th- century slave trade between Africa and Americas. K E Y W O R D S Aedes aegypti, Africa, genetics, migration, population structure, SNP-chip1 | INTRODUCTION
The mosquito Aedes aegypti is the major vector of diseases such as dengue, chikungunya, yellow fever, and Zika, that have plagued hu- manity for centuries and remain threats to millions of people world-wide. It is an invasive species with patterns of global migration that continue today (Powell, 2016). There is little doubt that the ancestral range of the species is Africa. The ancestral form has been given the subspecies name Ae. aegypti formosus (Aaf), a dark mosquito breeding in tree holes and preferring blood meals from nonhuman wildlife (Lounibos, 1981; Powell & Tabachnick, 2013; Tabachnick, 1991). Aaf can be found today in Africa in its original sylvan habitats (larvae in tree holes and rock holes), as well as in cities and peridomestic habitats (e.g., villages, transient human dwellings, and their surroundings). The paler form, or subspecies Ae. aegypti aegypti (Aaa), is a “domes- tic” mosquito, breeding in human- generated containers and prefer-ring humans for blood meals (McBride et al., 2014). It is this form that during the last 400- 500 years colonized much of the world’s tropics and subtropics with the help of human movement and trade (Powell, 2016; Powell & Tabachnick, 2013), causing some of the largest outbreaks of mosquito- borne diseases, most recently the Zika outbreak (Centers for Disease Control and Prevention 2016).While populations outside Africa (largely conforming to Aaa) have been well- studied and strong genetic structure among and within continents have been documented [e.g., (Bosio et al., 2005; Bracco, Capurro, Lourenço- de- Oliveira, & Sallum, 2007; Brown et al., 2011, 2014; Gloria- Soria et al., 2016; Gonçalves da Silva et al., 2012; Kotsakiozi, Gloria- Soria, Schaffner, Robert, & Powell, 2018; Kotsakiozi, Gloria- Soria et al., 2017; Mousson, Dauga, Garrigues, & Schaffner, 2005; Pless et al., 2017; Rašić et al., 2015; Scarpassa, Cardoza, & Cardoso, 2008)], the ancestral populations in Africa have been understudied. Even Ae. aegypti’s range in Africa is poorly known due to insufficient records of the species (Weetman et al., 2018). Additionally, the types of genetic mark-ers (e.g., allozymes, mtDNA, and microsatellites) used in previous studies have been unable to provide much insight into the genetic structure in this ancestral region although Bennett et al. (2016) did provide genetic resolution using DNA sequences, discussed later in the context of our findings. More specifically, although it seems that there are at least two major genetic clusters of Ae. aegypti formosus in East and West Africa, further resolution has proven difficult with allozymes or microsatellites (Brown et al., 2011; Gloria- Soria et al., 2016; Moore et al., 2013).
Understanding the genetic structure of Ae. aegypti within Africa in high resolution and predicting the invasion dynamics and gene flow among populations can be very informative and helpful to con-trol and predict future outbreaks of diseases they transmit. In Africa alone, more than 800 million people (~70% of the African popula-tion) are at risk for at least one of the diseases transmitted by this species (Weetman et al., 2018). Contrary to the traditional view that African Aaf is less competent for flavivirus transmission than Aaa outside Africa (Bosio, Beaty, & Black, 1998; Tabachnick et al., 1985),
there is increasing evidence that the vector competence of Aaf varies considerably and is population- specific, with some African populations being as competent as those outside Africa (Diallo et al., 2008; Dickson, Sanchez- Vargas, Sylla, Fleming, & Black, 2014; Vazeille et al., 2013).
To address this challenge, we leverage a high- throughput species- specific genotyping single nucleotide polymorphism (SNP) chip (Evans et al., 2015). Dense genomic sampling of SNPs is extremely powerful for high- resolution analysis of historical biogeography and invasion dynamics [e.g., in the study of Aedes species (Brown et al., 2014; Kotsakiozi, Richardson et al., 2017; Rašić, Filipović, Weeks, & Hoffmann, 2014)]. The goals of this work were to (a) study the ge-netic structure of Ae. aegypti populations within Africa, (b) estimate the genetic diversity and differentiation among African populations and compare them with Aaa populations outside of Africa, and (c) identify the possible source(s) of the New World and Asia invasion.
Note on nomenclature: The subspecies designations Aedes ae-gypti formosus and Ae. aeae-gypti aeae-gypti were formally recognized by Mattingly (1957) with the former being a darker colored mosquito in African forests, while the latter are lighter colored with white abdominal scales found in human habitats primarily outside Africa. While generally, collections of Ae. aegypti in Africa correspond to subspecies Ae. aegypti formosus, there are exceptions with some back migration of Aaa to Africa (particularly in East Africa) and mixed populations in West Africa which may represent the initial differen-tiation of Aaa (Crawford et al., 2017). Here, we use Aaf as shorthand to refer to populations in continental Africa and Aaa to refer to pop-ulations outside Africa with the explicit recognition these names are not clear- cut especially in Africa. In Table 1, we designate the ecolog-ical setting where the samples from Africa were taken to explicitly recognize the ecological diversity occupied by this species in Africa.
2 | METHODS
2.1 | Mosquito samples, DNA extraction, and
genotype process
We sampled 20 populations of Aedes aegypti originating from con- tinental Africa and nearby Reunion Island (Figure 1, Table 1) cover-ing a large part of the Aaf distribution. We also used 10 previously studied populations (Gloria- Soria et al., 2018; Kotsakiozi et al., 2018) of Aaa originating from the New World and Asia (Table 1). Aedes mascarensis from the island of Mauritius was used as an out-group; this species is very closely related to Ae. aegypti being able to form viable hybrids (Hartberg & Craig, 1970), but genetically distinct (Brown et al., 2014). Samples were either larvae preserved in 70%–90% ethanol, collected from multiple breeding sites per sampling locality, or eggs collected from multiple ovitraps set up at various locations. Eggs were reared to larvae or adults in standard laboratory conditions. DNA was extracted with Qiagen DNeasy blood/tissue kit using the standard kit protocol with an additional step of adding 4ul of RNAase A to each sample. Approximately 200 ng of genomic DNA from individual mosquitoes were placed in
95 wells of a 96- well plate, with one distilled water control. Plates were sent to the Functional Genomics Core at the University of North Carolina, Chapel Hill, for hybridization. Data files sent to Yale University were processed with the Axiom Analysis Suite v.3.1. (Affymetrix, Santa Clara, CA) to call the genotypes. We genotyped 7- 14 individuals per population (Table 1) to avoid large differences in sampling size between populations that can ob-scure the subsequent genetic structure analyses [for details on the effect of uneven sample size on genetic structure analyses, see (Puechmaille, 2016; Wang, 2017)]. This sample size is con-sidered adequate for the purposes of the study, given the large
number of SNPs assayed, the very low percentage of missing data (Evans et al., 2015), and the expected differentiation among popu-lations (Gloria- Soria et al., 2016) estimated from previous studies [for details on the sampling size discussion and examples of using similar sampling size, see (Brown et al., 2014; Nazareno, Bemmels, Dick, & Lohmann, 2017; Patterson, Price, & Reich, 2006; Puckett et al., 2016)]. Here, we report results on a total, 315 mosquitoes (208 Aaf, 104 Aaa, and four Ae. mascarensis) genotyped using the Axiom_aegypti1 genotyping array (Evans et al., 2015). A total of 27,674 loci were included in the Axiom_aegypti1 SNP- Chip (over-all genotyping rate 97.1%) unambiguously genotyped on the chip
TA B L E 1 Population information for the Aedes aegypti samples used in this study
Continent Region Country/island Locality (abbreviation) Type Samples SNPs latitude longitude
Africa West Africa Angola Luanda (Ang) Domestic 12 16,906 −9.76667 14.26667
Burkina Faso Burkina Faso (BF) Domestic 12 16,855 12.2383 −1.5616
Cameroon Yaounde Mokolo (YAOMO) Domestic 7 16,845 3.87275 11.5012 Cameroon Yaounde MvogAda (YAOMV) Domestic 8 16,804 3.86275 11.5259
Cameroon Yaounde Center (CAM) Domestic 12 16,877 3.866667 11.5167
Cameroon Yaounde Forest (YAOF) Sylvan 8 16,758 3.87601 11.3761
Cameroon Yaounde Village (YAOV) Peridomestic 8 16,795 3.86076 11.3937
Cameroon Buffalo camp (CamD) Peridomestic 10 16,853 8.371057 13.866
Gabon Franceville (GB) Domestic 12 16,797 −1.63324 13.583
Gabon Lope Forest (GB_F) Sylvan 12 16,801 −0.37896 11.5274
Gabon Lope Village (GB_V) Peridomestic 12 16,701 −0.37896 11.5274
Senegal Sedhiou (Sedh) Peridomestic 12 16,866 14.183 −12.717
Senegal Goudiry (Goud) Peridomestic 12 16,903 12.707 −15.5552
East Africa South Africa Johannesburg (AFS) Domestic 9 16,777 27.9006 −25.9904
Uganda Lunyo (Lun) Peridomestic 12 16,859 0.3267 33.8936
Uganda Zika village (ZIKA) Peridomestic 14 16,811 0.12745 32.5313
Kenya Kaya Forest (KEN) Sylvan 8 16,861 −3.93194 39.5961
Kenya Kahawa Sukari (KS) Peridomestic 8 16,874 −1.19451 36.9456
Kenya Nairobi (NBO) Domestic 8 16,702 −1.2833 36.8167
Reunion island Reunion Island (RI) Domestic 12 14,499 −20.1818 57.5171
Mauritius island Aedes mascarensis (Masc) Outgroup 4 13,286 −20.1668 57.5147
Asia Australia Cairns (Cairns) Aaa 12 16,990 −16.817 145.686
Georgia Georgia (Georgia) Aaa 10 16,927 41.9614 43.3624
Philippines Philippines (BBG) Aaa 8 17,005 10.2833 123.947
Tahiti Tahiti (FP) Aaa 12 17,000 −17.531 −149.56
Vietnam Ho Chi Minh (HCM) Aaa 12 16,976 10.8032 106.695
New World Brazil Macapà (AJM) Aaa 12 16,935 0.03542 −51.071
Caribbean Dominica (Dom) Aaa 12 16,938 15.59166 −61.4111
Colombia Cali (Cali) Aaa 12 17,012 3.43894 −76.516
Siquirres Costa Rica (CR) Aaa 6 16,394 9.93848 −84.095
Mexico Chetumal (CheDC) lab
strain Aaa 8 16,997
Note. For each population, the sampling locality (with abbreviation), the ecological setting where sampled, the number of mosquitoes analyzed, the average number of SNPs obtained, and location in latitude/longitude for the samples are presented.
and passed the tests for conformance to being inherited as single- copy Mendelian variants (Evans et al., 2015).
2.2 | Genetic structure analyses
From the 27,674 validated loci available on the Ae. aegypti SNP- chip, a subset of 20,117 were variable in our dataset of 315 samples (hereafter referred to as broad dataset) including both Aaf and Aaa samples (as well as Ae. mascarensis). We further filtered this dataset eliminating highly linked loci using the—indep option (SNP window size = 500, window shift size = 50, variance inflation factor = 2) of plink (Purcell et al., 2007), so the final filtered dataset consisted of 17,069 SNPs. This allows us to use analytical procedures that as-sume independence across loci. The average percentage of missing data per sample in this dataset was 2%, and details on the average number of SNPs used per population are provided in Table 1. Population genetic structure was evaluated using the Bayesian clustering method implemented in the software fastSTRUCTURE (Raj, Stephens, & Pritchard, 2014). We performed 10 independent runs, and the results were summarized and plotted using the online version of CLUMPAK (Kopelman, Mayzel, Jakobsson, Rosenberg, & Mayrose, 2015).
To complement the genetic structure analysis, we performed principal component analysis (PCA) and discriminant analysis of principal components (DAPC), using the R packages LEA (Frichot & Francois, 2015) and ADEGENET (Jombart, 2008), respectively, in R v.3.4.4 (R Core Team 2018). In DAPC analysis, the raw data is first transformed through a PCA and then a discriminant analysis (DA) is performed on the retained principal components (PCs). Thus, DAPC analysis can provide an efficient description of the genetic clusters present in the dataset using a few synthetic variables (discriminant functions). These variables are linear combinations of the original variables (raw data) that maximize the between- group variance and minimize the within- group variance.
2.3 | Genetic diversity and differentiation
Pairwise genetic distances (Fst) between all pairs of popula- tions and their significance (significance level of 0.05) were calcu-lated in Arlequin v3.5.2.2 (Chapuis & Estoup, 2007), using 1,000 permutations. The partitioning of the genomic variation among and within popu- lations was evaluated through a hierarchical analysis of molecular vari-ance, AMOVA (Excoffier, Smouse, & Quattro, 1992), as implemented in Arlequin v.3.5.2.2, using 1,000 permutations. For this analysis, we excluded Ae. mascarensis because it is used as outgroup and Reunion samples because of high differentiation (see Results section). The par- titioning of the genomic variation was evaluated in the following lev-els: 1) Africa/outside Africa, 2) West Africa/East Africa, 3) domestic/ peridomestic/sylvan populations, and 4) between the African coun-tries. Details on the grouping for the AMOVA analyses are provided in Table 1. F I G U R E 1 Locations of Ae. aegypti sampled from mainland Africa and Reunion Island. Two of the sampling localities, Yaounde and Lope, include 5 and 2 sampling sites, respectively. The multiple sampling points in these localities are less than 3 km apart. The blue sampling site represents Ae. mascarensis used as outgroup
2.4 | Isolation by distance
To assess the significance of correlation between geographic (Euclidean distance) and genetic distance matrices, for all the African populations, we performed a Mantel test with 999 permutations using the “ade4” package in R v.3.4.4 (R Core Team 2018).
2.5 | Phylogenetic relationships
To infer the evolutionary relationships among the populations, we used a maximum likelihood (ML) analysis, as implemented in RaxML (Stamatakis, 2014), using 1,000 bootstraps and the GTR model of evo-lution along with the CAT model of rate heterogeneity. For the runs, we used the string “ASC” to apply an ascertainment bias correction to
F I G U R E 2 STRUCTURE bar plots for all Ae. aegypti populations and Ae. mascarensis. Population names are reported on the x- axis. The
y- axis reports the probability of each individual (Q- value) assigned to one of the genetic groups identified by fastSTRUCTURE, which are represented by different colors. Each bar represents an individual. Individuals with 100% assignment to one group are identified by a single color. Individuals with mixed ancestry are represented by bars with different percentages of colors. The thick black lines within the plots indicate population limits. Abbreviations: SA: South Africa, BF: Burkina Faso, ANG: Angola, masc: Ae. mascarensis F I G U R E 3 STRUCTURE bar plots for all African Ae. aegypti populations. Population names are reported on the x- axis. For details, see legend of Figure2
the likelihood calculations, and the standard correction by Lewis (2001) when only variable sites are included in the dataset. For the phyloge- netic analysis, we excluded SNPs that were identified as outliers (qval-ues < 0.01) using the pcadapt R package (Luu, Bazin, & Blum, 2017), because such SNPs might be under selection. We also randomly sam-pled two individuals per population for each African samples, and we included two Ae. mascarensis individuals as an outgroup and six samples of Aaa outside Africa (two each from South America, North America, Asia) to confirm the distinctiveness of the Aaa lineage from all the African lineages (Bennett et al., 2016; Brown et al., 2014). The final SNP dataset used for the phylogenetic analysis consisted of 12,471 SNPs.
3 | RESULTS
3.1 | Genetic structure analyses
The results of the fastSTRUCTURE analyses on the broad (all sam-ples) and the African dataset are shown in Figure 2 and Figure 3, respectively. The structure analysis on the broad dataset (Figure 2, K = 3) supported that all the African populations used in this study are distinct from all the Aaa populations outside Africa, with only three samples (Goudiry and Sedihou, Senegal and Angola) showing significant admixture. For these three populations, the average Q
F I G U R E 4 Principal components analysis (PCA) on the broad dataset including all the Ae. aegypti populations as well as the Ae. mascarensis
(a) and including only the African populations (b). PCA implemented and plotted in LEA R package, presenting the projection of all individual mosquitoes on the first two PCs. Populations originated from different regions are presented with different colors as shown in the inset
values (for K = 3; Figure 2) toward the Aaa cluster equal to 0.18 for Sedhiou, 0.38 for Goudiry, and 0.60 for Angola. Additionally, Angola is the only population that retains the admixed pattern for K = 8 as well, showing an average Q value of 0.42 toward the New World Aaa cluster (K = 8; orange) and 0.31 toward the South Africa- Kenya clus-ter (K = 8; green).
Interestingly, the Indian Ocean island samples, Reunion and Ae. mascarensis from Mauritius, cluster together. Three additional African populations (Figure 2; K = 3; Johannesburg, Kaya Forest, and Nairobi) seem to be admixed with the Reunion cluster (Q values; 0.44, 0.49, and 0.43 for AFS, KEN, and NBO, respectively).
Focusing on the continental African dataset (Figure 3), it be- comes evident that (a) Uganda, Burkina Faso, and Cameroon pop-ulations cluster together with Gabon being fairly close although distinct at K = 10, (b) Angola forms a separate group, (c) the three populations from Gabon are indistinguishable from each other, (d) South Africa clusters with Nairobi and (e) two popula-tions from Senegal are well differentiated from each other as are
populations from Kenya (three populations form three clusters; K = 10).
Principal component analyses on both datasets confirmed the results obtained from fastSTRUCTURE. Specifically, when using the broad dataset (Figure 4a), the differentiation between Aaa and Aaf is clear as well as the genetic uniqueness of Ae. mascarensis/Reunion populations. The PCA for only continental African samples (Figure 4b) generally mirrors what fastSTRUCTURE revealed (Figure 3). DAPC analysis on the continental African samples (Figure 5) with 11 groups identified by the Bayesian information criterion (BIC) gen- erally coincides with the K = 10 results of the fastSTRUCTURE anal-ysis (Figure 3). In particular, in DAPC, South Africa clusters together with Nairobi (group 2, red) while Angola, Kaya forest, Sedhiou, and Goudiry each form separate groups (groups 3, 9, 8, and 1, re-spectively). Although some of the Gabon samples form a separate group from the remaining Gabon individuals, their clouds overlap (groups 4 and 11). Similarly, samples from Uganda, Burkina Faso, and Cameroon form four overlapping DAPC groups. F I G U R E 5 Discriminant analysis of principal components (DAPC) for the African populations as implemented and plotted in “adegenet” R package. The graph represents the individuals as dots and the groups as inertia ellipses. A bar plot of eigenvalues for the discriminant analysis (DA eigenvalues) is displayed in the inset. The bars in the inset represent the number of discriminant functions retained in the analysis, the first two of which are used in the plot. Population codes are as shown in Table 1 1 GoudG 2 AFS, NBO 3 gAn 4 GB, GB_F, GB_V 7CAM 8Sedh 9KEN 10 ZIKA, BF, CamD, YAOMO, YAOF, YAOV, YAOMV, KS 11 GB, GB_F GB_V G DA eigenvalues 6CAM 5 ZIKA, Lun, KS
3.2 | Genetic diversity and differentiation
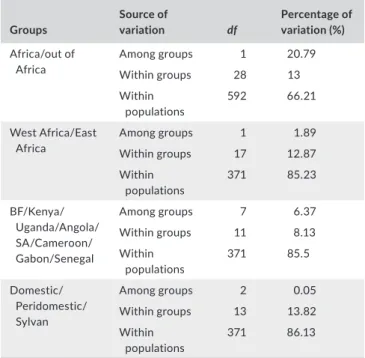
Table 2 shows the pairwise Fst values between the African popu-lations. All pairwise Fst estimations were significant at significance level 0.05. The mean genetic differentiation between Africa and New World is 0.32 and somewhat higher between Africa and Asia, 0.35. The Reunion sample, while technically coming from Africa, is as dif-ferentiated as Africa/outside Africa samples, average Fst of 0.33. The results of the analysis of AMOVA are presented in Table 3. The majority of the genetic variation in our dataset, regardless of the grouping, is within the populations. However, a great deal of variation (~20%) exists between groups in the first AMOVA anal-ysis (Africa/outside Africa) confirming the pattern in Figure 2 and Figure 4. Also, the results of the third AMOVA analysis are consis-tent with the patterns observed in both fastSTRUCTURE (Figure 3; K = 10) and DAPC (Figure 5). Because the results of both the genetic structure and the par- titioning of molecular variance analysis suggested isolation by dis-tance, we performed a Mantel test on the Africa dataset to test this hypothesis. The results show marginally significant (p- value 0.03) signs of isolation by distance (IBD) among the African populations (Figure 6). This is consistent with the findings of Gloria- Soria et al. (2016), presented in (Figure 4a) where microsatellites displayed IBD, less than in the New World.
3.3 | Phylogenetic analysis
The rooted ML phylogenetic tree is presented in Figure 7. All Aaa populations outside Africa form a monophyletic group distinct from
all the African Aaf populations. Consistent with their admixture pat-terns (Figure 2), Senegal and Angola populations are closer related to the Aaa lineage compared with the remaining African populations. The relationships between Cameroon, Gabon, Uganda, and Burkina Faso populations are unresolved. Because the focus here is to resolve pat- terns in continental Africa, Reunion was not included in the phyloge-netic analysis.
4 | DISCUSSION
Considering the global scale, the SNP- chip data (Figures 2 and 4a) are consistent with microsatellite, and RAD- seq studies in showing that Ae. aegypti has two major genetic groups. These two groups generally correspond to the described subspecies, Ae. aegypti formo-sus (Aaf) in Africa and Ae. aegypti aegypti outside Africa (Aaa) with Aaa being monophyletic (Figure 7) thus implying a single out of Africa event (Brown et al., 2014; Gloria- Soria et al., 2016).The population from Reunion Island, however, is exceptional in that it clustered with the Aedes mascarensis separately from the Aaf conti- nental populations. Three hypotheses can be proffered for this unex-pected distinction of Reunion samples. One is that Reunion Ae. aegypti has been introgressing with Ae. mascarensis (endemic to Mauritius), given the geographic closeness of the two islands, ~120 km apart. Ae. aegypti and Ae. mascarensis can hybridize and produce fertile off-spring (Hartberg & Craig, 1970). The evident clustering of Reunion with Ae. mascarensis (Figure 2) is consistent with this hypothesis. The fact that the three Aaf African populations from East Africa and South Africa (AFS, NBO, KEN) are partially admixed toward the Reunion/Ae. masca- rensis genotypes (Figure 2; K = 3) also supports the hypothesis of intro-gression between the two species when geographically close. A second possibility is that Reunion, being ~1200 km from mainland Africa, has been isolated for considerable time, although simple isolation does not address the issue of its genetic closeness to Ae. mascarensis. A third possibility we cannot formally dismiss, is that this clustering may be an artifact of biased SNP choice. When the SNP- chip was designed (Evans et al., 2015), we did not have access to either Ae. mascarensis or the Reunion samples, so genetic variation in these populations was not incorporated into the chip design. However, even though Ae. mascaren-sis and Reunion samples genotyped at somewhat fewer loci (Table 1), enough loci (~13–14,000) did genotype to provide reliable data and seems unlikely this could have biased our conclusions.
Considering continental Africa alone, it is clear that ~17,000 SNPs provide better genetic resolution than that provided by 12 microsat-ellites [e.g., compare Figure 3 here with Figure 3b in Gloria- Soria et al. (2016)]. Our results confirm the previous findings (Bennett et al., 2016; Brown et al., 2011; Gloria- Soria et al., 2016) of the existence of two major genetic groups within Africa that roughly correspond to a West- East differentiation (Figure 7) and at the same time, indicate patterns consistent with both limited migration producing significant isolation by distance as well as long- distance migration. The cluster-ing of Uganda, Burkina Faso, and Cameroon populations together (Figures 3, 4, and 5) is one striking example of long- distance gene
TA B L E 2 Analyses of molecular variance (AMOVA) as implemented in Arlequin Groups Source of variation df Percentage of variation (%) Africa/out of Africa Among groups 1 20.79 Within groups 28 13 Within populations 592 66.21 West Africa/East Africa Among groups 1 1.89 Within groups 17 12.87 Within populations 371 85.23 BF/Kenya/ Uganda/Angola/ SA/Cameroon/ Gabon/Senegal Among groups 7 6.37 Within groups 11 8.13 Within populations 371 85.5 Domestic/ Peridomestic/ Sylvan Among groups 2 0.05 Within groups 13 13.82 Within populations 371 86.13 Notes. Populations are divided into groups as shown in Table 1. BF: Burkina Faso; df: degrees of freedom; SA: South Africa.
T A B LE 3 Po pu la tio n D iffe re nt ia tio n 1 2 3 4 5 6 7 8 9 10 11 12 13 14 15 16 17 18 1: B uf fa lo c am p 2: Y ao un de M ok ol o 0.0 9 3: Y ao un de M vo g 0.0 5 0.0 7 4: Y ao un de Cen ter 0.0 8 0.0 7 0.0 6 5: Y ao un de F or es t 0.0 3 0.0 8 0.0 4 0.0 8 6: Y ao un de V ill ag e 0.0 2 0.0 8 0.0 4 0.0 7 0.0 1 7: B ur ki na F as o 0.0 3 0.0 7 0.0 4 0.0 7 0.0 4 0.0 3 8: L ua nd a A ng ol a 0. 20 0. 19 0. 17 0. 19 0. 20 0. 19 0.1 8 9: G ou di ry 0.1 5 0.1 6 0.1 3 0.1 5 0. 14 0.1 3 0.1 3 0.1 5 10 : S ed hi ou 0.1 3 0.1 5 0.1 2 0.1 5 0. 11 0. 11 0. 11 0. 20 0.1 6 11 : Jo ha nne sb ur g 0. 22 0. 26 0. 23 0. 24 0. 22 0. 21 0. 22 0. 22 0. 27 0. 27 12 : K ah aw a Su ka ri 0.0 6 0. 11 0.0 7 0.1 0 0.0 6 0.0 5 0.0 7 0. 19 0.1 6 0. 14 0.1 8 13 : K ay a Fo re st 0. 28 0. 30 0. 27 0. 28 0. 28 0. 27 0. 26 0. 23 0. 29 0. 31 0. 22 0. 25 14 : N ai ro bi 0.1 8 0. 20 0. 19 0. 20 0.1 8 0. 17 0. 17 0. 17 0. 22 0. 23 0.0 7 0.1 5 0. 20 15 : L op e Fo re st 0.0 6 0. 11 0.0 8 0. 11 0.0 6 0.0 5 0.0 7 0. 20 0. 17 0.1 5 0.1 6 0.0 7 0. 25 0. 14 16 : L op e V ill ag e 0.0 5 0.0 9 0.0 7 0.0 9 0.0 5 0.0 4 0.0 6 0.1 8 0.1 5 0. 14 0.1 5 0.0 6 0. 23 0.1 3 0.0 1 17 : F ra nc ev ill e 0.0 8 0.1 3 0.1 0 0.1 2 0.0 9 0.0 8 0.0 9 0. 19 0. 19 0. 17 0.1 3 0.0 8 0. 23 0.1 2 0.0 5 0.0 4 18 : L un yo 0.0 7 0. 11 0.0 8 0. 11 0.0 6 0.0 6 0.0 7 0. 21 0. 17 0.1 5 0. 23 0.0 8 0. 29 0. 20 0.1 0 0.0 8 0. 11 19 : Z ik a 0.0 4 0.0 9 0.0 6 0.0 9 0.0 4 0.0 4 0.0 5 0. 20 0.1 5 0.1 3 0. 20 0.0 5 0. 26 0. 17 0.0 7 0.0 6 0.0 9 0.0 5 N ote . P ai rw is e Fs t v al ue s be tw ee n A fr ic an p op ul at io ns o f A e. a eg yp ti as e st im at ed b as ed o n th e pa ne l o f ~ 17 K S N Ps , u si ng A rle qu in . A ll va lu es a re s ig ni fic an t a t s ig ni fic an ce le ve l 0 .0 5.
flow that disrupts the West- East geographic pattern (Table 2) that had been suggested by previous studies (Bennett et al., 2016; Brown et al., 2011; Moore et al., 2013). This could be due to the fact that the forest habitat typical of ancestral Aaf was continuous across this part of Africa for a long period of time, before human habitation and cut-ting of forests, allowing enough time in a continuous habitat for even a poor disperser to become relatively genetically homogeneous. Alternatively, the clustering of Kahawa, Kenya, with Cameroon sam-ples (Figures 2, 3, and 7) may imply an old human- mediated migration across the continent. Bennett et al. (2016) suggested that the Kenya- Cameroon connection could be due to the populations being once isolated by geographic barriers (e.g., the East African Rift Valley) and then during the Holocene, human migration contributed to mosqui-toes migration. Specifically it is known that ~5,000 years ago Bantu farmers moved across the center of Africa from Cameroon to Kenya.
The clearest and most striking example of long- distance ge-netic connections is the clustering of two major cities, Nairobi, Kenya (NBO) and Johannesburg, South Africa (AFS) separated by ~3,000 km (Figures 3, 4, and 5), implying long- distance anthropo-genic migration. Nairobi is the only city sampled from the broader Kenya- Uganda East Africa region which may account for its genetic closeness to the city sampled in South Africa. Commercial trade and human movement between these two major cities are high. The other samples from this region coming from forest or perido-mestic habitats (Table 1), do not display such genetic affinities to Johannesburg.
While all evidence point to a single domestication event leading to Aaa outside of Africa, there are secondary, independent domes-tications taking place within Africa. Genetic patterns suggest that populations in human habitats in Africa today do not have a single
origin, and often mix with nearby peridomestic or sylvan populations [as also seen in microsatellite data (Brown et al., 2011)]. While gener-ally domestic collections are closely related to geographically close sylvan or peridomestic collections, the case of Nairobi, discussed above, is an exception and highlights the complex patterns of coloni-zation that occur in Africa.
Using Ae. mascarensis as an outgroup, Aedes aegypti (sensu lato) forms a monophyletic group. Aaa outside Africa (New World and Asia) also forms a monophyletic group implying a single origin (Figure 7). The single out of Africa origin of Aaa has been previously supported by microsatellite (Gloria- Soria et al., 2016) and RAD- seq (Brown et al., 2014) data as well as by a combination of five nuclear gene sequences and mtDNA (Bennett et al., 2016). More specifically, Bennett et al. (2016) supported West Africa as most likely origin of Aaa, in agreement with our data (Figure 7).
However, there is a major difference between Bennett et al. (2016) and our results concerning the origin of Aaa in Asia. The ABC analysis of Bennett et al. (2016) favored the New World coming from Asia, although the statistical support for this bio-geographic scenario was not strong. Our data here (Figure 7) and elsewhere (Brown et al., 2014; Gloria- Soria et al., 2016; Kotsakiozi et al., 2018) support with strong statistical power that Asia was derived from the New World. A recent study (Crawford et al., 2017) based on exome sequence data, suggested that Aaa may have arisen from populations of Aaf in West Africa, specifically from Senegal which was the only West African country sampled in that study. Our data indicate that, while Senegal has some genetic signal typical of Aaa outside Africa, the Angola sample displays an even stronger signal of genetic related-ness to Aaa outside Africa (Figure 2). The population from Angola F I G U R E 6 Isolation- by- distance plots for all pairs of populations from continental Africa. Statistical significance was evaluated through a Mantel test as implemented in the “ade4” R package. The original value of the correlation between the two matrices (geographic distance and genetic distance) is represented by a dot, while the histogram (a) represents the permutated values assuming the absence of spatial structure. Significant spatial structure results in the original value being out of the reference distribution. The correlation between geographic and genetic distance was plotted using the R package “MASS.” The scatterplot (b) shows one single consistent cloud of points. The colored gradient from light blue to red indicates the density of the points which are also shown as red points in the background of the graph. The blue dashed line represents the regression line between the geographic and genetic distance
shows admixed ancestry (Q values; 0.42–0.60) toward the New World genotype (Figure 2). Our phylogenetic analysis (Figure 7), including several West African populations (Figure 1), revealed that indeed Senegal samples are phylogenetically closely related to the Aaa, but that Angola is even closer and would be the best candidate for the origin of Aaa. F I G U R E 7 Maximum likelihood (ML) rooted phylogenetic tree re- constructed using a panel of ~12,000 SNPs. Ae. mascarensis was used as an outgroup, and Aaa samples from New World and Asia were used to test the distinctiveness of Aaf and Aaa lineages. Bootstraps are presented on the nodes; values <70 are not shown
Using genetic data, the time of origin of Aaa in the New World has been estimated to be ~400- 500 years ago (Crawford et al., 2017; Gloria- Soria et al., 2016; Kotsakiozi et al., 2018). Yellow fever was first reported in the New World in 1648 (McNeill, 1976) not long after the introduction of Ae. aegypti to the New World. This is also the time of the rise of trans- Atlantic shipping by Europeans. Ships starting their journey in Europe stopped in West Africa to pick up native Africans for the slave trade (Eltis & Richardson, 2010). It is likely that Ae. aegypti (as eggs and/or larvae) would have been introduced to those ships and they may have been al-ready semidomesticated in the towns or coastal villages of West Africa (e.g., ovipositing in stored water containers during the pro- longed dry periods in West Africa). Thus, these “proto- Aaa” mos-quitoes could survive the long voyage between West Africa and New World. Interestingly, during the early period of slave trade, 1500- 1650, ~70% of the trade was carried out by Portugal (Eltis & Richardson, 2010) with ships that primarily used what is today Angola as their source of slaves (Eltis & Richardson, 2010). An Angolan source of invasion is consistent with the genetic patterns observed (Figure 7).
From a public health perspective, Ae. aegypti in Africa has taken on new importance. After decades of low levels, yellow fever has been resurging in Africa (Kraemer et al., 2017). Insecticide resis-tance and lack of vaccine supplies are doubtlessly contributing to this resurgence. As urban environments continue to encroach on this formerly forest- adapted mosquito’s habitat in Africa, it is clear that Aaf possesses the adaptive flexibility to repeatedly switch to urban breeding. This ongoing active evolution is also an attractive opportunity to study insect adaptations to human habitats, an issue of general importance in a number of medical and agricultural contexts. ACKNOWLEDGMENTS This work was supported by NIH grant RO1 AI101112 awarded to JRP. CONFLIC T OF INTEREST None declared. AUTHORS’ CONTRIBUTIONS PK carried out part of the molecular laboratory work, the data analy-ses, and drafted the manuscript. BE carried out the largest part of the molecular laboratory work and drafted an earlier version of the manuscript. AG- S carried out part of the molecular work and revised the manuscript critically for important intellectual content. BK, MM, JL, GLG, DA, CP, AB, JP, CAS, and ADT provided samples and revised the manuscript critically for important intellectual content. JRP con-ceived, designed, and coordinated the study, edited the manuscript, and obtained funds for the research. All authors gave final approval for publication. DATA ACCESSIBILIT Y The data used are available in vector.base.org under the project ID VBP0000295 ORCID
Andrea Gloria-Soria http://orcid.org/0000-0002-5401-3988
Christophe Paupy http://orcid.org/0000-0002-7122-2079
Jeffrey R. Powell http://orcid.org/0000-0002-7651-5153
REFERENCES
Bennett, K. L., Shija, F., Linton, Y. M., Misinzo, G., Kaddumukasa, M., Djouaka, R., … Walton, C. (2016). Historical environmental change in Africa drives divergence and admixture of Aedes aegypti mosquitoes: A precursor to successful worldwide colonization? Molecular Ecology, 25, 4337–4354. https://doi.org/10.1111/mec.13762
Bosio, C. F., Beaty, B. J., & Black, W. C. (1998). Quantitative genetics of vector competence for dengue- 2 virus in Aedes aegypti. American Journal of Tropical Medicine and Hygiene, 59, 965–970. https://doi. org/10.4269/ajtmh.1998.59.965
Bosio, C. F., Harrington, L. C., Jones, J. W., Sithiprasana, R., Norris, D. E., & Scott, T. W. (2005). Genetic structure of Aedes aegypti populations in Thailand using mitochondrial DNA. American Journal of Tropical Medicine and Hygiene, 72, 434–442.
Bracco, J. E., Capurro, M. L., Lourenço-de-Oliveira, R., & Sallum, M. M. (2007). Genetic variability of Aedes aegypti in the Americas using a mitochondrial gene: Evidence of multiple introductions. Memorias do Instituto Oswaldo Cruz, 102, 573–580. https://doi.org/10.1590/ S0074-02762007005000062 Brown, J. E., Evans, B. R., Zheng, W., Obas, V., Berrera-artinez, L., Egizi, A., … Powell, J. R. (2014). Human impacts have shaped historical and recent evolution in Aedes aegypti, the dengue and yellow fever mos-quito. Evolution, 68, 514–525. https://doi.org/10.1111/evo.12281 Brown, J. E., McBride, C. S., Johnson, P., Ritchie, S., Paupy, C., Bossin, H., … Powell, J. R. (2011). Worldwide patterns of genetic differentiation imply multiple ‘domestications’ of Aedes aegypti, a major vector of human diseases. Proceedings of the Royal Society B, 278, 2446–2454. https://doi.org/10.1098/rspb.2010.2469
Centers for Disease Control and Prevention (2016) Zika virus. http:// www.cdc.gov/zika/geo/united-states.html
Chapuis, M.-P., & Estoup, A. (2007). Microsatellite null alleles and estima-tion of population differentiation. Molecular Biology and Evolution, 24, 621–631. https://doi.org/10.1093/molbev/msl191
Crawford, J. E., Alves, J. M., Palmer, W. J., Day, J. P., Sylla, M., Ramasamy, R., … Jiggins, F. M. (2017). Population genomics reveals that an anthropophilic population of Aedes aegypti mosquitoes in West Africa recently gave rise to American and Asian populations of this major disease vector. BMC Biology, 15, 16. https://doi.org/10.1186/ s12915-017-0351-0
Diallo, M., Ba, Y., Faye, O., Soumare, L., Dia, I., & Sall, A. A. (2008). Vector competence of Aedes aegypti populations from Senegal for sylvatic and epidemic dengue 2 virus isolated in West Africa. Transactions of the Royal Society of Tropical Medicine and Hygiene, 102, 493–498. https://doi.org/10.1016/j.trstmh.2008.02.010
Dickson, L. B., Sanchez-Vargas, I., Sylla, M., Fleming, K., & Black, W. C. (2014). Vector competence in West African Aedes aegypti is flavivirus species and genotype dependent. PLoS Neglected Tropical Diseases, 8, e3153. https://doi.org/10.1371/journal.pntd.0003153
Eltis, D., & Richardson, D. (2010). Atlas of the Transatlantic Slave Trade. New Haven, CT: Yale University Press.
Evans, B. R., Gloria-Soria, A., Hou, L, McBride, C., Bonizzoni, M., Zhao, H., & Powell, J. R. (2015). Multipurpose, high- throughput single- nucleotide polymorphism chip for the dengue and yellow fever mosquito, Aedes aegypti. G3: Genes|Genomes|Genetics, 5, 711–718. https://doi.org/10.1534/g3.114.016196 Excoffier, L., Smouse, P. E., & Quattro, J. M. (1992). Analysis of molecu-lar variance inferred from metric distances among DNA haplotypes: Application to human mitochondrial DNA restriction data. Genetics, 131, 479–491. Frichot, E., & Francois, O. (2015). LEA: An R package for landscape and ecological association studies. Methods in Ecology and Evolution, 6, 925–929. https://doi.org/10.1111/2041-210X.12382
Gloria-Soria, A., Ayala, D., Bheecarry, A., Calderon-Arguedas, O., Chadee, D. E., Chiappero, M., & Powell, J. R. (2016). Global genetic diversity of Aedes aegypti. Molecular Ecology, 25, 5377–5395. https:// doi.org/10.1111/mec.13866
Gloria-Soria, A., Lima, A., Lovin, D., Cunningham, J. M., Severson, D. W., & Powell, J. R. (2018). Origin of a high latitude population of Aedes aegypti in Washington, DC. American Journal of Tropical Medicine and Hygiene, 98, 445–452. https://doi.org/10.4269/ajtmh.17-0676 Gonçalves da Silva, A., Cunha, I. C. L., Santos, W. S., Luz, S. L. B., Ribolla,
P. E. M., & Abad-Franch, F. (2012). Gene flow networks among American Aedes aegypti populations. Evolutionary Applications, 5, 664–676. https://doi.org/10.1111/j.1752-4571.2012.00244.x Hartberg, W. K., & Craig, G. B. (1970). Reproductive isolation in
Stegomyia mosquitoes. II. Hybrid breakdown between Aedes aegypti and A. mascarensis. Evolution, 24, 692–703. https://doi. org/10.1111/j.1558-5646.1970.tb01805.x
Jombart, T. (2008). Adegenet: A R package for the multivariate analy-sis of genetic markers. Bioinformatics, 24, 1403–1405. https://doi. org/10.1093/bioinformatics/btn129
Kopelman, N. M., Mayzel, J., Jakobsson, M., Rosenberg, N. A., & Mayrose, I. (2015). Clumpak: A program for identifying clustering modes and packaging population structure inferences across K. Molecular Ecology Resources, 15, 1179–1191. https://doi.org/10.1111/1755-0998.12387 Kotsakiozi, P., Gloria-Soria, A., Caccone, A., Evans, B., Schama, R.,
Martins, A. J., & Powell, J. R. (2017). Tracking the return of Aedes ae-gypti to Brazil, the major vector of the dengue, chikungunya and Zika viruses. PLOS Neglected Tropical Diseases, 11, e0005653.
Kotsakiozi, P., Gloria-Soria, A., Schaffner, F., Robert, V., & Powell, J. (2018). Aedes aegypti in the Black Sea: Recent introduction or ancient remnant? Parasites & VectorIn press.
Kotsakiozi, P., Richardson, J. B., Pichler, V., Favia, G., Martins, A. J., Urbanelli, S., … Caccone, A. (2017). Population genomics of the Asian tiger mosquito, Aedes albopictus: Insights into the recent worldwide invasion. Ecology and Evolution, 7, 10143–10157. https://doi.org/10.1002/ece3.3514 Kraemer, M. U. G., Faria, N. R., Reiner, R. C., Golding, N., Nikolay, B.,
Stasse, S., … Cauchemez, S. (2017). Spread of yellow fever virus out-break in Angola and the Democratic Republic of the Congo 2015– 16: A modelling study. The Lancet. Infectious Diseases, 17, 330–338. https://doi.org/10.1016/S1473-3099(16)30513-8
Lewis, P. O. (2001). A likelihood approach to estimating phylogeny from discrete morphological character data. Systematic Biology, 50, 913– 925. https://doi.org/10.1080/106351501753462876
Lounibos, L. P. (1981). Habitat segregation among African tree-hole mosquitoes. Ecological Entomology, 6, 129–154. https://doi. org/10.1111/j.1365-2311.1981.tb00601.x
Luu, K., Bazin, E., & Blum, M. G. B. (2017). pcadapt: An R package to perform genome scans for selection based on principal compo-nent analysis. Molecular Ecology Resources, 17, 67–77. https://doi. org/10.1111/1755-0998.12592
Mattingly, P. F. (1957). Genetiecal asapects of the Aedes aegypti prob-lem. I. Taxonomy and bionomics. Annals of Tropical Medicine and Parasitology, 51, 392–408. https://doi.org/10.1080/00034983.1957 .11685829 McBride, C. S., Baier, F., Omondi, A. B., Spitzer, S. A., Lutomiah, J., Sang, R., … Vosshall, L. B. (2014). Evolution of mosquito preference for hu-mans linked to an odorant receptor. Nature, 515, 222–227. https:// doi.org/10.1038/nature13964
McNeill, W. H. (1976). Plagues and people. New York, NY: Doubleday. Moore, M., Sylla, M., Goss, L., Burugu, M. W., Sang, R., Kamau, L. W., …
Black, W. C. (2013). Dual African origins of global Aedes aegypti s.l. populations revealed by mitochondrial DNA. PLOS Neglected Tropical Diseases, 7, e2175. https://doi.org/10.1371/journal.pntd.0002175 Mousson, L., Dauga, C., Garrigues, T., & Schaffner, F. (2005).
Phylogeography of Aedes (Stegomyia) aegypti (L.) and Aedes (Stegomyia) albopictus (Skuse) (Diptera: Culicidae) based on mito-chondrial DNA variations. Genetical Research, 86, 1–11. https://doi. org/10.1017/S0016672305007627
Nazareno, A. G., Bemmels, J. B., Dick, C. W., & Lohmann, L. G. (2017). Minimum sample sizes for population genomics: An empirical study from an Amazonian plant species. Molecular Ecology Resources, 17, 1136–1147. https://doi.org/10.1111/1755-0998.12654
Patterson, N., Price, A. L., & Reich, D. (2006). Population Structure and Eigenanalysis. PLoS Genetics, 2, e190. https://doi.org/10.1371/jour-nal.pgen.0020190
Pless, E., Gloria-Soria, A., Evans, B. R., Kramer, V., Bolling, B. G., Tabachnick, W. J., & Powell, J. R. (2017). Multiple introductions of the dengue vector, Aedes aegypti, into California. PLOS Neglected Tropical Diseases, 11, e0005718.
Powell, J. R. (2016). Mosquitoes on the move. Science, 354, 971–972. https://doi.org/10.1126/science.aal1717
Powell, J. R., & Tabachnick, W. J. (2013). History of domestication and spread of Aedes aegypti - a review. Memórias do Instituto Oswaldo Cruz, 108, 11–17. https://doi.org/10.1590/0074-0276130395 Puckett, E. E., Park, J., Combs, M., Blum, M. J., Bryant, J. E., Caccone, A., &
Munshi-South, J. (2016). Global population divergence and admixture of the brown rat (Rattus norvegicus). Proceedings of the Royal Society B: Biological Sciences, 283, 20161762. https://doi.org/10.1098/rspb. 2016.1762
Puechmaille, S. J. (2016). The program structure does not reli-ably recover the correct population structure when sampling is uneven: Subsampling and new estimators alleviate the prob-lem. Molecular Ecology Resources, 16, 608–627. https://doi. org/10.1111/1755-0998.12512
Purcell, S., Neale, B., Todd-Brown, K., Thomas, L., Ferreira, M. A. R., Bender, D., … Sham, P. C. (2007). LINK: A tool set for whole- genome association and population- based linkage analyses. American Journal of Human Genetics, 81, 559–575. https://doi.org/10.1086/519795 Raj, A., Stephens, M., & Pritchard, J. K. (2014). fastSTRUCTURE: Variational
inference of population structure in large SNP datasets. Genetics, 197, 573–589. https://doi.org/10.1534/genetics.114.164350 Rašić, G., Endersby-Harshman, N., Tantowijoyo, W., Goundar, A., White,
V., Yang, Q., … Arguni, E. (2015). Aedes aegypti has spatially struc-tured and seasonally stable populations in Yogyakarta, Indonesia. Parasites and Vectors, 8, 610.
Rašić, G., Filipović, I., Weeks, A. R., & Hoffmann, A. A. (2014). Genome- wide SNPs lead to strong signals of geographic structure and relat-edness patterns in the major arbovirus vector, Aedes aegypti. BMC Genomics, 15, 275.
R Core Team (2018). R: A language and environment for statistical com-puting. R Foundation for Statistical Computing, Vienna, Austria. URL https://www.R-project.org/.
Scarpassa, V. M., Cardoza, T. B., & Cardoso, R. P. Jr (2008). Population genetics and phylogeography of Aedes aegypti (Diptera: Culicidae) from Brazil. American Journal of Tropical Medicine and Hygiene, 78, 895–903.
Stamatakis, A. (2014). RAxML version 8: A tool for phylogenetic analy-sis and post- analysis of large phylogenies. Bioinformatics, 30, 1312– 1313. https://doi.org/10.1093/bioinformatics/btu033
Tabachnick, W. J. (1991). Evolutionary genetics and arthropod- borne dis-ease: The yellow fever mosquito. American Entomologist, 37, 14–26. https://doi.org/10.1093/ae/37.1.14
Tabachnick, W. J., Wallis, G. P., Aitken, T. H., Miller, B. R., Amato, G. D., Lorenz, L., … Beaty, B. J. (1985). Oral infection of Aedes aegypti with yellow fever virus: Geographic variation and ge-netic considerations. American Journal of Tropical Medicine and Hygiene, 34, 1219–1224. https://doi.org/10.4269/ajtmh.1985. 34.1219
Vazeille, M., Yebakima, A, Lourenco-de-Oliveira, R., Andriamahefazafy, B., Correira, A., Rodrigues, J. M, & Failloux, A.-B. (2013). Oral recep-tivity of Aedes aegypti from Cape Verde for yellow fever, dengue, and chikungunya viruses. Vector- Borne and Zoonotic Diseases, 13, 37–40. https://doi.org/10.1089/vbz.2012.0982
Wang, J. (2017). The computer program structure for assigning indi-viduals to populations: Easy to use but easier to misuse. Molecular
Ecology Resources, 17, 981–990. https://doi.org/10.1111/1755- 0998.12650
Weetman, D., Kamgang, B., Badolo, A., Moyes, C. L., Shearer, F. M., Coulibaly, M., … McCall, P. J. (2018). Aedes mosquitoes and Aedes- borne arboviruses in Africa: Current and future threats. International Journal of Environmental Research and Public Health, 15, 220. https:// doi.org/10.3390/ijerph15020220
How to cite this article: Kotsakiozi P, Evans BR, Gloria-Soria A,
et al. Population structure of a vector of human diseases: Aedes aegypti in its ancestral range, Africa. Ecol Evol. 2018;8:7835–7848. https://doi.org/10.1002/ece3.4278