HAL Id: hal-02998449
https://hal.archives-ouvertes.fr/hal-02998449
Submitted on 10 Nov 2020
HAL is a multi-disciplinary open access
archive for the deposit and dissemination of
sci-entific research documents, whether they are
pub-lished or not. The documents may come from
teaching and research institutions in France or
abroad, or from public or private research centers.
L’archive ouverte pluridisciplinaire HAL, est
destinée au dépôt et à la diffusion de documents
scientifiques de niveau recherche, publiés ou non,
émanant des établissements d’enseignement et de
recherche français ou étrangers, des laboratoires
publics ou privés.
for signaling kinship in a wild primate
M. Charpentier, M. Harté, C. Poirotte, J Meric de Bellefon, B. Laubi, P.
Kappeler, J. Renoult, J. Meric de Bellefon
To cite this version:
M. Charpentier, M. Harté, C. Poirotte, J Meric de Bellefon, B. Laubi, et al.. Same father, same face:
Deep learning reveals selection for signaling kinship in a wild primate. Science Advances ,
Ameri-can Association for the Advancement of Science (AAAS), 2020, 6 (22), pp.eaba3274.
�10.1126/sci-adv.aba3274�. �hal-02998449�
E V O L U T I O N A R Y B I O L O G Y
Same father, same face: Deep learning reveals selection
for signaling kinship in a wild primate
M. J. E. Charpentier1*, M. Harté1, C. Poirotte2, J. Meric de Bellefon3, B. Laubi3,
P. M. Kappeler2, J. P. Renoult4
Many animals rely on facial traits to recognize their kin; however, whether these traits have been selected specifi-cally for this function remains unknown. Using deep learning for face recognition, we present the first evidence that interindividual facial resemblance has been selected to signal paternal kinship. Mandrills (Mandrillus sphinx) live in matrilineal societies, in which females spend their entire lives not only with maternal half-sisters (MHS) but also with paternal half-sisters (PHS). We show that PHS have more differentiated social relationships compared to nonkin, suggesting the existence of kin recognition mechanisms. We further demonstrate that facial resemblance increases with genetic relatedness. However, PHS resemble each other visually more than MHS do, despite both kin categories sharing similar degrees of genetic relatedness. This paternally derived facial resemblance among PHS indicates selection to facilitate kin recognition. This study also highlights the potential of artificial intelligence to study phenotypic evolution.
INTRODUCTION
Kin selection, the process by which traits are favored because of their beneficial effects on the survival of relatives (1, 2), is a major evolu-tionary force shaping cooperative interactions in animal societies (1, 3). Kin selection often implies kin recognition, which, in many species, is mediated by facial traits (4). In humans, facial traits are both the most morphologically variable and the most singular and recognizable features of the physical appearance (5). They are also highly heritable, some showing more than 90% of heritability (6, 7), resulting in ele-vated facial resemblance among relatives and across generations. Consequently, both human and nonhuman primate subjects are able to infer genetic relatedness from faces, in conspecifics (8–10) and in members of other species (11, 12). However, whether kin-biased facial resemblance merely reflects genetic ancestry or results from selection to facilitate kin recognition remains unknown. Here, we test whether interindividual facial resemblance among paternal relatives has been kin-selected, using a state-of-the-art artificial intelligence approach based on deep neural networks (DNNs) and long-term data ob-tained from a natural population of primates.
As many other mammals, some nonhuman primates live in multimale-multifemale groups structured around maternally related females (matrilines) and are characterized by male-biased dispersal. In these societies, reproduction is often skewed toward a few high- ranking males, whose dominance rank is frequently turned over (13). This pattern also characterizes mandrills (Mandrillus sphinx), an Old World primate inhabiting the rain forests of Central Africa. In this species, reproduction is seasonal and male-male competition is fierce, resulting in an alpha male’s monopolization of about 70% of the annual reproductive events in captivity (14) and probably also in the wild (see Supplementary Results). As a consequence of this high reproductive skew, most newborn infants of a given cohort are re-lated through the paternal line but are born into different matrilines.
While maternal half-siblings are necessarily familiar with each other from birth onward because they are raised together in the same social environment, paternal half-siblings should be less familiar with each other because they grow up in different families. Yet, there is some evidence from studies on captive mandrills that juvenile paternal half-siblings have differentiated social relationships (15), suggesting that they do recognize each other as kin.
Paternal half-siblings are often close in age because an alpha male’s tenure generally lasts for a short period of time (14). Kin recogni-tion may therefore rely on cues of age proximity, as found in female yellow baboons [Papio cynocephalus (16)] and rhesus macaques [Macaca mulatta (17); see also (18)]. In mandrills, as in other primate species [e.g., in female blue monkeys Cercopithecus mitis (19)], how-ever, paternal half-siblings recognize each other even when they are not close in age (15). In these species, kin recognition is probably mediated by phenotype-matching mechanisms, when interaction patterns reflect a correlation between phenotypic and genetic resem-blances (18). In this study, we investigate whether facial traits act as a signal of kinship in mandrills, a primate species with a matrilineal social organization characterized by the presence of numerous pa-ternal half-siblings.
We investigated the only free-ranging population of habituated but unprovisioned mandrills (ca. 220 individuals) on which detailed individual-based data on life history, behavior, and demography have been collected since 2012. On the basis of patterns of reproduction in this population (see Supplementary Results), we estimated that females, the philopatric sex, encounter, on average, 2.1 times more paternal half-sisters (PHS) than maternal half-sisters (MHS) in their group during the course of their lifetime. As predicted by kin selection theory (1), these numerous PHS represent a pool of potential social partners who may contribute to an increase in an individual’s inclusive fitness. We therefore expect strong selection on phenotypic traits facilitating PHS recognition in this species. In addition, the variance in the number of PHS in females is 12.8 times higher than that of MHS in the studied population (see Supplementary Results; table S1). This difference is a direct consequence of the high male reproductive skew because the alpha males’ daughters have many PHS, whereas the daughters of subordinate males only have a few PHS. The high variance in the number of PHS should select for an efficient
1ISEM, UMR5554, Université de Montpellier, CNRS, IRD, EPHE, Place Eugène Bataillon (cc065), 34095 Montpellier cedex 05, France. 2Behavioral Ecology and Sociobiology Unit, German Primate Center, Kellnerweg 4, 37077 Göttingen, Germany. 3Projet Mandrillus, SODEPAL, BP 52, Bakoumba, Gabon. 4CEFE, UMR5175, CNRS, University of Montpellier, University Paul Valery Montpellier, EPHE, 1919 route de Mende, 34293 Montpellier, France.
*Corresponding author. Email: [email protected]
Copyright © 2020 The Authors, some rights reserved; exclusive licensee American Association for the Advancement of Science. No claim to original U.S. Government Works. Distributed under a Creative Commons Attribution NonCommercial License 4.0 (CC BY-NC). on May 29, 2020 http://advances.sciencemag.org/ Downloaded from
(i.e., error-free) system of kin recognition and signaling. Thus, in such a matrilineal society, individuals should recognize MHS using cues from their matrilineal social environment, but they should also recognize PHS by relying on other cues.
We hypothesize that facial traits are under strong selection to facilitate kin recognition among PHS. We first predict that, all else being equal, PHS show more differentiated social relationships than nonkin (NK): They should, for example, associate and affiliate more with each other. Second, we predict that facial traits are under kin selection: PHS should resemble each other more than expected given their genetic resemblance. Thus, they should resemble each other more than NK do but, more importantly, also more than MHS do, even though PHS and MHS share, on average, the same degree of genetic relatedness (r = 0.25). For the past 8 years, we have collated a photobank of about 16,000 facial pictures on a total of 276 indi-viduals, some of which are represented with regular portraits from birth to adulthood. This unique long-term resource allowed us to control for confounding effects of age difference (MHS are neces-sarily at least 1 year apart whereas PHS are generally age mates) on mandrill’s faces.
We used DNNs to measure the resemblance between female faces. DNNs have revolutionized the computational study of facial resem-blance over the last 5 years, now outperforming human capabilities in recognizing people by their face from a photograph (20). DNNs use a cascade of multiple layers of interconnected neurons that build representations of faces with different levels of abstraction and complexity. The deeper layers ultimately represent entire faces in an informative and low-dimensional space, the so-called deep feature space (DFS). The DFS is informative because it is insensitive to vari-ations that are irrelevant for the task the DNN has been trained on. For example, for face recognition, a DNN learns to identify individuals independently of lighting, head orientation, haircut, and accessories. In a DFS, two portrait images that differ only by these irrelevant variations are located at the same place, and, thus, the distance be-tween images in that space reliably estimates resemblance bebe-tween individuals (21). Here, we embedded portrait images into a DFS shaped specifically to represent the identity of female mandrills. To our knowledge, this is the first study that uses a DFS to quantify phenotypic resemblance in wild animals.
RESULTS
Kinship and sociality
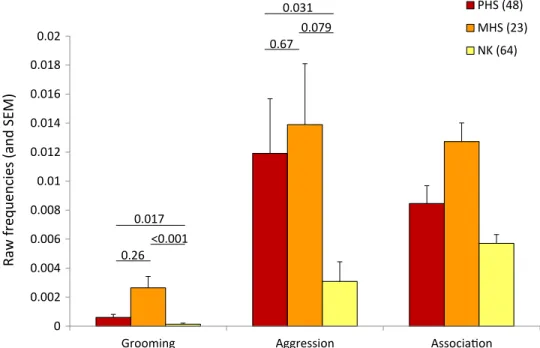
PHS exhibit differentiated social relationships: They are spatially closer and share more grooming and more aggression compared to NK (Table 1 and Fig. 1). Restricting our datasets to pairs close in age (<2 years apart) yielded qualitatively similar results (table S2). Al-though MHS generally show the highest frequencies of association and interactions, the average social phenotypes of PHS and MHS are statistically similar. This result suggests that adult PHS recognize each other as kin.
Deep feature space to estimate facial resemblance
We estimated facial resemblance between female mandrills through the distance of their portrait images in a DFS (“face distance” here-after). We used a two-step pipeline that performs a face identification task followed by a face verification task. For the face identification task, we used a DNN pretrained to identify human faces, which we retrained with mandrill images (different individuals from the ones
used in this study; table S3). The newly trained DNN could recognize individuals (N = 202) with up to 91.9% of correct identification (table S4). This high performance indicates that our DNN is able to build a DFS that informatively represents mandrills’ faces. In the face veri-fication task, a distance metric was learned such that the distance between same-individual pictures in the DFS was minimized. When evaluated with the studied females, the face verification model could identify whether two pictures represented the same individual with an accuracy of 83% for the adult females (table S5) and 90% for the juvenile females (table S6) despite the fact that the model was totally naïve to these individuals. This model was used to measure the aver-age facial resemblance between all pairs of adult females and all pairs of juvenile females from the studied population. These phenotypic data were then compared to genetic data.
Genetic and facial resemblance
We studied the relationship between genetic relatedness, obtained from a well-resolved pedigree based on genetic analyses, and face distance across 38,515 pairs of pictures collected on 38 adult females (703 different pairs in total). While controlling for the identity of female pairs (random effect) and the difference in age between females within pairs, we demonstrate a negative relationship between genetic relatedness and face distance (general linear mixed models; estimate = −2.33; F = 43.09; P < 0.0001): Related females look more alike than unrelated females (Fig. 2). For example, compared to the average distance between faces of the same individual, the average face distance increases by 26% for pairs with a coefficient of relatedness
r = 0.5, corresponding to, e.g., mother-offspring pairs, and by 36%
for pairs with an r = 0.0625, corresponding to, e.g., first cousins.
Kinship, facial resemblance, and female development
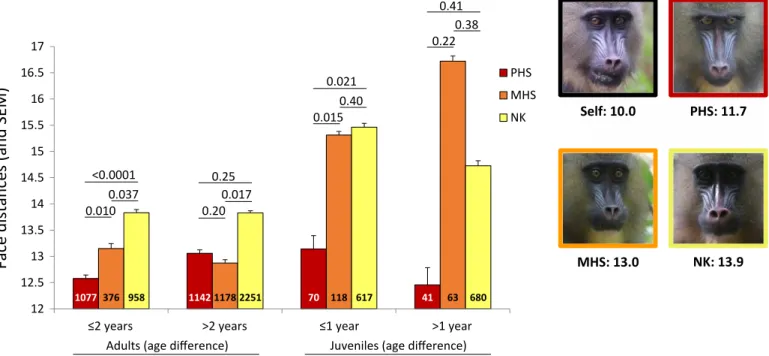
We explored whether kinship was detectable from faces and, if so, when this occurred during females’ development. We treated kin-ship as a discrete variable and restricted our analyses to MHS and PHS with an equivalent degree of genetic relatedness (r ~ 0.25) that we compared to NK pairs. Analyzing 6992 pairs of portrait images corresponding to 45 adult females (159 pairs in total), we show that face distances differ significantly across kin categories in interaction with the difference in age between the portraits of pairs of females (Table 2). A closer examination of various classes of age differences (e.g., 0 to 1 year, 1 to 2 years, 2 to 3 years, and so on) reveals that the interaction between kinship and age difference disappears when split-ting pairs of portraits of females aged less than 2 years apart from those aged more than 2 years apart. Across pairs aged less than 2 years apart, PHS show the lowest face distance; i.e., they resemble each other more than either NK or MHS do (Table 2A and Fig. 3). Across pairs aged more than 2 years apart, kinship only marginally explains face distances (Table 2A), with NK being the most dissimilar, com-pared to the other two kin categories (Fig. 3). In juvenile females, we observe a similar effect of the interaction between kinship and age difference on face distances. Again, this interaction disappears when splitting pictures of juveniles aged less than a year apart from those aged more than a year apart (Table 2B). PHS aged less than a year apart resemble each other more than MHS or NK do. Unexpectedly, MHS and NK do not differ significantly from each other in these young females. This pattern holds true when considering pairs aged more than a year apart, although kinship does not significantly affect face distances overall, probably because of a restricted sample size (Table 2B and Fig. 3).
on May 29, 2020
http://advances.sciencemag.org/
DISCUSSION
In this study, we asked whether facial traits may facilitate kin recog-nition. We investigated a species in which the intensity of selection to recognize relatives should be different between two kin categories, PHS and MHS, even though both categories share, on average, the same degree of genetic relatedness. As predicted, we found the highest facial resemblance among those kin probably under the strongest selection for kin recognition. This result indicates that facial resem-blance among relatives may be adaptive because it goes beyond merely reflecting genetic resemblance.
In mandrills, PHS exhibit differentiated social relationships: They are spatially closer and association affords more opportunities for social interactions. This first result is remarkable for a matrilineal society where maternal relatedness profoundly influences female social relationships (22). In captive mandrills, juveniles also show elevated affiliation toward both their adult PHS and their adult MHS; however, they affiliate more with their juvenile MHS than with their juvenile PHS, probably because their social relationships are miti-gated by their common mother at these young ages (15).
If individuals tend to interact more with paternal than maternal relatives, the kinship theory of genomic imprinting, which invokes a mechanism based on epigenetic processes, predicts a differential expression of patrigenic versus matrigenic alleles because of dif-ferent consequences for their respective inclusive fitness (23). In humans, genomic imprinting has been proposed to account for the temporary greater mother-infant facial resemblance compared to fathers through pleiotropic effects. Indeed, maternal genes are expressed preferentially to control resource allocation during fetal development (24). Mother-child early facial resemblance would then be a by- product of genomic imprinting during fetal life, ex-plaining why resemblance to mothers decreases between birth and 1 year of age (25).
We propose that genomic imprinting may also underlie increased facial resemblance among PHS in mandrills. Indeed, facial resem-blance among PHS not only is higher at early ages but also lasts until adulthood and long after their father’s secondary dispersal. This difference between humans and mandrills (maternal resemblance versus paternal resemblance, respectively) may originate from the
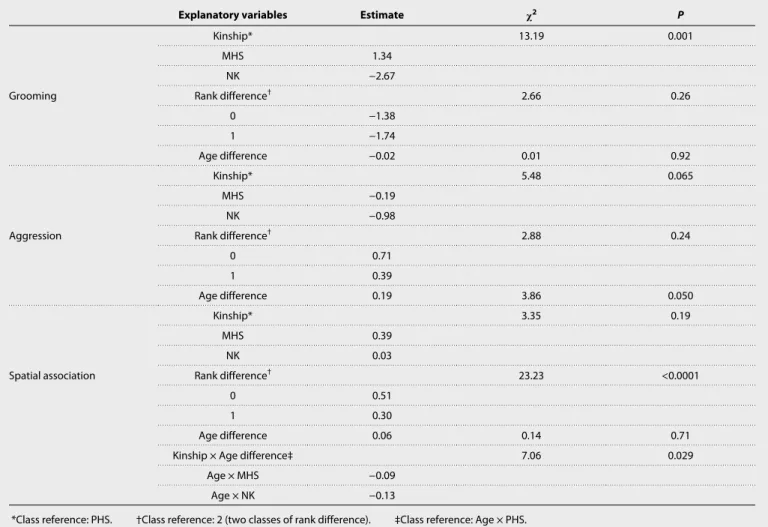
Table 1. Kinship and social behavior. Statistics obtained from generalized linear mixed models (proc GENMOD, SAS Studio) with a negative binomial
distribution performed to study the relationships between social behavior (grooming and aggression) or spatial association recorded across 45 adult females and a set of explanatory variables, including kinship. Rank difference stands for the distance in rank in females from the studied pairs (see Materials and Methods); for example, “0” indicates females of equal rank and “1” indicates pairs composed of a low- and a mid-ranking female or pairs composed of a high- and a mid-ranking female.
Explanatory variables Estimate 2 P
Grooming Kinship* 13.19 0.001 MHS 1.34 NK −2.67 Rank difference† 2.66 0.26 0 −1.38 1 −1.74 Age difference −0.02 0.01 0.92 Aggression Kinship* 5.48 0.065 MHS −0.19 NK −0.98 Rank difference† 2.88 0.24 0 0.71 1 0.39 Age difference 0.19 3.86 0.050 Spatial association Kinship* 3.35 0.19 MHS 0.39 NK 0.03 Rank difference† 23.23 <0.0001 0 0.51 1 0.30 Age difference 0.06 0.14 0.71
Kinship × Age difference‡ 7.06 0.029
Age × MHS −0.09
Age × NK −0.13
*Class reference: PHS. †Class reference: 2 (two classes of rank difference). ‡Class reference: Age × PHS.
on May 29, 2020
http://advances.sciencemag.org/
distinct social organization of mandrills compared to humans. Female mandrills may have many PHS in their group throughout their life; however, most PHS live in different maternal families. This social setting has probably generated intense selection on communicative traits related to the paternal line, allowing paternal kin recognition
and subsequent nepotistic behaviors. In line with this idea, we re-cently showed that genetic relatedness is also encoded in mandrills’ voice (26). These phenotypic cues of relatedness produced differ-entiated behavioral responses: Captive mandrills are able to dis-criminate unfamiliar relatives on the basis of either acoustic (26) or
Fig. 1. Kinship and social behavior. Mean frequencies (and SEM) of social behavior and spatial association across kin categories in 45 adult females over 8 years (2012 to 2019).
The figure is based on raw data: time spent grooming per hour, number of aggressive interactions observed per hour, and frequency of spatial association. Pairwise differences in least square means (LSMEANS statement; SAS Studio) were calculated across kin categories for grooming and aggression. For spatial association, the effect of kinship was found in interaction with females’ age difference (Table 1). However, a closer examination of the data revealed that the same general pattern as the one depicted in the figure was observed across pairs of various age differences. We chose to present the simple effect of kinship for the sake of clarity. Sample sizes (pairs of females) are provided in parentheses.
Fig. 2. Genetic relatedness and face distance. Mean raw face distances (±SD) across the different values of relatedness observed across 38 adult females. For scaling, we
represented the averaged face distance obtained from pictures taken on the same females (i.e., intraindividual resemblance, open diamond). For the sake of clarity and for illustrative purposes, we depicted a regression line based on these averaged relatedness values. SDs are provided rather than SEM to depict the full range of variation of face distances.
on May 29, 2020
http://advances.sciencemag.org/
visual cues (8) alone, although we did not test the impact of parental ancestry (paternal versus maternal lineage) as we do in the present study.
High facial resemblance among PHS may also be a by-product of high resemblance to a common father that may have evolved to facili-tate paternal care. In a polygynous human population, for example, paternal investment is positively correlated to father-child facial re-semblance (27). We think, however, that this explanation does not apply to mandrills because (i) they are highly dimorphic and an adult male does not resemble any other mandrill, (ii) males are only tempo-rary resident in the social group of their offspring, and (iii) evidence
of true paternal care is limited in this species (15). Other selective pressures, such as infanticide or incest avoidance, may also have shaped facial resemblance among PHS as a by-product of resemblance to the father (infanticide) or among mixed-sex pairs of paternal half- siblings (incest avoidance). In primates, however, infanticide is usually mitigated through strategies of paternity confusion (28). We would therefore expect infanticide avoidance to result in lower facial resem-blance among PHS. Regarding incest avoidance, natal male mandrills generally disperse before entering into the competitive reproductive arena (29), making this an equally unlikely explanation. Even though we cannot exclude paternal care or incest avoidance completely
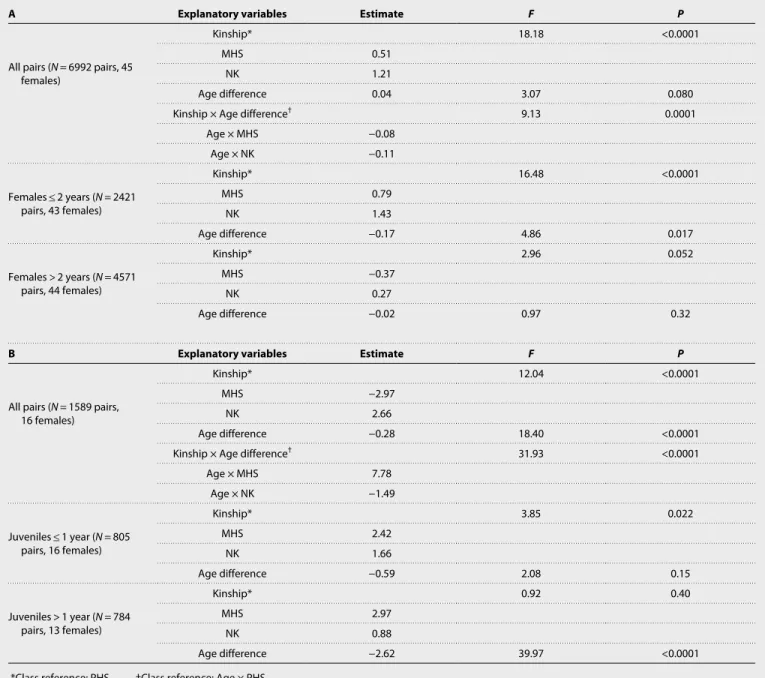
Table 2. Kinship and face distance. Statistics obtained from general linear mixed models (proc GLIMMIX, SAS Studio) performed to study the relationships
between face distances and a set of explanatory variables, including kinship, in (A) all adult female-female pairs of pictures, pairs aged less than 2 years apart, and pairs aged more than 2 years apart; and in (B) all juvenile female-female pairs, pairs aged less than a year apart, and pairs aged more than a year apart.
A Explanatory variables Estimate F P
All pairs (N = 6992 pairs, 45 females)
Kinship* 18.18 <0.0001
MHS 0.51
NK 1.21
Age difference 0.04 3.07 0.080
Kinship × Age difference† 9.13 0.0001
Age × MHS −0.08 Age × NK −0.11 Females ≤ 2 years (N = 2421 pairs, 43 females) Kinship* 16.48 <0.0001 MHS 0.79 NK 1.43 Age difference −0.17 4.86 0.017 Females > 2 years (N = 4571 pairs, 44 females) Kinship* 2.96 0.052 MHS −0.37 NK 0.27 Age difference −0.02 0.97 0.32
B Explanatory variables Estimate F P
All pairs (N = 1589 pairs, 16 females)
Kinship* 12.04 <0.0001
MHS −2.97
NK 2.66
Age difference −0.28 18.40 <0.0001
Kinship × Age difference† 31.93 <0.0001
Age × MHS 7.78 Age × NK −1.49 Juveniles ≤ 1 year (N = 805 pairs, 16 females) Kinship* 3.85 0.022 MHS 2.42 NK 1.66 Age difference −0.59 2.08 0.15 Juveniles > 1 year (N = 784 pairs, 13 females) Kinship* 0.92 0.40 MHS 2.97 NK 0.88 Age difference −2.62 39.97 <0.0001
*Class reference: PHS. †Class reference: Age × PHS.
on May 29, 2020
http://advances.sciencemag.org/
as alternative or additional selection forces, we think that nepotism among philopatric females is the most likely explanation for selection for high facial resemblance among PHS in mandrills. The benefits of differentiated social relationships, such as increased affiliation or proximity, can affect health, reproduction, and survival in multi-ple species, including humans (30), nonhuman primates (31), and other vertebrates (32). For example, female baboons that are socially better integrated enjoy improved offspring survival (31, 33) and live longer (34). These effects appear to be mediated by affiliative inter-actions, such as grooming, which, in addition to hygienic functions (35), decreases cortisol levels of both groomers and groomees (36). Grooming PHS preferentially would therefore increase both the di-rect component of individual fitness (although also true for groom-ing a random groupmate) and the indirect component, as predicted by kin selection.
These results leave us with an open question about the ability of female mandrills to evaluate their own facial resemblance to others [“self-referent phenotype matching” (37)]. Although there is evidence for self-referent phenotype matching in animals (18) and some pri-mates know what they look like (38), a more plausible explanation is that association and behavioral biases among PHS in mandrills are mediated by third parties, such as mothers. If mothers evaluate the facial resemblance of their offspring during juvenescence and, as a consequence, behave differentially with juveniles and/or their mothers, then behavioral biases may persist in these juveniles until adulthood. The fact that the difference in facial resemblance between MHS and PHS is the highest in juvenile females and that MHS are indistin-guishable from NK at these young ages supports this view. Collecting detailed behavioral data on associations among mothers will allow one to test this prediction.
Fig. 3. Kinship and face distance. Mean raw face distances (and SEM) across kin categories for pictures taken on 45 adult and 16 juvenile females at two age differences.
Pairwise differences in least square means (LSMEANS statement; SAS Studio) were calculated across kin-age classes. Sample sizes (pairs of pictures) are provided inside bars. An example of a set of pictures involving one female focal and her three categories of kin is provided. Numbers below the pictures represent the averaged face distance across pictures of the focal female with herself, her PHS, her MHS, and her NK. Photo credits: Jade Meric de Bellefon and Benjamin Laubi, Projet Mandrillus, SODEPAL.
Training
set VGG-Face
Feature activation vectors
VGG-Mandrill SVM Distance metric
VGG-Mandrill Learning set Test set Face identification Face
verification activation vectors Feature
Fig. 4. Pipeline for measuring facial resemblance. The pipeline contains two main steps. During the face identification step, a deep neural network previously trained
for human face recognition (VGG-Face) is retrained to identify mandrill faces. The newly trained network is then used in a face verification task, first to learn a distance metric using a support vector machine (SVM) trained to detect whether two faces represented by their feature activation vectors (i.e., coordinates in the DFS) represent the same individual or not, and then to compute the resemblance (i.e., the distance in the DFS) between pairs of portrait images for the studied population.
on May 29, 2020
http://advances.sciencemag.org/
Last, this study highlights the potential of deep learning for the quantitative investigation of complex animal phenotypes. Faces are a typical example of such phenotypes: They can be described in multiple ways, emphasizing either details such as skin texture or the specific position of a mole or more global features such as the contour roundness. Describing faces has been therefore a historical challenge for both computer scientists and psychologists (39). The explosive popularity of DNNs in face recognition studies originates from their unprecedented capacity to extract the necessary but sufficient infor-mation to describe faces (39). However, beyond faces, DNNs can in-formatively describe any kind of complex phenotypes. Very recently, this approach has been leveraged to study phenotypic evolution from images of collected specimens [e.g., (40)]. With our study, we high-light that DNNs further allow the investigation of phenotypes in field conditions, where standardizing animal’s position for photographs is impossible, thereby opening new research opportunities in evolu-tionary biology with long-lived or endangered species.
MATERIALS AND METHODS Studied population
Since April 2012, we have been monitoring the only habituated social group of free-ranging, not provisioned mandrills inhabiting the Lékédi Park in Southern Gabon (Bakoumba) within the frame-work of the “Mandrillus Project” (www.projetmandrillus.com). This group originates from 65 captive-born mandrills housed at the CIRMF (Centre International de Recherches Médicales de Franceville, Gabon) and released into the park on two occasions [36 individuals released in 2002 and 29 in 2006; see (41) for details]. At the end of this study (June 2019), the group included ca. 220 individuals of both sexes and all ages, about 160 of them being individually known and daily monitored (42). The studied population is vulnerable to predators and pathogens and, since 2012, has not been manipulated except during trappings that occurred occasionally [see (42) for details]. During everyday observations, we typically record detailed data on group living and composition as well as on social behavior. For the purpose of this study, we considered a total of 50 different females in-cluding 16 juveniles (aged 1.3 to 3.8) who contributed to the juvenile dataset of portrait images and 45 adults (aged 4.1 to 26.4) who con-tributed to the adult datasets of portrait images and social behaviors (some juveniles were also included in the adult data set). Dates of birth were either known to a few days thanks to daily monitoring (28 females) or approximated from general condition and patterns of tooth wear (22 females). For most of these later females (70%), the error made in age estimation was less than a year. Removing from our analyses the few females for which the error made was estimated to be more than a year did not change our results (not shown).
Genetic relatedness and kinship
DNA from the 50 studied females was extracted from either blood (46 females) or fecal (4 females) samples. Blood was collected during annual trappings that occurred from 2012 to 2015 [see (8) for details]. Fecal samples were collected on each occasion. DNA extractions either from the buffy coat or from fresh fecal pellets were performed using either QIAamp DNA Blood or Stool Mini Kits (Hilden, Germany), respectively. Microsatellite genotyping was carried out using 12 to 36 primer pairs (14, 43). Paternity analyses were performed with Cervus 3.0 software using previously described procedures (14). We reconstructed the full pedigree of the 16 females born in captivity
going back as far as the generation of unrelated founder animals (14). We genetically determined both parents for 25 individuals out of the 34 females born into the wild. Pairwise genetic relatedness was calculated from the pedigree only for those females with at least the four parents unambiguously known using ENDOG version 4.8 (44). In addition, only these pairs of females with the four parents known served as possible NK. For the remaining nine females, we knew only the mother’s identity (eight females) or the father’s identity (one female) because the genetic sample did not match any adult male or female of the genetic database. We used these nine females to determine PHS or MHS pairs because none of these resulting pairs may have been full siblings (we did not use them when studying the relation-ship between genetic relatedness and facial resemblance). In addi-tion to PHS (sharing the same father) and MHS (sharing the same mother) pairs, we considered as NK these females that shared less than r ≤ 0.0325. We excluded the few full siblings from our datasets and all other more distant kin categories because of our main re-search question.
Behavioral observations
Since August 2012, trained observers, blind to the research question, have performed behavioral observations on 45 adult females (≥4 years) using 5-min focal sampling (totalizing 1776 hours of focal observa-tions; mean per female ± SD: 39.5 ± 41.8). During these focal obser-vations, all social interactions between these females, including time spent grooming and aggressive behavior (grasp, bite, chase, lunge, ground slap, and head bob) considered as bouts, were recorded. In addition to grooming and aggression, we considered spatial associ-ations: Three times during each focal observation, we scanned and recorded all studied females located less than 5 m away from the focal female. We pooled all the behavioral data over the entire study period to improve our statistical models (see below). For these behavioral analyses, we considered 48 pairs of PHS, 23 pairs of MHS, and 64 pairs of NK for which the age difference was ≤6.5 years because, in this dataset, there was no PHS more different in age than this threshold.
Female dominance rank was evaluated using the outcomes of approach-avoidance interactions collected during focal observations or ad libitum observations and calculated using normalized David’s score [as per (42)]. We divided adult females into three classes of rank of similar size across the entire study period (high ranking, medium ranking, and low ranking).
Measuring facial resemblance Image datasets
Our complete database includes ~16,000 portrait images of 276 differ-ent mandrills. This database was split into a learning set and a test set, which are different for the adult female and juvenile female analyses (Fig. 4; see the Supplementary Materials). For the adult fe-male analysis, the learning set included pictures of semicaptive and captive males and females of all age classes (obtained from captive groups), as well as wild individuals from the studied population, ex-cept adult females. For the juvenile analysis, the learning set was the same as above, but it included adult females from the studied popu-lation but excluded juveniles from this popupopu-lation. Because the face of a given individual varies considerably between its different age classes (results not shown), we trained the algorithm to recognize ind-age classes (i.e., individual at a given age class) rather than individual classes. The learning sets were, in turn, split into a validation set
on May 29, 2020
http://advances.sciencemag.org/
(two images per class) and a training set (other images). The valida-tion set was used to compare the accuracy of identificavalida-tion between different parameter settings; however, for measuring resemblance in the test set, we used a DNN trained on the entire learning set. We compared training sets with different levels of image quality and number of images per class (see the Supplementary Materials). The test set included either adult or juvenile females from the study population. All portraits were downsized to 224 × 224 before analyses.
Embedding portrait images into a DFS
We used the popular VGG16 architecture to recognize mandrills individually (Fig. 4). Rather than training the algorithm from scratch (i.e., initializing it with random weights), we used VGG-Face (20) as a starting point and retrained this network with mandrill portraits. This procedure, called “transfer learning,” allows one to reach high model performance even with relatively small datasets (45). VGG-Face is a VGG16 that previously learned to recognize 2600 different humans from a total of 2.6 million portrait pictures. As typical with DNNs, VGG-Face builds representations of faces hierarchically: first, shallow layers represent very simple and local features, for example, skin color and texture; the medium layers combine these features to represent more complex shapes and color patterns such as a pupil; the deeper layers combine previous features to represent an entire face; and the very last layer eventually classifies face images into different ind-age classes (39). Transfer learning exploits the fact that features of shallow layers usually describe universal properties of images and, thus, need no or minimal tuning when used for a new task or with a new data-set (45), contrary to deep features that are task and image specific. For fine-tuning VGG-Face with mandrill images, we thus set a very small (10−5) learning rate for shallow and medium layers and a slightly larger learning rate for deep layers (10−3 decreasing down to 10−5 at
the end of training), and we entirely replaced the last classification layer. Training stopped after approximately 15 epochs (see the Sup-plementary Materials) to produce our new DNN: VGG-Mandrill (Fig. 4). All image analyses were performed using MATLAB.
Distance metric learning
Facial resemblance can be estimated by simply measuring the dis-tance between images embedded in the DFS. However, not all features defining the DFS are similarly good for estimating facial resemblance. Following a method developed earlier (21), we learned a resemblance metric that calculates the weights of features that optimize a face verification task. We first extracted the feature activation vector (i.e., the coordinates in the DFS) of all images of the training set in the DFS of VGG-Mandrill. Next, we randomly selected 15,000 pairs of im-ages representing different individuals and 15,000 pairs representing the same individuals, and for each of pair, we calculated the 2 differ-ence (f1[i] − f2[i])2/(f1[i] + f2[i]), where f1 and f2 are the feature activation
vectors of the two images and i is the feature index (the 2 difference has the same dimensionality as feature activation vectors). Then, we run a linear support vector machine (SVM) with the 2 difference vectors in explanatory variables and 0 (different-individual pairs) or 1 (same-individual pairs) as a response variable. This SVM output feature weights i, which were used to calculate a weighted 2
dis-tance as 2(f1,f2) = Rii(f1[i] − f2[i])2/(f1[i] + f2[i]). We calculated the
weighted 2 distance between all pairs of images in the test sets. Studied pairs and validation
To study facial resemblance in adult females, we considered 50 pairs of PHS, 30 pairs of MHS, and 79 pairs of NK for which the age dif-ference was ≤9.3 years because, in this dataset, there was no PHS more different in age than this threshold. In juvenile females, we
studied 16 pairs of PHS, 5 pairs of MHS, and 27 pairs of NK for which the age difference was ≤1.8 years for the same reason. We checked that intraindividual facial resemblance (identical female with photographs taken at various ages) was greater than any other pairs analyzed (table S7).
Statistical analyses Kinship and sociality
To study the relationship between kinship and social behavior, we summarized 8 years of data collected on a monthly basis. Each month, from August 2012 to June 2019, we considered all possible pairs among the 45 studied adult females when we had collected at least one focal sample (for grooming and aggression) or recorded at least one spatial association for each female of the pair (for associa-tion). The final monthly dataset contained a large majority of zeros; we therefore pooled these data across the years and for each studied pair to improve our statistical models. We used generalized linear models (proc GENMOD, SAS Studio) with a negative binomial dis-tribution to study the relationships between time spent grooming (in seconds), number of aggression, and number of associations along with a set of explanatory variables. We considered as an offset the log-transformed total time of observation or the log-transformed total number of scans performed during the study period on each female of the pair, to adjust for variation in sampling effort. We considered the following as explanatory variables: the difference in social rank between the two females of the pair (class variable with three modalities: no rank difference; rank difference of one, corre-sponding to the difference between low- and mid-ranking females or between high- and mid-ranking females; and rank difference of two, corresponding to the difference between low- and high-ranking females) and the absolute difference in age between the two females of the pair (continuous variable) and their kinship (class variable with three modalities: PHS, MHS, and NK). We further considered the interaction between difference in age and kinship to control for possible combined effects. We kept full models as final models excluding only the interaction when not significant.
Genetic and facial resemblance
To study the relationship between genetic relatedness and facial resemblance (considered as a distance) calculated from pairs of photographs taken on 38 adult females with at least both parents known, we used general linear mixed models (proc GLIMMIX, SAS Studio) with face distance as a response variable and the following explanatory variables. We considered the genetic relatedness of each pair (continuous variable ranging from 0.016 and 0.656) and the absolute difference in age between the two females of the pair (con-tinuous variable). We further considered the interaction between difference in age and genetic relatedness to control for possible combined effects. The identity of the pair was considered as a random factor to control for the possible non-independency of the data. We kept the full model as the final model excluding only the interaction when not significant.
Kinship and facial resemblance
To study the relationship between kinship and facial resemblance (considered as a distance) calculated from pairs of photographs taken on 45 adult and on 16 juvenile females, we used general linear mixed models (proc GLIMMIX, SAS Studio) with face dis-tance as a response variable and the following explanatory variables. We considered the kinship of each pair (class variable with three modalities: PHS, MHS, and NK) and the absolute difference in
on May 29, 2020
http://advances.sciencemag.org/
age between the two females of the pair (continuous variable). We further considered the interaction between difference in age and kinship to control for possible combined effects. Because we found a significant effect of this interaction on face distances in both adult and juvenile females, we repeated our analyses across different age differences to determine when this interaction is no longer significant (see Results). The identity of the pair was considered as a random factor to control for the possible non-independency of the data. We kept the full models as final models excluding only the interaction when not significant.
SUPPLEMENTARY MATERIALS
Supplementary material for this article is available at http://advances.sciencemag.org/cgi/ content/full/6/22/eaba3274/DC1
View/request a protocol for this paper from Bio-protocol.
REFERENCES AND NOTES
1. W. D. Hamilton, The genetical evolution of social behaviour I. J. Theor. Biol. 7, 1–52 (1964).
2. A. S. Griffin, S. A. West, Kin selection: Fact and fiction. Trends Ecol. Evol. 17, 15–21 (2002).
3. T. Clutton-Brock, Breeding together: Kin selection and mutualism in cooperative vertebrates. Science 296, 69–72 (2002).
4. M. J. Sheehan, E. A. Tibbetts, Specialized face learning is associated with individual recognition in paper wasps. Science 334, 1272–1275 (2011).
5. M. J. Sheehan, M. W. Nachman, Morphological and population genomic evidence that human faces have evolved to signal individual identity. Nat. Comm. 5, 4800 (2014).
6. J. B. Cole, M. Manyama, J. R. Larson, D. K. Liberton, T. M. Ferrara, S. L. Riccardi, M. Li, W. Mio, O. D. Klein, S. A. Santorico, B. Hallgrímsson, R. A. Spritz, Human facial shape and size heritability and genetic correlations. Genetics 205, 967–978 (2017). 7. D. Tsagkrasoulis, P. Hysi, T. Spector, G. Montana, Heritability maps of human face
morphology through large-scale automated three-dimensional phenotyping. Sci. Rep. 7, 45885 (2017).
8. M. J. E. Charpentier, M. Harté, B. Ngoubangoye, A. Herbert, P. M. Kappeler, Visual discrimination of kin in mandrills. Ethology 123, 251–259 (2017).
9. D. Pfefferle, A. J. N. Kazem, R. R. Brockhausen, A. V. Ruiz-Lambides, A. Widdig, Monkeys spontaneously discriminate their unfamiliar paternal kin under natural conditions using facial cues. Curr. Biol. 24, 1806–1810 (2014).
10. G. Kaminski, S. Dridi, C. Graff, E. Gentaz, Human ability to detect kinship in strangers’ faces: Effects of the degree of relatedness. Proc. Biol. Sci. 276, 3193–3200 (2009).
11. A. Alvergne, E. Huchard, D. Caillaud, M. J. E. Charpentier, J. M. Setchell, C. Ruppli, D. Féjan, L. Martinez, G. Cowlishaw, M. Raymond, Human ability to visually recognize kin within primates. Int. J. Primatol. 30, 199–210 (2009).
12. A. J. N. Kazem, A. Widdig, A, Visual phenotype matching: Cues to paternity are present in rhesus macaque faces. PLOS ONE 8, e55846 (2013).
13. A. Widdig, The impact of male reproductive skew on kin structure and sociality in multi-male groups. Evol. Anthropol. 22, 239–250 (2013).
14. M. Charpentier, P. Peignot, M. Hossaert-McKey, O. Gimenez, J. M. Setchell, E. J. Wickings, Constraints on control: Factors influencing reproductive success in male mandrills (Mandrillus sphinx). Behav. Ecol. 16, 614–623 (2005).
15. M. J. E. Charpentier, P. Peignot, M. Hossaert-McKey, J. E. Wickings, Kin discrimination in juvenile mandrills Mandrillus sphinx. Anim. Behav. 73, 37–45 (2007).
16. S. C. Alberts, Paternal kin discrimination in wild baboons. Proc. Biol. Sci. 266, 1501–1506 (1999).
17. A. Widdig, P. Nürnberg, M. Krawczak, W. J. Streich, F. B. Bercovitch, Paternal relatedness and age-proximity regulate social relationships among adult female rhesus macaques.
Proc. Natl. Acad. Sci. U.S.A. 98, 13769–13773 (2001).
18. A. Widdig, Paternal kin discrimination: The evidence and likely mechanisms. Biol. Rev.
Camb. Philos. Soc. 82, 319–334 (2007).
19. M. Cords, T. Minich, S.-J. Roberts, C. Sleator, Evidence for paternal kin bias in the social affiliation of adult female blue monkey. Am. J. Primatol. 80, e22761 (2018).
20. O. M. Parkhi, A. Vedaldi, A. Zisserman, Deep face recognition, in Proceedings of the British
Machine Vision Conference (BMVC), X. Xie, M. W. Jones, G. K. L. Tam, Eds. (BMVA Press, 2015),
pp. 41.1–41.12.
21. Y. Taigman, M. Yang, M. A. Ranzato, L. Wolf, DeepFace: Closing the gap to human-level performance in face verification, in 2014 IEEE Conference on Computer Vision and Pattern
Recognition (IEEE, 2014), pp. 1701–1708.
22. J. B. Silk, Kin selection in primate groups. Int. J. Primatol. 23, 849–875 (2002). 23. D. Haig, Genomic Imprinting and Kinship (Rutgers Univ. Press, 2002). 24. T. Moore, D. Haig, Genomic imprinting in mammalian development: A parental
tug-of-war. Trends Genet. 7, 45–49 (1991).
25. D. K. McLain, D. Setters, M. P. Moulton, A. E. Pratt, Ascription of resemblance of newborns by parents and nonrelatives. Evol. Hum. Behav. 21, 11–23 (2000).
26. F. Levréro, G. Carrete-Vega, A. Herbert, I. Lawabi, A. Courtiol, E. Willaume, P. M. Kappeler, M. J. E. Charpentier, Social shaping of voices does not impair phenotype matching of kinship in mandrills. Nat. Comm. 6, 7609 (2015).
27. A. Alvergne, C. Faurie, M. Raymond, Father-offspring resemblance predicts paternal investment in humans. Anim. Behav. 78, 61–69 (2009).
28. M. Heistermann, T. Ziegler, C. P. van Schaik, K. Launhardt, P. Winkler, J. K. Hodges, Loss of oestrus, concealed ovulation and paternity confusion in free-ranging Hanuman langurs. Proc. Biol. Sci. 268, 2445–2451 (2001).
29. K. A. Abernethy, L. J. T. White, E. J. Wickings, Hordes of mandrills (Mandrillus sphinx): Extreme group size and seasonal male presence. J. Zool. 258, 131–137 (2002). 30. J. Holt-Lunstad, T. B. Smith, J. B. Layton, Social relationships and mortality risk:
A meta-analytic review. PLOS Med. 7, e1000316 (2010).
31. J. B. Silk, S. C. Alberts, J. Altmann, Social bonds of female baboons enhance infant survival. Science 302, 1231–1234 (2003).
32. M. Busson, M. Authier, C. Barbraud, P. Tixier, R. R. Reisinger, A. Janc, C. Guinet, Role of sociality in the response of killer whales to an additive mortality event. Proc. Natl Acad.
Sci. U.S.A. 116, 11812–11817 (2019).
33. D. L. Cheney, J. B. Silk, R. M. Seyfarth, Network connections, dyadic bonds and fitness in wild female baboons. R. Soc. Open Sci. 3, 160255 (2016).
34. E. A. Archie, J. Tung, M. Clark, J. Altmann, S. C. Alberts, Social affiliation matters: Both same-sex and opposite-sex relationships predict survival in wild female baboons.
Proc. Biol. Sci. 281, 20141261 (2014).
35. M. Y. Akinyi, J. Tung, M. Jeneby, N. B. Patel, J. Altmann, S. C. Alberts, Role of grooming in reducing tick load in wild baboons (Papio cynocephalus). Anim. Behav. 85, 559–568 (2013).
36. K. Shutt, A. MacLarnon, M. Heistermann, S. Semple, Grooming in Barbary macaques: Better to give than to receive? Biol. Lett. 3, 231–233 (2007).
37. M. E. Hauber, P. W. Sherman, Self-referent phenotype matching: Theoretical considerations and empirical evidence. Trends Neurosc. 24, 609–616 (2001). 38. M. D. Hauser, J. Kralik, C. Botto-Mahan, M. Garrett, J. Oser, Self-recognition in primates:
Phylogeny and the salience of species-typical features. Proc. Natl. Acad. Sci. U.S.A. 92, 10811–10814 (1995).
39. M. Wang, W. Deng, Deep face recognition: A survey. arXiv:1804.06655 [cs.CV] (2018). 40. J. F. H. Cuthill, N. Guttenberg, S. Ledger, R. Crowther, B. Huertas, Deep learning
on butterfly phenotypes tests evolution’s oldest mathematical model. Sci. Adv. 5, eaaw4967 (2019).
41. P. Peignot, M. J. E. Charpentier, N. Bout, O. Bourry, U. Massima, O. Dosimont, R. Terramorsi, E. J. Wickings, Learning from the first release project of captive-bred mandrills Mandrillus sphinx in Gabon. Oryx 42, 122–131 (2008).
42. C. Poirotte, F. Massol, A. Herbert, E. Willaume, M. Bomo, P. M. Kappeler, M. J. E. Charpentier, Mandrills use olfaction to socially avoid parasitized conspecifics. Sci. Adv. 3, e1601721 (2017).
43. L. Benoit, S. Mboumba, E. Willaume, P. M. Kappeler, M. J. E. Charpentier, Using next-generation sequencing methods to isolate and characterize 24 simple sequence repeat loci in mandrills (Mandrillus sphinx). Conserv. Genet. Resour. 6, 903–905 (2014). 44. J. P. Gutiérrez, F. Goyache, A note on ENDOG: A computer program for analysing
pedigree information. J. Anim. Breed. Genet. 122, 172–176 (2005).
45. J. Yosinski, J. Clune, Y. Bengio, H. Lipson. How transferable are features in deep neural networks? in Advances in Neural Information Processing Systems 27, Z. Ghahramani, M. Welling, C. Cortes, N. D. Lawrence, K. Q. Weinberger, Eds. (Curran Associates, Inc., 2014), pp. 3320–3328.
46. D. Masters, C. Luschi, Revisiting small batch training for deep neural networks. arXiv:1804.07612 [cs.LG] (2018).
47. L. Perez, J. Wang, The effectiveness of data augmentation in image classification using deep learning. arXiv:1712.04621 [cs.CV] (2017).
48. R. Zhang, P. Isola, A. A. Efros, E. Shechtman, O. Wang, The unreasonable effectiveness of deep features as a perceptual metric, in Proceedings of the 2018 IEEE/CVF Conference on
Computer Vision and Pattern Recognition (IEEE, 2018), pp. 586–595.
Acknowledgments: We are grateful to past and present field assistants of the Mandrillus
Project who collect daily behavioral data on the study population; to the Wildlife Reserves of Singapore, the Zoo of Granby, and the Primatological Centre at CIRMF (Gabon) for providing
on May 29, 2020
http://advances.sciencemag.org/
pictures of their mandrills; and to the SODEPAL-COMILOG society (ERAMET group) for their long-term logistical support and contribution to the Mandrillus Project. This is a Project Mandrillus publication number 22 and ISEM 2020-044-SUD. Funding: This study was funded by several grants that allowed long-term collection of data: Deutsche
Forschungsgemeinschaft (DFG, KA 1082-20-1) to P.M.K. and M.J.E.C., SEEG Lékédi (INEE-CNRS) to M.J.E.C., and Agence Nationale de la Recherche (ANR SLEEP 17-CE02-0002) to M.J.E.C. This study was approved by an authorization from the CENAREST institute (permit number, AR0060/18/MESRS/CENAREST/CG/CST/CSAR). Author contributions: M.J.E.C. and J.P.R. designed the study and wrote the first version of the manuscript; J.M.d.B., B.L., M.H., C.P., and P.M.K. collected behavioral and photographic data; M.H. and M.J.E.C. performed genetic analyses; J.P.R. performed deep neural network analyses; and M.J.E.C. performed the statistical analyses. All authors contributed to writing the article. Competing interests: The authors declare that they have no competing interests. Data and materials availability: All
data needed to evaluate the conclusions in the paper are present in the paper and/or the Supplementary Materials. Additional data related to this paper may be requested from the authors. The Mandrillus Face Database and the computer codes that support the findings of this study are available on request from the corresponding author.
Submitted 23 November 2019 Accepted 20 March 2020 Published 27 May 2020 10.1126/sciadv.aba3274
Citation: M. J. E. Charpentier, M. Harté, C. Poirotte, J. M. de Bellefon, B. Laubi, P. M. Kappeler, J. P. Renoult, Same father, same face: Deep learning reveals selection for signaling kinship in a wild primate. Sci. Adv. 6, eaba3274 (2020).
on May 29, 2020
http://advances.sciencemag.org/
DOI: 10.1126/sciadv.aba3274 (22), eaba3274.
6 Sci Adv
ARTICLE TOOLS http://advances.sciencemag.org/content/6/22/eaba3274
MATERIALS
SUPPLEMENTARY http://advances.sciencemag.org/content/suppl/2020/05/21/6.22.eaba3274.DC1
REFERENCES
http://advances.sciencemag.org/content/6/22/eaba3274#BIBL
This article cites 40 articles, 9 of which you can access for free
PERMISSIONS http://www.sciencemag.org/help/reprints-and-permissions
Terms of Service
Use of this article is subject to the
is a registered trademark of AAAS.
Science Advances
York Avenue NW, Washington, DC 20005. The title
(ISSN 2375-2548) is published by the American Association for the Advancement of Science, 1200 New
Science Advances
License 4.0 (CC BY-NC).
Science. No claim to original U.S. Government Works. Distributed under a Creative Commons Attribution NonCommercial Copyright © 2020 The Authors, some rights reserved; exclusive licensee American Association for the Advancement of
on May 29, 2020
http://advances.sciencemag.org/