HAL Id: hal-02894274
https://hal.umontpellier.fr/hal-02894274
Submitted on 8 Jul 2020
HAL is a multi-disciplinary open access
archive for the deposit and dissemination of sci-entific research documents, whether they are pub-lished or not. The documents may come from teaching and research institutions in France or abroad, or from public or private research centers.
L’archive ouverte pluridisciplinaire HAL, est destinée au dépôt et à la diffusion de documents scientifiques de niveau recherche, publiés ou non, émanant des établissements d’enseignement et de recherche français ou étrangers, des laboratoires publics ou privés.
Guila Ganem, Claire Marie Soleil Dufour, Nico Avenant, Pierre Caminade,
Seth Eiseb, Christelle Tougard, Neville Pillay
To cite this version:
Guila Ganem, Claire Marie Soleil Dufour, Nico Avenant, Pierre Caminade, Seth Eiseb, et al.. An update on the distribution and diversification of Rhabdomys sp. (Muridae, Rodentia). Northwestern naturalist : a journal of vertebrate biology, BioOne (Northwestern Naturalist);JSTOR, 2020, 69 (2), pp.1. �10.25225/jvb.20013�. �hal-02894274�
Guila GANEM1,2*, CLAIRE Marie Soleil DUFOUR1,2,3, Nico L. AVENANT4, Pierre CAMINADE1,
Seth J. EISEB5,6, Christelle TOUGARD1 and Neville PILLAY2
1 ISEM, Université de Montpellier, CNRS, EPHE, IRD, Montpellier, France;
e-‐‑mail: guila.ganem@umontpellier.fr,pierre.caminade@umontpellier.fr, christelle.tougard@umontpellier.fr
2 School of Animal, Plant and Environmental Science, University of the Witwatersrand, P/Bag 3, 2050 Wits,
South Africa; e-‐‑mail: Neville.Pillay@wits.ac.za
3 Centre of Functional and Evolutionary Ecology, CNRS, University of Montpellier, IRD, EPHE,
Montpellier, France; e-‐‑mail: clairems.dufour@gmail.com
4 Department of Mammalogy, National Museum and Centre for Environmental Management,
University of the Free State, Bloemfontein, South Africa; e-‐‑mail: navenant@nasmus.co.za
5 Department of Biological Sciences, Faculty of Science, University of Namibia, Private bag 13301,
Windhoek, Namibia; e-‐‑mail: seiseb@unam.na
6 National Museum of Namibia, P.O. Box 1203, Windhoek, Namibia
Received 5 February 2020; Accepted 4 May 2020; Published online
Abstract. During the last two decades, genotyping of African rodents has revealed important hidden diversity within
morphologically cryptic genera, such as Rhabdomys. Although the distribution of Rhabdomys is known historically, its diversity has been revealed only recently, and information about the distribution range of its constituent taxa is limited. The present study contributes to clarifying the distribution of Rhabdomys taxa, primarily in southern Africa, and identifies gaps in our knowledge, by: 1) compiling the available information on its distribution; and 2) significantly increasing the number of geo-‐‑localised and genotyped specimens (n = 2428) as well as the localities (additional 48 localities) sampled. We present updated distribution maps, including the occurrence and composition of several contact zones. A long-‐‑term monitoring of three contact zones revealed their instability, and raises questions as to the role of demography, climate, and interspecific competition on species range limits. Finally, an analysis of external morphological traits suggests that tail length may be a reliable taxonomic trait to distinguish between mesic and arid taxa of Rhabdomys. Tail length variation in
Rhabdomys and other rodents has been considered to be an adaptation to climatic (thermoregulation) and/or to habitat
(climbing abilities) constraints, which has still to be confirmed in Rhabdomys.
Key words: range limits, contact zones, tail length, Africa, COI
Introduction
Rhabdomys, the African four-‐‑striped mouse, occurs in environmentally diverse geographical regions,
from southern to eastern Africa. The genus displays marked morphological polymorphism (Skinner & Chimimba 2005), leading several authors to distinguish up to 20 subspecies in southern Africa based on traits such as tail length and pelage colouration (Roberts 1951, Rambau et al. 2003). The first genetic study involving Rhabdomys populations across South Africa, based on allozymes (Mahida et al. 1999), suggested low levels of gene flow between distant populations and some geographical subgroupings. However, it did not provide substantial evidence to distinguish different lineages or to assign groups to different sub-‐‑groups (for instance, chromosomal races 2n = 46 and 2n = 48; Taylor 2000). Yet, laboratory crosses between individuals from geographically extreme populations, showed remarkably low reproductive success, at least partly due to aggression (Pillay 2000), suggesting the occurrence of reproductive barriers.
The diversity of the genus was first demonstrated in 2003 with the publication of the first phylogeny based on a mitochondrial marker (sequences of complete cytochrome b gene; cytb) coupled with karyotyping (Rambau et al. 2003). Rambau et al. (2003) identified two major clades, R.
pumilio and R. dilectus, which were later confirmed by additional studies that revealed more
complex hidden diversity within R. dilectus (Castiglia et al. 2011, Sabuni et al. 2018, Krásová et al. unpublished), and R. pumilio (du Toit et al. 2012). Based on a Bayesian relaxed molecular clock, radiation of Rhabdomys (3.09-‐‑4.30 MYA) is thought to coincide with paleoclimatic changes characterising the Miocene/Pliocene boundary (du Toit et al. 2012). The oldest known fossil of
Rhabdomys (around 5 MYA, i.e. prior to the radiation in the genus) was found in Langebaanweg in
the Western Cape Province of South Africa (Denys 1999), suggesting a southern origin (Castiglia et al. 2011). The most recent fossil of the genus (around 3.3 MYA, i.e. concomitant with or after radiation in the genus) was found in the Limpopo Province in the north-‐‑east of South Africa (see references in Monadjem et al. 2015) providing a minimum date for the north-‐‑east expansion of the genus from its putative south-‐‑western origin.
Currently, based on the available genetic studies, Rhabdomys is subdivided into two “environmental” groups, a semi-‐‑arid group comprising four taxa with distinct distributions: R.
bechuanae, R. intermedius and R. pumilio coastal A (hereafter R. pumilio) as well as R. pumilio coastal B
(du Toit et al. 2012), and a mesic group comprising of R. dilectus chakae and R. d. dilectus (Rambau et al. 2003), with the latter showing further chromosomal and genetic diversification in eastern Africa (Castiglia et al. 2011, Sabuni et al. 2018) and Angola (Krásová et al. unpublished). The two mesic taxa are considered as distinct species by some authors (Monadjem et al. 2015). To date, all these taxa are morphologically cryptic and can be identified based on mitochondrial markers (e.g. cytochrome c oxidase I gene; COI), although we acknowledge that species delimitation based exclusively on mitochondrial markers need to be considered with caution.
Long considered as an opportunistic and generalist genus, we know now that Rhabdomys taxa, having diversified in allopatry, occupy distinct environmental niches (du Toit et al. 2012, Ganem et al. 2012, Meynard et al. 2012). Moreover, at least some of these taxa show distinct habitat and microhabitat preferences (Mackay 2011, Dufour et al. 2015) and display distinct social behaviour (Schradin & Pillay 2005, Dufour et al. 2019).
To understand the mechanisms behind the ecological radiation of Rhabdomys, a reliable description of its distribution is required. Hence, the aims of the present study were to: 1) describe the distribution of Rhabdomys taxa using verified data of the subgroups from the literature as well as original data, and identify gaps in our knowledge; 2) locate areas of overlap between taxa (hereafter contact zones); 3) re-‐‑evaluate some morphological features (i.e. tail and head-‐‑and-‐‑body lengths) that were used as taxonomic characters to distinguish between non-‐‑genotyped Rhabdomys taxa (Roberts 1951); and 4) provide preliminary evidence of its genetic diversity. By locating contact zones between Rhabdomys species, we aimed to identify geographical contexts where evolutionary and ecological processes can be investigated in natural conditions, to provide a basis for future studies of shifts in the position of contact zones (Taylor et al. 2015), and to gain insight into how interspecies interactions and physiological requirements of species impact their range boundaries.
Material and Methods
Striped mice were sampled between 2007 and 2019 at localities in South Africa and Namibia. They were captured using Sherman and PVC type live traps, baited with a mixture of peanut-‐‑butter and oats, as well as a piece of cotton wool for comfort and insulation. The trapping location coordinates of mice were recorded with a handheld GPS (Dakota 10, Garmin International, Kansas, USA, or similar). The project received appropriate ethical clearances (French: C34-‐‑264; CEEA-‐‑LR-‐‑12149; 20160216092917#8915v2; South African: AESC 2012/13/2A) and trapping permits (see acknowledgements).
All mice were sexed and their reproductive status, body and tail lengths and mass recorded upon capture. A small piece of tail (~1cm) was snipped for genotyping and was preserved in 90% ethanol. In total, 2428 individuals from 48 localities were georeferenced and genotyped (either by sequencing or by PCR-‐‑RFLP typing, see below). In order to provide the most complete information on the distribution of the different taxa, published data were also included in this study, as well as unpublished data kindly obtained from colleagues (see acknowledgements) that provided data for an additional 136 genotyped individuals from 87 georeferenced localities. Maps throughout this article were created using QGIS® software version 3.10.2.
Three of the localities that we identified as contact zones were sampled on several occasions to monitor variation in the relative frequency of co-‐‑occurring taxa. The complete data set used for the distribution is available at doi: 10.15148/0d1b3414-‐‑7e2a-‐‑11ea-‐‑a38d-‐‑00163e26bfb0. Finally, we compiled occurrence data of non-‐‑genotyped Rhabdomys from museum collections (as in Meynard et al. 2012) to map the complete range of the genus. The sources are as follows: South Africa: Ditsong National Museum of Natural History, Pretoria; Iziko South African Museum, Cape Town; Durban Natural Science Museum; McGregor Museum, Kimberley; National Museum, Bloemfontein. Namibia: National Museum of Namibia, Windhoek. France: Natural History Museum, Paris. Belgium: Africa Museum. USA: National Museum of Natural History, Washington.
Morphological measurements
Data reported here involves exclusively adult animals. Trapped mice were weighed (to the nearest 0.5 g) and their head-‐‑and-‐‑body and tail length measured (to the nearest millimetre) from the tip of the snout to the anus for the former and from the start of the tail till the end of the last vertebrae for the latter. Because our sample of R. d. chakae was small (measures for one population of nine individuals), we also included data obtained from the National Museum, Bloemfontein (NMB). However, the museum data were obtained from preserved animals. Further, although the head-‐‑ and-‐‑body length was measured following the same criterion as in the current study, the tail length was measured from the anus till the end of the last vertebrae. Hence, compared to the NMB measurements, body and tails measured in live animals (our study) would have been shorter.
Because several collectors contributed to the measurements over the years (both in our study and the NMB), and because the museum-‐‑derived data comprised of dead animals (vs. live animals in our study) as well as a different tail length measurement criteria, we decided not to apply statistical analyses on the complete data set but instead compiled the information to provide an indication of morphological variation in the genus. Nevertheless, we statistically analysed (Wilcoxon sum of ranks test) data collected by a single person (G. Ganem) in November 2011 from Sandveld Nature Reserve contact zone for 36 R. d. dilectus and 59 R. bechuanae for morphological comparisons between these taxa. We also applied a General Linear Model (GLM) on the complete data set of this
study (excluding NMB data), on the ratio of tail to body size (to normalise the variable distribution), considering “data collector” as a random factor, and mass as a covariate while testing differences between taxa (fixed factor). The residuals of the model reasonably approached a normal distribution. All statistics were performed with JMP 10 (SAS Institute Inc., Cary, NC).
DNA analyses
Tissue samples of Rhabdomys specimens were taken from 2428 individuals corresponding to R.
bechuanae, R. dilectus (subspecies R. d. chakae and R. d. dilectus), R. intermedius, R. pumilio and R. pumilio coastal B. DNA extractions were performed with NucleoMag® Tissue kit from Macherey-‐‑
Nagel with a KingFisher™ Flex Purification System. A fragment of COI was PCR-‐‑amplified (Tm = 60°) using the following primers: new F 5′-‐‑ATTGTAACAGCCCACGCATT-‐‑3′ and new Rg 5′-‐‑ CCTAAGGCTCATAGTATGGCTGG-‐‑3′ (this study). Direct sequencing of the COI fragment was then done in one direction through the technical facilities of the genotyping and sequencing platform (https://genseq.umontpellier.fr/WordPress/) of the Institute of Evolutionary Sciences (ISEM, Montpellier, France). Newly produced sequences (1756 individuals) were aligned by hand using MEGA v7 (Kumar et al. 2016). The sequence dataset was completed by all Rhabdomys COI haplotype sequences available from GenBank (du Toit et al. 2012, 2013). Using a PCR-‐‑RFLP approach (Restriction Fragments Lengths Polymorphism based on restriction of PCR products), another 672 individuals were genotyped. RFLP is based on difference in homologous DNA sequences that can be detected by the presence of fragments of different lengths after digestion of
the DNA samples in question with specific restriction enzymes
(https://www.ncbi.nlm.nih.gov/probe/docs/techrflp/).
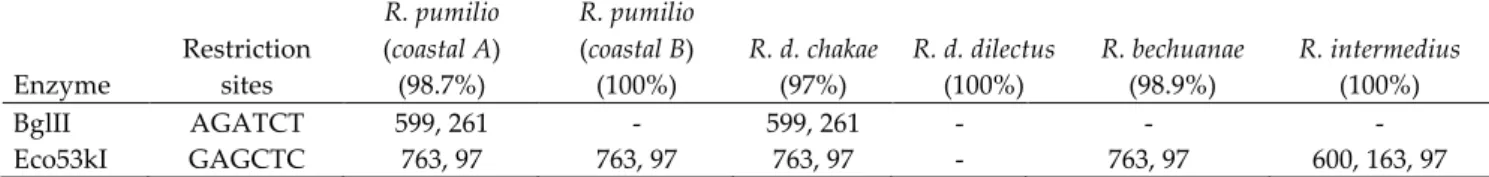
The general procedure was as follows: 1 µμl of COI PCR-‐‑product was digested for 12 hours at 37°C with 0.2 µμl of BgIII and 0.1 µμl of Eco53KI enzymes (New England Biolabs), followed by a verification of the digestion results by electrophoresis on a 2% agarose gel (Table 1). We developed the RFLP method because it was particularly cost-‐‑effective for long-‐‑term population studies involving large number of mice (RFLP genotyping: 0.15 €/sample, sequencing: 5 €/sample).
Phylogenetic reconstruction and genotype analyses
Due to the large number of individuals involved in the present study, phylogenetic analyses were conducted on the haplotype sequences obtained with DnaSP v5.10.01 (Librado & Rozas 2009). Analyses were performed on the Platform “Montpellier Bioinformatics Biodiversity” of ISEM (http://mbb.univ-‐‑montp2.fr/MBB/index.php). Tree topologies were obtained using a maximum likelihood (ML) approach with PhyML v3.0 (Guindon et al. 2010) and Bayesian inference (BI) with Mr Bayes v3.1.2 (Ronquist & Huelsenbeck 2003). The appropriate model of nucleotide substitution was identified with MrModeltest v2.3 (Nylander 2004). ML and BI reconstructions were conducted under the GTR model (Yang 1994) with a proportion of invariable sites and a gamma distribution. Node robustness in ML was estimated by bootstrap percentages (BP) after 1000 pseudo-‐‑replicates, whereas it was estimated in BI with posterior probabilities (PP) obtained from the 50% majority rule
consensus of trees sampled every 100th generation once five Markov chain Monte Carlo samplings
were run simultaneously for five million generations and after removing the first 25000 trees as burn-‐‑in.
Population structure was evaluated with a median-‐‑joining network of Rhabdomys haplotypes constructed with PopART (Leigh & Bryant 2015) according to the country of origin, except for South
Africa for which the provincial locations were considered in the analyses. We also compared the network of haplotypes of co-‐‑occurring taxa in three contact zone localities that yielded the largest number of sequenced individuals (Soetdoring Nature Reserve, Sandveld Nature Reserve, and Tussen die Riviere Game Reserve, all in the Free State Province, South Africa) through minimum spanning networks also with PopART.
Genetic diversity and demographic history
Indices of genetic diversity, including the number of nucleotide (n) and haplotypes (nh) per (sub) species, and the nucleotide (π) and haplotype (h) diversities, were obtained using DnaSP. Demographic history (population stability or expansion) of the (sub) species was also investigated with DnaSP from mismatch distribution and three neutrality tests (Fu'ʹs Fs, Tajima'ʹs D statistic and
R2 test; Tajima 1989, Fu 1997, Ramos-‐‑Onsins & Rozas 2003). In the case of mismatch, demographic
stability is illustrated by multimodal distributions, while a unimodal pattern is consistent with sudden expansion (Slatkin & Hudson 1991). In the case of neutrality tests, significant values are expected in cases of population expansion (p < 0.05). A taxon follows the demographic expansion model when results from at least two tests are found to be significant.
Results
Rhabdomys distribution
We used all available occurrence data of Rhabdomys to generate a complete distribution map of the genus (Fig. 1), and superimposed the identity of specimens that were genotyped with the available genetic markers (the mitochondrial cytb or COI genes). The results indicate that R. intermedius and
R. pumilio coastal B are endemic to South Africa, while R. d. chakae occurs both in South Africa and
Lesotho, and R. bechuanae and R. pumilio both occur in Namibia and South Africa. The distribution of R. d. dilectus appears to be fragmented over its entire range. Specifically, in South Africa the distribution of R. d. dilectus is a mosaic interspersed with pockets of R. d. chakae populations. The South African R. d. dilectus type extends into Zimbabwe, while other taxa of R. d. dilectus are found in eastern Africa and Angola (Castiglia et al. 2011, Sabuni et al. 2018, Krásová et al. unpublished). The results also show the paucity of information available for Rhabdomys taxa distribution in Zimbabwe, Eswatini, Botswana and its south-‐‑eastern limit with South Africa. Finally, we also identified gaps in our knowledge over large areas of Namibia, the central plateau of South Africa and Eastern Cape and northern KwaZulu-‐‑Natal provinces (Fig. 1).
Rhabdomys bechuanae appears as the most widespread Rhabdomys species in Namibia, while the
distribution of R. pumilio ranges from the western coastal areas of South Africa to southern Namibia, and we report here the presence of a large population of R. pumilio on the Namibian side of the Orange River, indicating that the two semi-‐‑arid species, R. bechuanae and R. pumilio, could occur (or co-‐‑occur) along Namibia’s coastal region, South of Swakopmund (Fig. 1).
Rhabdomys contact zones
The distribution of Rhabdomys taxa reveals the presence of several contact areas involving two to three taxa (Fig. 2A), mostly in areas predicted by Meynard et al. (2012) in the Grassland biome, and near its limits with the Nama Karoo and the Savannah biomes in the northern-‐‑central parts of South Africa (Fig. 2B). The presence of a contact zone at “Bedfort gap” (du Toit et al. 2012) in the Eastern Cape Province was also confirmed. Unlike previously thought (Pillay et al. 2016), the urban areas of the Gauteng Province do not seem to limit the distribution of the two South African mesic taxa,
resulting in several localities between Pretoria and Johannesburg, including those reported earlier (le Grange et al. 2015), where the two taxa co-‐‑occur (Fig. 2C), although R. d. chakae appears to be the most common taxon in the province (Fig. 2A).
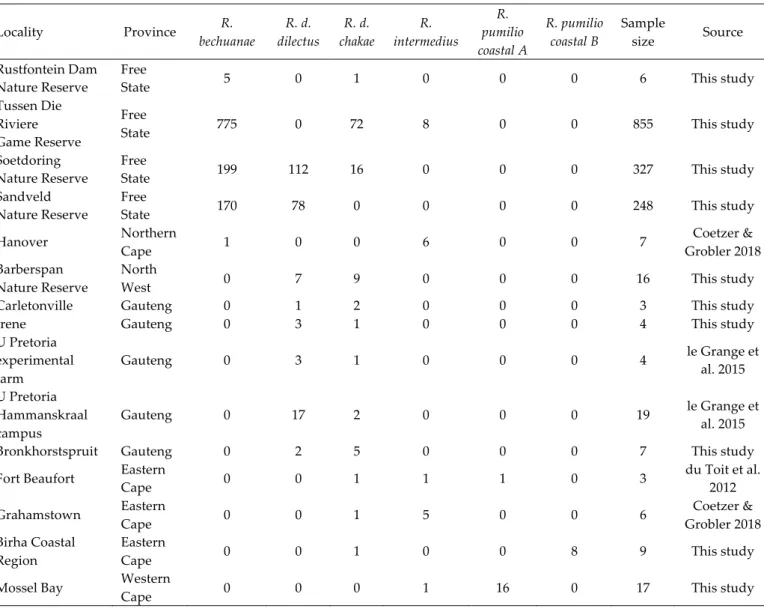
Altogether, 15 localities where more than one taxon of Rhabdomys co-‐‑occur were identified (Table 2). Within three of these localities (Sandveld Nature Reserve, Tussen die Rivere Game Reserve and Soetdoring Nature Reserve), we assessed the frequency of occurrence of different Rhabdomys taxa by long-‐‑term monitoring of these populations. Our results indicate seasonal and annual variations in population size and relative frequency of co-‐‑occurring taxa (Fig. 3). For all three populations, it appears that the contact zones are not stable, fluctuating from monospecific to multi-‐‑specific in different seasons and/or years. Further, total annual rainfall may influence population size variation since we observed an increase in Rhabdomys population size following a rainy year and a drop after a comparatively dry year (Fig. 3). Moreover, although both arid and mesic species may be affected by the rainfall pattern experienced by the three populations, a comparison between annual rain and population size variation suggests that the arid species (R. bechuanae) might cope better than the mesic ones (R. d. dilectus or R. d. chakae) after a dry year (Fig. 3, populations C and D).
Rhabdomys morphological variations
The analysis of a subsample of the Sandveld Nature Reserve population in November 2011 showed that adult mice of the two co-‐‑occurring taxa had similar masses (respectively for R. bechuanae and R.
d. dilectus: mean ± SE, 35.1 ± 1.1 g and 34.0 ± 1.0 g; Wilcoxon rank test with normal approximation: Z
= –0.82, p = 0.47) and head-‐‑and-‐‑body length (respectively: 98.7 ± 1.3 mm and 99.7 ± 1.4 mm; Z = 0.15,
p = 0.88) but different tail length (R. bechuanae: 93.0 ± 1.1 mm and R. d. dilectus: 80.1 ± 1.2 mm; Z = –
6.3, p < 0.001). For both taxa, the ratio of total body length to tail length was significantly greater than one (p < 0.001) although it was significantly (Z = 5.44, p < 0.0001) smaller for R. bechuanae (1.10 ± 0.01 mm) than for R. d. dilectus (1.25 ± 0.02 mm).
Using the data set compiled in our study (Table 3), the two arid species (R. pumilio and R. bechuanae) had longer tails compared to the two mesic subspecies (R. d. chakae and R. d. dilectus). To confirm this observation, we performed a mixed model analysis of variance on the ratio of head-‐‑and-‐‑body to tail length (to normalise the variable distribution). This analysis concerned data collected only during this study (n = 948) and indicated, after controlling for the effect of mass (covariate in the mixed model, F (1, 940) = 59.5, p < 0.0001) and a “data collector” effect (random factor in the mixed model, representing 76.5% of the total variance), that the length ratio varied significantly between the mesic and arid taxa. The mesic taxa had a greater ratio (respectively for R. d. chakae and R. d.
dilectus: 1.14 ± 0.03; 1.20 ± 0.08), than the arid taxa (respectively for R. pumilio and R. bechuanae: 0.96 ±
0.01; 0.95 ± 0.004). The full model explained 59.5% of the variance, with a taxa statistically significant effect: F (3, 942) = 240, p < 0.0001. A HSD Tukey post hoc test indicated the absence of a difference within the mesic and arid taxa, but a significant difference between them.
Rhabdomys phylogeography
Full alignment of our COI fragments was 550 nucleotides long with 173 phylogenetically informative sites. All new haplotype sequences were deposited in the GenBank database under the accession numbers MT093516-‐‑MT093558. ML and BI analyses provided similar tree topologies (Fig. 4). The genus Rhabdomys was monophyletic with high support values (PP = 1.00; BP = 94%) as well as the taxa R. pumilio (PP = 0.99; BP = 89%), R. bechuanae (PP = 1.00; BP = 99%) and R. intermedius (PP
= 1.00; BP = 93%). The R. d. dilectus taxon was not supported (PP < 0.80; BP < 50%), which could be due to the low number of available haplotypes. Its relationships with R. d. chakae (PP = 1.00; BP = 93%) or the other Rhabdomys taxa was not supported. The two R. pumilio lineages were moderately to highly supported (PP = 1.00; BP = 63 and 91%, respectively). Rhabdomys bechuanae emerged as the sister species of R. intermedius (PP = 0.94; BP = 91%).
Based on 107 haplotypes (21 new haplotypes, 25 shared with du Toit et al. (2012, 2013) and 61 only from du Toit et al. (2012, 2013)) the population structure was evaluated with a median-‐‑joining network. Because of complex and uninformative reticulated relationships connecting haplotypes, sub-‐‑networks for each haplogroup (species, subspecies or lineage) are presented in Fig. 5. Each haplogroup was characterized by a heterogeneous number of haplotypes: 33 for R. pumilio and four for R. pumilio coastal B; 36 for R. dilectus (18 R. d. chakae and 9 R. d. dilectus); 31 for R. bechuanae; 12 for
R. intermedius. Some haplogroups were dominated by private haplotypes (R. intermedius, R. pumilio
and R. pumilio coastal B). These haplogroups concerned mainly haplotype sequences from GenBank. Other haplogroups were characterized by one dominant haplotype (for instance, H10 for R.
bechuanae or H8 for R. d. dilectus) and few unique haplotypes but, in both cases, haplotype
dominance may have been due to the high sampling effort in some localities (Fig. 6). H10 was found in seven distinct and distant populations, all located at the eastern limit of the species range (Fig. 5, Table S1), while H8 was a common haplotype of R. d. dilectus, found in all sampled populations, but the only one found in the Free State Province (two contact zone localities: Sandveld and Soetdoring; Fig. 6). A different pattern was observed for R. d. chakae, which had a relatively high diversity of haplotypes and a star-‐‑like network (Fig. 5).
Both nucleotide (0.3% < π < 5.6%) and haplotype (0.354 < h < 0.959) diversities were heterogeneous for all (sub) species (Table 4). Rhabdomys dilectus dilectus had the lowest genetic diversity. From mismatch distribution analyses (Fig. S1), all taxa, except R. pumilio coastal B, showed a unimodal distribution, suggesting sudden expansion. Neutrality test results (at least two significant results in Table 4) confirm mismatch distribution results.
Discussion
Distribution and contact zones
Rhabdomys species occupy distinct geographical regions of southern and eastern Africa. Here, we
describe the distribution of its constituent taxa in southern Africa. Altogether, 15 localities where several taxa co-‐‑occur (i.e. contact zones) were identified in South Africa along a line from Gauteng and the North West, to the Free State and the Eastern Cape Provinces, concurring with earlier predictions (Meynard et al. 2012). These contact areas occurred within the Grassland biome and in areas close to the transitions between major biomes of South Africa (Fig. 2A, Schulze 1997, Mucina & Rutherford 2006).
We did not consider the taxonomic diversity within R. d. dilectus in eastern Africa and Angola (Castiglia et al. 2011, Sabuni et al. 2018, Krásová et al. unpublished), and hence all R. d. dilectus taxa were regarded as one taxonomic group in our study. Further, the genotypes based on COI found in the literature (and used to build the phylogenetic tree) involved only individuals of the southern African clade. Still, we identified that R. d. dilectus occurring in South Africa (Castiglia et al. 2011) had a discontinuous distribution, which also seems to characterise its distribution in eastern Africa (Sabuni et al. 2018). We also documented that populations of R. d. chakae were interspersed within
R. d. dilectus in South Africa. This pattern might be explained under two scenarios: 1) R. d. dilectus
expanding its South African distribution that would have been formerly restricted to the north-‐‑east of the country (in the moist vegetation type of the Savannah biome) into the Grassland biome of Gauteng, the North West and Free State provinces; and/or 2) R. d. chakae dispersed into, and established in, areas formerly occupied by R. d. dilectus in Gauteng Province and further west. These two scenarios involve expansion of the two taxa but at different times. Two arguments may favour the second scenario. Indeed, although the mismatch analysis indicates that both taxa experienced expansion, R. d. chakae has a continuous distribution in the Grassland biome of Lesotho and the eastern parts of South Africa, suggesting that many source populations can potentially contribute dispersers over its distribution range, which may not be the case of R. d. dilectus given its limited and patchy distribution. Second, haplotype diversity and the shape of the median-‐‑joining network based on the COI haplotypes indicate higher diversity within R. d. chakae and a star-‐‑like network, which contrasts with the low diversity observed for R. d. dilectus, suggesting that the later may have experienced a bottleneck. Low mitochondrial diversity within R. d. dilectus was also observed in two of the contact zones that we monitored, where the individuals carried a single haplotype (H8), suggesting either recent colonisation of marginal habitats (Dufour et al. 2015), resulting in a founder event, or a bottleneck following a recent population decline. In these contact zones, where R. d.
dilectus co-‐‑occurs with R. bechuanae, competition for space may limit R. d. dilectus (Dufour et al. 2015,
2019). In the present study, we reported strong seasonal and annual fluctuations in population size, particularly R. d. dilectus populations, putatively following dry years.
We showed that the distribution of Rhabdomys pumilio, thought to be limited to the western coastal areas of South Africa and parts of the Northern Cape Province (du Toit et al. 2012), extends into Namibia, north of the Orange River (which did not constitute a barrier to Rhabdomys dispersal). R.
pumilio thrives mostly in the winter rainfall region and is found in the Desert biome of Namibia and
South Africa, as well as in the Succulent Karoo and Fynbos. Further sampling and genotyping along Namibia’s coastal and central area as well as in the Northern Cape Province would be necessary to assess the northern distribution limits of R. pumilio and identify potential contact zones with R.
bechuanae. Indeed, R. bechuanae has a continuous distribution encompassing large parts of Namibia
as well as northern and central (Free State Province) South Africa. Genetic information on specimens from Botswana are lacking, while some authors indicate the presence of R. bechuanae in arid habitats of southern Angola (Monadjem et al. 2015), however, the latter information will have to be confirmed by genotyping. The nucleotide and haplotype diversities, the networks and the mismatched distributions of both R. pumilio and R. bechuanae indicate relatively high genetic diversity and patterns consistent with a recent expansion. For R. bechuanae, the number of haplotypes was high both at the core of the distribution (Namibia and Northern Cape Province of South Africa) and at the limits of its eastern range (Free State Province), including three long-‐‑term monitored contact populations. Rhabdomys bechuanae populations thrive in summer rainfall regions (Schulze 1997) in the Desert and Savannah biomes of Namibia as well as the Nama Karoo, Savannah and Grassland biomes of South Africa. All contact zones involving R. bechuanae are located in an area still considered to be part of the Grassland biome, at the eastern margin of the species distribution, still, at a micro-‐‑environmental scale, resembles a savannah-‐‑type habitat (Dufour et al. 2015).
We confirmed that the range of R. pumilio coastal B is geographically restricted, and showed that its distribution extends from Fort Beaufort (du Toit et al. 2012) and Grahamstown (Coetzer & Grobler
2018) to the Birha Coastal region in the Eastern Cape Province. In all three of these locations, R.
pumilio coastal B co-‐‑occurs with R. d. chakae, forming the southwestern limit of the range of R. d. chakae. Finally, while our results show the eastern and southern limits of R. intermedius distribution
(co-‐‑occurring, though in low numbers, with R. pumilio, R. bechuanae or R. d. chakae in four identified contact zones, and endemic to South Africa), our knowledge is limited on its presence above the western South African great escarpment and the northern limits of its distribution in South Africa.
A taxonomically informative phenotypic trait
Yom-‐‑Tov (1993) investigated body size variation across the range of Rhabdomys, which was considered at that time to be a single species, and concluded that striped mice from the southwest Cape Province (Fynbos biome) were larger than those from populations of the eastern savannah and grassland area of South Africa, the latter occurring in sympatry with Lemniscomys sp.; a superior competitor. Considering the Fynbos populations of Rhabdomys as allopatric and the savannah populations as sympatric with Lemniscomys, the size differences were ascribed to the impact of competition with Lemniscomys and hence to character release in areas where the competitor did not occur (Yom-‐‑Tov 1993). However, we now know that the populations that were considered by Yom-‐‑Tov (1993) are two distinct species: R. pumilio and R. dilectus (probably both subspecies). Coetzee, in 1970, analysed the diversity of body and tail size within the genus and proposed that since Rhabdomys is diurnal, it could be exposed to air temperature and humidity variations, and tested the hypothesis that tail length relative to head–and-‐‑body length, used by Roberts (1951) as a taxonomic trait, might reflect climatic constraints and adaptation to different environmental conditions. He found a correlation between body/tail length and local weather conditions (Coetzee 1970). Unfortunately, these results are also spurious given that they involved different Rhabdomys taxa.
Here, we provide data on morphological traits of genotyped and museum specimens originating from populations repeatedly sampled and genotyped. Unfortunately, the measurements were performed by several collectors and involved both live (this study) and preserved animals (museum samples), precluding detailed reliable statistical comparison of the geographical variation of these traits. Nevertheless, statistical analyses of co-‐‑occurring free-‐‑living populations of R. bechuanae and
R. d. dilectus in the Sandveld contact zone, showed that the tail length of adults is a potential
informative taxonomic trait, allowing us to distinguish between these mesic and arid species of
Rhabdomys. Further, considering the entire data set collected in our study, despite variation in mass
and variance due to potential measurement errors, mesic and arid Rhabdomys taxa had a significantly different ratio of body/tail size, consistent with longer tails among the arid taxa (R.
pumilio and R. bechuanae) and shorter tails among the mesic taxa R. d. dilectus and R. d. chakae. The
latter observation is consistent with the geographical pattern proposed earlier (Coetzee 1970) and an unpublished note by Lundholm (reported in Coetzee 1970) about the possibility of Rhabdomys being split into two morphological groups: a long-‐‑tailed group comprising of the two arid species (this study) and possibly R. intermedius (measurements in Monadjem et al. 2015), and a short-‐‑tailed group comprising the two R. dilectus taxa. Rhabdomys bechuanae is represented in our data set by nine populations, three of which were sampled twice. All these populations had consistently long tails, longer than 90 mm on average. Interestingly, tail length was consistently longer in populations occurring at the eastern limits of the species distribution than those that were close to the contact zone areas (including Sandveld Nature Reserve). This pattern may follow a gradient of decreased aridity, a proposition which needs further research.
Differences in tail length between the arid species compared to the two mesic Rhabdomys species may be related to adaptation to climatic or habitat conditions (Yom-‐‑Tov 1993), or to multiple factors as proposed for other rodent species (Baker & Cockrem 1970, Thorington 1970). In a review of mammal tail function (Hickman 1979), the tail was suggested to be used for balance and climbing in rodents, based on direct and experimental observations. Tail length was proposed to vary with habitat complexity and climbing abilities in Peromyscus species, with populations occurring in grassland type habitats having shorter tails than populations occurring in woodlands and showing arboreal capabilities (Thorington 1970, Kaufman & Kaufman 1992). More detailed research is needed before considering tail length as an adaptive trait in Rhabdomys. Nevertheless, R. bechuanae and R. pumilio were observed climbing shrubs, feeding on male protea flowers or climbing and biting off female culms of Cannomois congesta plants to consume seeds and inflorescences (Melidonis & Peter 2015, Hobbhahn et al. 2017, van Blerk et al. 2017). Further studies comparing the climbing abilities of arid and mesic Rhabdomys species, and assessing the correlation between tail lengths, habitat characteristics, and climbing ability within species are required to test the climbing hypothesis.
Concluding remarks
We have updated the distribution of Rhabdomys species, identifying several contact zones mostly in or close to areas of ecological transition. Our long-‐‑term data suggest the variable nature of these contact zones and indicate that variation in rainfall patterns may be one of the explanatory factors for this dynamic change. Our preliminary genetic data on R. d. dilectus, indicating low genetic diversity, together with evidence for its discontinuous distribution in South Africa, suggest that its conservation status may need revision. We also re-‐‑evaluated tail length as a potential taxonomic trait to distinguish Rhabdomys taxa with preference for mesic and arid environments. Further studies, based on unbiased morphological data, may help clarify the differentiation within the arid and mesic taxa and test the putative adaptive function of Rhabdomys tail length. Finally, the
Rhabdomys radiation in different environments and the occurrence of contact zones between arid
and mesic taxa provide a unique research framework to test the impact of environmental variation and species interactions on species response to climate change, as well as to conduct comparisons among species expected to be affected differently by increased aridity. Nonetheless, species delimitation based on mitochondrial markers needs to be considered with caution, and a thorough assessment of genomic diversification within the genus is needed prior to assessing the role of adaptation in Rhabdomys radiation.
Acknowledgements
We wish to thank colleagues that kindly shared samples, unpublished data and information with us: J. Bryja; W. Coetzer.; L. Cuypers; J. Fourie; J. Krásová; H. Lutermann and P. Taylor. We warmly thank M. Pagès for developing the PCR-‐‑RFLP method when our funding was limited, J. Perez and F. Justy for help in processing some of the samples, and L. Paradis for her help with QGIS. We thank the numerous persons that assisted us in the field, most particularly: R. Nokha; T. Pusane; A. Loiseau; H. Eiseb; J. Du Plessis; J. Watson and L. Kotze. All samples were collected under permits, and we particularly thank J. Watson, B. Linden (Lajuma Research Station), A. van der Westhuizen (TDR), C. Anderson, D. MacFayden and D. Smith (Tswalu and Benfontein research stations) for their help. We thank the various departments of environmental affairs of the Free State (DESTEA; permits: 01/15700; 01/26960; JM1192/2017; JM1193/2017; 201910000003608), the Northern Cape (DENC, FAUNA 0161/2018) the North West (DEDECT; permits: O1/11262; HQ10/14-‐‑022NW; NW2375/05/2018) and Limpopo (LEDET; permit: ZA/LP/95520) Provinces, as well as the Namibia National Commission on Research, Science and Technology (NCRST; permit n°AN20180811) for issuing us the permits for this study. Weather data were provided by the South African Weather Service. Finally, we thank the ISEM team of the GenSeq platform shared with the LabEx CeMEB, (Montpellier, France, ANR-‐‑10-‐‑LABX-‐‑04-‐‑01) for their technical help, and the OSU OREME (TO contact-‐‑zones), Labex CEMEB (project D-‐‑Range) as well as the CNRS and NRF for support through PICS (n°4841, n° 81859)
and LIA (RhabAdapt & Drought). This is ISEM 2020-‐‑117 SUD. Author contributions: all authors contributed to data collection, P. Caminade and Claire M.S. Dufour produced the genetic data that C. Tougard analysed. G. Ganem analysed the ecological data and wrote the first draft, all authors contributed to the final version of the manuscript.
Literature
Baker L.R. & Cockrem M.R.F. 1970: Selection for body weight in the mouse at three temperatures and the correlated response in tail length. Genetics 65: 505–523.
Castiglia R., Solano E., Makundi R.H. et al. 2011: Rapid chromosomal evolution in the mesic four-‐‑striped grass rat
Rhabdomys dilectus (Rodentia, Muridae) revealed by mtDNA phylogeographic analysis. J. Zool. Syst. Evol. Res. 50: 165–172.
Coetzee C.G. 1970: The relative tail-‐‑length of striped mice Rhabdomys Pumilio Sparrman 1784 in relation to climate. Zool.
Afr. 5: 1–6.
Coetzer W. & Grobler J. 2018: Identifying Rhabdomys museum specimens following taxonomic changes: use of short COI sequences. Vertebr. Zool. 68: 191–197.
Denys C. 1999: Of mice and men: evolution in East and South Africa during Plio-‐‑Pleistocene times. In: Bromage T.G. & Schrenk F. (eds.), African biogeography, climate change and human evolution. Oxford University Press, New York,
USA: 216–226.
du Toit N., van Vuuren B. J., Matthee S. & Matthee C.A. 2012: Biome specificity of distinct genetic lineages within the four-‐‑ striped mouse Rhabdomys pumilio (Rodentia: Muridae) from southern Africa with implications for taxonomy. Mol.
Phylogenet. Evol. 65: 75–86.
du Toit N., van Vuuren B.J., Matthee S. & Matthee C.A. 2013: Biogeography and host-‐‑related factors trump parasite life history: limited congruence among the genetic structures of specific ectoparasitic lice and their rodent hosts. Mol.
Ecol. 22: 5185–5204.
Dufour C.M.S., Meynard C., Watson J. et al. 2015: Space use variation in co-‐‑occurring sister species: response to environmental variation or competition? PLOS ONE 10: e0117750.
Dufour C.M.S., Pillay N., Avenant N. et al. 2019: Habitat characteristics and species interference influence space use and nest-‐‑site occupancy: implications for social variation in two sister species. Oikos 128: 503–516.
Fu Y.X. 1997: Statistical tests of neutrality of mutations against population growth, hitchhiking and background selection.
Genetics 147: 915–925.
Ganem G., Meynard C.N., Perigault M. et al. 2012: Environmental correlates and co-‐‑occurrence of three mitochondrial lineages of striped mice (Rhabdomys) in the Free State Province (South Africa). Acta Oecol. 42: 30–40.
Guindon S., Dufayard J.F., Lefort V. et al. 2010: New algorithms and methods to estimate maximum-‐‑likelihood phylogenies: assessing the performance of PhyML 3.0. Syst. Biol. 59: 307–321.
Hickman G.C. 1979: The mammalian tail: a review of functions. Mammal Rev. 9: 143–157.
Hobbhahn N., Steenhuisen S.L., Olsen T. et al. 2017: Pollination and breeding system of the enigmatic South African parasitic plant Mystropetalon thomii (Mystropetalaceae): rodents welcome, but not needed. Plant Biol. 19: 775–786. Kaufman D.M. & Kaufman D.W. 1992: Geographic variation in length of tail of white-‐‑footed mice (Peromyscus leucopus) in
Kansas. J. Mammal. 73: 789–793.
Kumar S., Stecher G. & Tamura K. 2016: MEGA7: Molecular Evolutionary Genetics Analysis, version 7.0 for bigger datasets. Mol. Biol. Evol. 33: 1870–1874.
le Grange A., Bastos A.D.S., Brettschneider H. & Chimimba C.T. 2015: Evidence of a contact zone between two Rhabdomys
dilectus (Rodentia: Muridae) mitotypes in Gauteng province, South Africa. Afr. Zool. 50: 63–68.
Leigh J.W. & Bryant D. 2015: PopART: full-‐‑feature software for haplotype network construction. Methods Ecol. Evol. 6:
1110–1116.
Librado P. & Rozas J. 2009: DnaSP v5: a software for comprehensive analysis of DNA polymorphism data. Bioinformatics
25: 1451–1452.
Mackay M.K. 2011: The behaviour of two sub-‐‑species of the striped mouse Rhabdomys: the role of phylogeny and the environment. Witwatersrand, Johannesburg, South Africa.
Mahida H., Campbell G.K. & Taylor P.J. 1999: Genetic variation in Rhabdomys pumilio (Sparrman 1784) – an allozyme study. Afr. Zool. 34: 91–101.
Melidonis C.A. & Peter C.I. 2015: Diurnal pollination, primarily by a single species of rodent, documented in Protea foliosa using modified camera traps. S. Afr. J. Bot. 97: 9–15.
Meynard C.N., Pillay N., Perrigault M. et al. 2012: Evidence of environmental niche differentiation in the striped mouse (Rhabdomys sp.): inference from its current distribution in southern Africa. Ecol. Evol. 2: 1008–1023.
Monadjem A., Taylor P., Denys C. & Cotterill F. 2015: Rodents of sub-‐‑Saharan Africa: a biogeographic and taxonomic synthesis. De Gruyter, Berlin, Germany.
Mucina L. & Rutherford M.C. 2006: The vegetation of South Africa, Lesotho and Swaziland. Strelitizia 19, South African
National Biodiversity Institute, Pretoria, South Africa.
Nylander J. 2004: MrModeltest, version 2. Program distributed by the author. Evolutionary Biology Centre, Uppsala
University, Uppsala, Sweden.
Pillay N. 2000: Reproductive isolation in three populations of the striped mouse Rhabdomys pumilio (Rodentia, Muridae): interpopulation breeding studies. Mammalia 64: 461–470.
Pillay N., Rimbach R. & Rymer T. 2016: Pre-‐‑ and postnatal dietary protein deficiency influences anxiety, memory and social behaviour in the African striped mouse Rhabdomys dilectus chakae. Physiol. Behav. 161: 38–46.
Rambau R.V., Robinson T.J. & Stanyon R. 2003: Molecular genetics of Rhabdomys pumilio subspecies boundaries: mtDNA phylogeography and karyotypic analysis by fluorescence in situ hybridization. Mol. Phylogenet. Evol. 28: 564–575. Ramos-‐‑Onsins S. & Rozas J. 2003: Statistical properties of new neutrality tests against population growth. Mol. Biol. Evol.
19: 2092–2100.
Roberts A. 1951: The mammals of South Africa. “The mammals of South Africa Book Fund”, Johannesburg, South Africa. Ronquist F. & Huelsenbeck J.P. 2003: MrBayes 3: Bayesian phylogenetic inference under mixed models. Bioinformatics 19:
1572–1574.
Sabuni C., Aghová T., Bryjová A. et al. 2018: Biogeographic implications of small mammals from Northern Highlands in Tanzania with first data from the volcanic Mount Kitumbeine. Mammalia 82: 360–372.
Schradin C. & Pillay N. 2005: Intraspecific variation in the spatial and social organization of the African striped mouse. J.
Mammal. 86: 99–107.
Schulze R.E. 1997: South African atlas of agrohydrology and climatology. Water Research Commission, Pretoria, South Africa. Skinner J. & Chimimba C. 2005: The mammals of the southern African subregion. Cambridge University Press, Cambridge,
UK.
Slatkin M. & Hudson R.R. 1991: Pairwise comparisons of mitochondrial DNA sequences in stable and exponentially growing populations. Genetics 129: 555–562.
Tajima F. 1989: Statistical method for testing the neutral mutation hypothesis by DNA polymorphism. Genetics 123: 585–
595.
Taylor P.J. 2000: Patterns of chromosomal variation in southern African rodents. J. Mammal. 81: 317–331.
Taylor S.A., Larson E.L. & Harrison R.G. 2015: Hybrid zones: windows on climate change. Trends Ecol. Evol. 30: 398–406. Thorington R.W., Jr. 1970: Lability of tail length of the white-‐‑footed mouse, Peromyscus leucopus noveboracensis. J. Mammal.
51: 52–59.
van Blerk J.J., West A.G. & Midgley J.J. 2017: Restio culm felling is a consequence of pre-‐‑dispersal seed predation by the rodent Rhabdomys pumilio in the Fynbos. S. Afr. J. Bot. 112: 123–127.
Yang Z. 1994: Estimating the pattern of nucleotide substitution. J. Mol. Evol. 39: 105–111.
Yom-‐‑Tov Y. 1993: Size variation in Rhabdomys pumilio: a case of character release? Z. Säugetierkd. 58: 48–53.
Supplementary online material
Fig. S1. Demographic history of Rhabdomys taxa inferred from cytochrome c oxidase I gene sequences. Observed mismatch distributions (grey line) are compared to expected distributions (black line) under a population growth-‐‑decline model.
Table S1. Detailed list of haplotype numbers, specimens, localities and references for Rhabdomys species used in our study. Accession numbers for original and GenBank haplotype sequences are also listed.
Fig. 1. The distribution of the genus Rhabdomys in southern and eastern Africa (yellow dots) based on all available data from museum collections, published data and unpublished data (origin details are available in doi: 0d1b3414-‐‑7e2a-‐‑11ea-‐‑a38d-‐‑00163e26bfb0). Details on the distribution of genetically identified specimens (triangles: published data; hexagons: this study; * R. d. dilectus is actually a complex of taxa see text) and the location of mixed populations (squares, central colours indicating dominant species). Numbers on the map refer to populations mentioned in Table 3. The black star indicates location of oldest fossils (Langebaanweg, 5 MYA; Denys 1999) and the white star indicates location of most recent fossils (Makapansgat, 3 MYA; Monadjem et al. 2015). Base map: World Topographic Map Esri Standard.
Fig. 2. A) The distribution of genotyped Rhabdomys in South Africa and Lesotho, with details on biome boundaries. B) Details on contact localities involving R. bechuanae, mainly in the Free State Province. C) Details of contact localities between R. d. dilectus and R. d. chakae, mainly in Gauteng Province. Mixed populations are indicated with a square symbol (central colours indicate the predominant species). Base map: World Topographic Map Esri Standard. Layers sources were ESRI STANDARD. Biome layer – Department of Agriculture, Fisheries and Forestry of South Africa (https://egis.environment.gov.za/).
Fig. 3. Location of three contact zones A., and seasonal and annual variation of occurrence of several Rhabdomys taxa in these localities all occurring in the Free State Province of South Africa (B. Sandveld Nature Reserve; C. Soetdoring Nature Reserve; D. Tussen die Riviere Game Reserve) with total annual rain (mm) and temperature (average minimum and maximum temperature (°C)) data obtained from the South African Weather Service (B. Bloemhof Station; C. Glen College Station; D. Gariep Station).
Fig. 4. Bayesian tree reconstructed from cytochrome c oxidase I haplotype sequences of Rhabdomys species. Haplotypes are detailed in Table S1. Haplotypes in grey are GenBank haplotypes. Numbers at node are for Bayesian posterior (≥ 0.80) and maximum likelihood bootstrap (≥ 50%) probabilities. Species, subspecies and lineages are indicated on the right.
Fig. 5. Median-‐‑joining network based on cytochrome c oxidase I haplotypes of Rhabdomys species. The central network is for the whole dataset, while A, B, C, D, E and F networks are haplogroup networks. Haplotypes are indicated with numbers as in Table S1. Numbers in brackets after haplogroup names are haplotype numbers for each haplogroup, while those between haplogroup circles are numbers of mutational changes.
Fig. 6. Minimum-‐‑spanning networks based on cytochrome c oxidase I haplotypes of Rhabdomys species for the following localities: A) Sandveld Nature Reserve; B) Soetdoring Nature Reserve; C) Tussen die Riviere Game Reserve.
Table 1. Results obtained with the PCR-‐‑RFLP approach involving two enzymes with different restriction sites on the mitochondrial COI. When the original 860bp PCR fragment is cut, the length of the resulting fragments is given separated with a semi-‐‑colon. When the original fragment is not cut, the cell in the table is indicated with a dash. Rate of successful assignment as tested on a total of 2199 sequences is given as a percentage between brackets (e.g. in 97% of mice assigned to R. d. chakae based on their COI sequence, each of the two enzymes produced two PCR fragments, while for 3% of these mice the RFLP phenotype was wrong for one or the other enzyme).
Enzyme Restriction sites
R. pumilio
(coastal A) (98.7%)
R. pumilio
(coastal B)
(100%) R. d. chakae (97%) R. d. dilectus (100%) R. bechuanae (98.9%) R. intermedius (100%) BglII AGATCT 599, 261 -‐‑ 599, 261 -‐‑ -‐‑ -‐‑ Eco53kI GAGCTC 763, 97 763, 97 763, 97 -‐‑ 763, 97 600, 163, 97