Journal of Antimicrobial Chemotherapy (1984) 13, 611-618
Pharmacokinetics and dosage adjustment of cefotiam in renal impaired patients
M. C. Rouan*, U. Binswangerf, F. Bammattert, W. Theobald*, J. P. Schoeller* and J. Guibert§
*CIBA-GEIGY, Rueil-Malmaison, France, ^Department of Internal Medicine, Section of Nephrology, University of Zurich, Switzerland, %CIBA-GEIGY, Basle, Switzerland, and
^Hospital St-Joseph, Paris, France
The pharmacokinetics of cefotiam were investigated after intravenous adminis-tration of 1 g to 2 healthy volunteers with normal renal function and to 16 patients whose creatinine clearance ranged from 4-7 to 0 1 1/h (78 to 1-66 ml/min). The elimination half-life varied from 1 • 1 h in normal subjects to 13 h in patients and the total plasma clearance from 21 to 0-6 1/h (350 to 10 ml/min). The urinary recovery decreased from 62% of the dose in normal subjects to 1-1% in patients, and the renal clearance from 15 to 0-03 1/h (250 to 0-5 ml/min). Plasma and renal clearances of cefotiam correlated well with the creatinine clearance.
The dosage schedule for cefotiam in patients with normal renal fiinction can be used in the presence of renal failure when the creatinine clearance is equal to or greater than 1 1/h (16-6 ml/min). For patients whose creatinine clearance is less than 1 1/h, the dose must be decreased to 75% of that for a patient with normal renal function only when it is given every 6 or 8 h.
Introduction
Cefotiam is a new semisynthetic cephalosporin for parenteral administration. It is highly potent against a broad spectrum of Gram-positive and Gram-negative bac-teria. This drug is predominantly excreted via the kidneys in healthy volunteers (Daschner et al, 1982). The present study was designed to investigate the effect of renal dysfunction on the pharmacokinetics of cefotiam, and to determine if any adjustment of the dosage regimen is necessary to avoid excessive accumulation in the presence of renal impairment.
Materials and methods
Selection of subjects
This study was performed on two healthy male volunteers with normal renal func-tion and on 16 patients with various degrees of renal impairment. Every subject was
Correspondence to: M. C. Rouan, CIBA-GEIGY, Rueil-Malmaison, France. 611
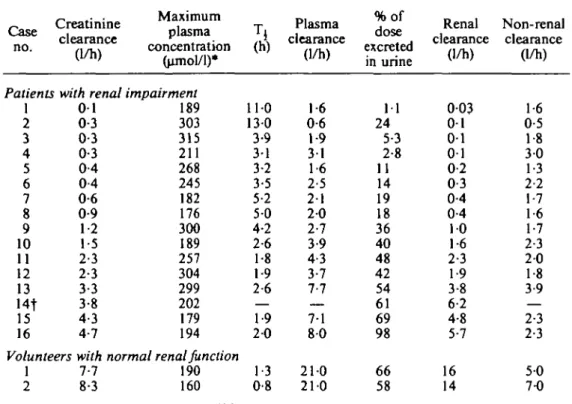
Table I. Pharmacokinetic parameters of cefotiam in normal subjects and in patients with various degrees of renal impairment after a single intravenous dose of 1 g
Case no. Creatinine clearance (1/h) Maximum plasma concentration (umol/1)* Patients with renal impairment
1 2 3 4 5 6 7 8 9 10 11 12 13 14t 15 16 0 1 0-3 0-3 0-3 0-4 0-4 0-6 0-9 1-2 1-5 2-3 2-3 3-3 3-8 4-3 4-7 189 303 315 211 268 245 182 176 300 189 257 304 299 202 179 194 Volunteers with normal renal function
1 2 7-7 8-3 190 160
a
110 130 3-9 31 3-2 3-5 5-2 5 0 4-2 2-6 1-8 1-9 2-6 — 1-9 2 0 1-3 0-8 Plasma clearance (1/h) 1-6 0-6 1-9 31 1-6 2-5 2 1 2 0 2-7 3-9 4-3 3-7 7-7 7-1 8 0 210 210 %of dose excreted in urine 1 1 24 5-3 2-8 11 14 19 18 36 40 48 42 54 61 69 98 66 58 Renal clearance (1/h) 003 0 1 0 1 0 1 0-2 0-3 0-4 0-4 1 0 1-6 2-3 1-9 3-8 6-2 4-8 5-7 16 14 Non-renal clearance (1/h) 1-6 0-5 1-8 3 0 1-3 2-2 1-7 1-6 1-7 2-3 2-0 1-8 3-9 — 2-3 2-3 5 0 7-0 * 1 nmole of cefotiam = 0-5256 mg.fPlasma concentrations could not be determined for this patient in samples collected after 2 h post injection owing to interference from other compounds.
fully informed by the clinician on the nature of the study and agreed to participate. Both healthy subjects, aged 23 and 30, weighed 69 kg. The age of patients (8 females and 8 males) ranged from 33 to 60 years, their weight from 38 to 85 kg. The endo-genous creatinine clearance (C/CT) measured over 24 h was 7-7 and 8-3 1/h in the two
healthy volunteers. In patients, C/CT was determined one week before the experiment,
and during the last 24 h of the experiment; the averages of these two values are given as C4r in Table I, they ranged from 0-1 to 4-7 1/h.
Dosing schedule and sampling
All subjects were given a single intravenous dose of 1 g cefotiam. The drug was dis--solved in 6 ml of sterile water for healthy subjects and in 20 ml for patients and was injected over 1 and 3 min respectively. Normal subjects received no other medication during the study and for eight days before. Most uraemic patients received drugs besides cefotiam, but no other antibiotic.
Blood samples were collected into heparinized tubes before the injection and at times 5, 15, 30 min and 1,2, 5, 10 and 24 h after drug injection. A few more samples were taken from healthy subjects within the first 8 h post-injection. In patients with severe renal failure, samples were also collected at 48 and 72 h. Plasma was separated by centrifugation. Urine was collected before administration and within different
Cefotiam in renal failure 613
time intervals up to 24 h for healthy volunteers (0-1, 1-2, 2-4, 4-6, 6-8, 8-10 and 10-24 h post-injection), and up to 36, 48 or 72 h for patients according to the degree of renal dysfunction. Plasma and urine samples were stored at — 20°C until analysis. Preliminary studies have shown that cefotiam is stable in these conditions for several months (Lecaillon et al., 1982).
Assay procedure
Plasma and urinary concentrations of cefotiam were determined by reversed-phase liquid chromatography (Lecaillon et al., 1982). The limits of quantitation of the method were 0-4 uxnol/1 of plasma and 10 umol/1 of urine.
Data analysis
The following pharmacokinetic parameters were calculated:
Cmax- maximum plasma concentration determined 5 min after the end of infusion. Cmax $$: maximum plasma concentration at the steady-state during a chronic
treat-ment calculated by the superposition technique applied to each individual plasma profile after a 1 g dose for 6, 8 and 12 h dosing intervals.
Tf apparent elimination half-life of cefotiam in plasma determined from the
terminal log-linear segment of the plasma concentration-time curve.
C/to,: total plasma clearance calculated by the ratio dose/AUC where AUC is the area under the plasma concentration-time curve determined by the trapezoidal rule and extrapolated to time infinity.
C/r: renal clearance determined by the mean of the ratios AU/AAUC where AU
and AAUC are the amount of drug excreted in urine and the corresponding area portion under the plasma concentration-time curve measured during the different urine sampling periods.
Cl^: non-renal clearance calculated as C/nr = Cl^t - ClT.
The adjusted maintenance dose (DA) for different dosing intervals (6, 8 and 12 h)
was calculated upon the principle that the maximum plasma concentration at the steady-state ( C ^ ss) in a renal failure patient should be the same as in a subject with normal renal function. So Z)A in a patient X, can be expressed as a function
of the maintenance dose (DM) in a normal subject and of the C ^i S S calculated for
the patient and for a normal subject:
Cms, ss m normal subject
(1) Cnuw.ss"1 patient X
In normal subjects, no accumulation of cefotiam was found by simulating the steady state plasma profiles by the superposition technique, even with adminis-trations every 6 h. So C ^ s s in normal subjects may be taken as equal to Cm^-, and equation (1) becomes:
Cmax m normal subject D D
Cmtx, ss m patient X
In renal insufficient patients, C ^ was very variable from one individual to the other (Table I). This variability was not reduced by correcting C^^ for the body weight. In addition, C . ^ was not correlated with the degree of renal insufficiency.
0 5 10 15 Time(h)
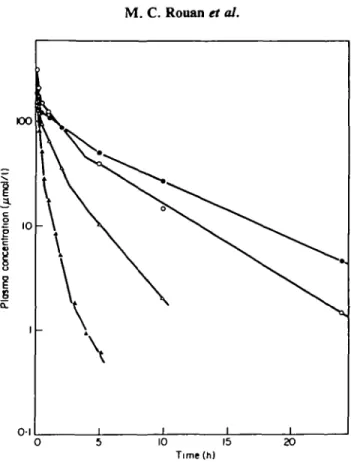
Figure 1. Examples of cefotiam plasma concentration-time profiles in subjects with normal or impaired renal function after iv injection of 1 g. • , C/cr=0-61/h (patient 7); O, C/cr=l-21/h (patient 9);
A, C/CT=4-3 1/h (patient 15); A, C/cr=7-71/h (patient 1).
To avoid the error due to the variability of C^x, DA was calculated by using each
individual value of Cmax in each patient instead of the mean value of C ^ in normal
subjects. The equation used was:
Cnax in patient X
»" patient X
Results
Healthy volunteers
Plasma concentration-time curves showed a 3-phase decrease (Figure 1).
The pharmacokinetic parameters obtained for both volunteers are summarized in Table I. Cefotiam was rapidly eliminated from plasma with a mean (7/^ = 21 1/h and a mean T±= 11 h. Plasma was virtually cleared of cefotiam 8 h after dosing. The 24-h urinary excretion of unchanged cefotiam averaged 62% of the administered dose, and 91% of this was eliminated within the first 2 h after dosing. The non-renal clearance represented 38% of the total plasma clearance as a mean thereby suggesting a non-renal route of elimination for unchanged cefotiam.
Cefotiam in renal failure 615 20
1"
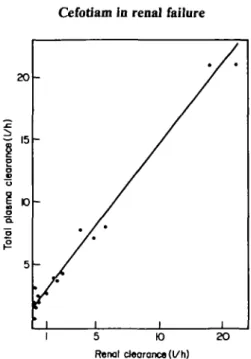
clearer * plasm a Tota l 5 * / * ' i i i i 5 K) Renal clearance (l/h) 2OFigure 2. Correlation between total plasma and renal clearances of cefotiam after administration of 1 g iv single doses to normal subjects and patients with renal dysfunction. Cltot= 1 -3 C/r+1 -60. r=0-992;
0001
Patients with renal impairment
Plasma concentrations exhibited a 3-phase decrease as in healthy subjects, but high concentrations were maintained for a longer time as shown in Figure 1. The pharmacokinetic parameters calculated for the 16 patients are given in Table I.
The plasma clearance decreased from 21 1/h in healthy volunteers to 0-6 1/h in one case of severe renal insufficiency. The elimination half-life increased moderately with the degree of renal impairment. A maximum value of 5-2 h was observed when C/cr ranged from 4-7 to 0-4 1/h. In two patients with severe renal impairment
(C7cr=O-3 1/h) the half-life was 3 1 and 3-9 h. It was however prolonged to 13 and
11 h in two other patients whose Cl^ was 0-3 and 0-1 1/h respectively.
The more pronounced the renal dysfunction, the lower the urinary excretion which fell to 1 1 % of the dose and the higher the contribution of non-renal elimination processes to the overall elimination of unchanged cefotiam.
Discussion
The volume of the central compartment did not seem to alter with renal function since the maximum plasma concentration did not correlate with the degree of renal impairment (Table I)- Consequently, the decrease of the total plasma clearance with C/CT was essentially due to a decrease of the elimination rate constant.
The total plasma clearance is the sum of renal and non-renal clearances: C/tot = Clr + Clnt. A linear relationship was observed between plasma and renal
clearances of patients and volunteers as illustrated in Figure 2: C/^ = l-3C/r+l-6(n=17, r=0-992;/><0-001).
2 4 6 8 Creatinine clearance (t/h)
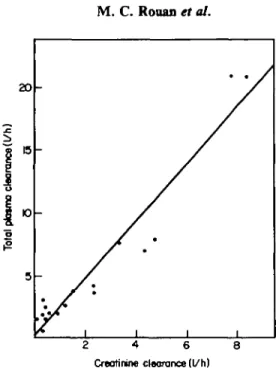
Figure 3. Correlation between total plasma clearance of cefotiam and creatinine clearance after admin-istration of 1 g iv single doses to normal subjects and patients with renal dysfunction. C/tot=2-3 C/CT+0-3.
r=0-963;f><0-001.
When the total plasma clearance was plotted against the creatinine clearance (Figure 3), the following equation of the regression line was obtained:
C/tot = 2-3C/CT+0-3 (n = 17, r=O-963; /><0001).
The correlation is not as good as that obtained for the relationship with C/r. The
high value of the slope indicates that other elimination processes than glomerular filtration were also impaired when C/CT decreased.
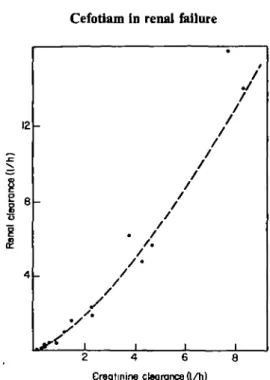
Renal cefotiam and creatinine clearances were best fitted by a geometric regression (Figure 4):
C/r = 0-7 Ckrl '* (n= 18, r=0-993; /»< 0-001).
A coefficient of correlation r=0-969, was obtained when these clearances were fitted by a linear regression. In healthy subjects and in patients with the less impaired renal function, the renal clearance of cefotiam consistently exceeded that of creati-nine (Table I). This indicates that cefotiam was excreted unchanged in urine by both glomerular filtration and tubular secretion in these subjects. The renal clearance of cefotiam decreased more rapidly than that of creatinine to become similar or lower than this one in patients whose C/cr was less than 2-31/h. This suggests that the
tubu-lar secretion might decrease rapidly with decreasing Ch, and that passive' tubutubu-lar reabsorption of cefotiam might also operate in patients with severe renal damage. Such an impairment of the tubular secretion when Cb decreases was previously reported for other cephalosporins, cefuroxime (Dalen et al'., 1972) and cefoxitin (Dalen&Vree, 1980).
The elimination half-life of cefotiam increased only moderately with the degree of renal dysfunction. This may be explained by the high contribution of non-renal elimination processes to the overall elimination of cefotiam.
Cefotiam in renal failure 617
2 4 6 8 Creotinine clearance (l/h)
Figure 4. Correlation between renal clearance of cefotiam and creatinine clearance after administration of 1 g iv single doses to normal subjects and patients with renal dysfunction.;C7r=O-7 C/''4-r=0-993'
/>< 0-001. CT
Despite the rapid elimination of cefotiam, urinary concentrations remained several times higher than the minimal inhibitory concentrations (MIC) (Zak et al, 1979) for most organisms sensitive to this cephalosporin up to 24 h post-injection in 14 patients. They ranged from 8-5 to 240 umol/1 in the 12-24 h urine fractions. In two patients (case nos 5 and 14), they were above the MIC up to 7 h after dosing.
In adults with normal renal function, the dosage generally used is 1 g cefotiam twice daily for mild to moderately severe infections. The daily dose can be raised to 4g for more severe infections (Ishigami et al, 1979; Saito & Matsumoto, 1981; Shiraha, Kawabata & Yura, 1979; Veyssier, Aubert & Carbon, 1981). This dosage regimen may be adjusted in presence of severe renal failure to avoid accumulation of cefotiam. For drugs with short serum half-lives such as cefotiam, it is better to reduce the dose than to prolong the dosing interval (Fabre & Balant, 1976). The dose can be reduced either to reach the same maximum plasma levels in subjects with normal and with impaired renal function, or to obtain the same amount of drug in the body during one dosage interval. The former approach is recommended for bactericidal agents as the dosage regimen resulting in identical areas under the plasma concentration-time curve may lead to concentrations below the bactericidal range (Dettli, 1976; Fabre & Balant, 1976). The cefotiam maintenance dose was consequently calculated to reach in each patient the same steady-state C ^ value as in a subject with normal renal function. The individual reductions of the dose calculated permitted to classify the patients in two groups as shown in Table II.
For moderate infections, the treatment, 1 g twice daily, can be used without modification even in the presence of severe renal failure.
For severe infections, the dose must be reduced only for patients with C/CT< 1 1/h
Table II. Dosing schedule for cefotiam in renal insufficiency (iv doses expressed in % of that which should be given to a subject
with normal renal function) Dosing interval (h) 6 8 12 *17 ml/min. Moderate renal insufficiency ( C k > 1 1/h*) 100 loading 100 100 Severe renal insufficiency (C4r<l 1/h*)
dose maintenance dose 75 75 100
given every 6 or 8 h, the dose should be reduced to 75% of that to be given to a subject with normal renal function. T h e loading dose should not be reduced in order to achieve rapidly steady-state plasma concentrations.
References
Dalen, R. & Vree, T. B. (1980). Renal mechanisms in elimination of cefoxitin. World conference on Clinical Pharmacology and Therapeutics. London.
Dalen, R., Vree, T. B., Hafkenschaid, J. C. M. & Gimbrene, J. S. F. (1972). Determination of plasma and renal clearance of cefuroxime and its pharmacokinetics in renal insuffi-ciency. Journal of Antimicrobial Chemotherapy 5, 281-92.
Daschner, F. D., Hemmer, K. A., Offermann, P. & Slanicka, J. (1982). Pharmacokinetics of cefotiam in normal humans. Antimicrobial Agents and Chemotherapy 22, 958—60. Dettli, L. (1976). Drug dosage in renal disease. Clinical Pharmacokinetics 1, 126-34. Fabre, J. & Balant, L. (1976). Renal failure, drug pharmacokinetics and drug action. Clinical
Pharmacokinetics 1, 99-120.
Ishigami, J., Mita, T., Momose, S. & Kumazawa, J. (1979). Clinical evaluation of cefotiam in complicated urinary tract infections: a comparative study with cefazolin by a randomized double-blind method. Proceedings of the 11th International Congress of Chemotherapy and the 19th Interscience Conference on Antimicrobial Agents and Chemotherapy 1, 218-20. The American Society for Microbiology, Washington, D.C. Lecaillon, J. B., Rouan, M. C , Souppart, C , Febvre, N. & Juge, F. (1982). Determination
of cefsulodin, cefotiam, cephalexin, cefotaxime, desacetyl-cefotaxime, cefuroxime and cefroxadin in plasma and urine by high-performance liquid chromatography. Journal of Chromatography 228, 257-67.
Saito, A. & Matsumoto, K. (1981). Clinical evaluation of cefotiam in pulmonary infections: a comparative study with cefazolin using a randomized double-blind method. Proceedings of the 12th International Congress of Chemotherapy 1,426-8. The American Society for Microbiology, Washington, D.C.
Shiraha, Y., Kawabata, N. & Yura, J. (1979). Double-blind comparison of cefotiam (SCE-963) and cefazolin in postoperative infections. Proceedings of the 11th International Congress of Chemotherapy and the 19th Interscience Conference on Antimicrobial Agents and Chemotherapy 1, 220-1. The American Society for Microbiology, Washington, D.C. Veyssier, P., Aubert, J. & Carbon, C. (1981). Treatment of lower respiratory tract infections
with cefoxitin and cefotiam. Proceedings of the 12th International Congress of Chemotherapy 1, 428-9. The American Society for Microbiology, Washington, D.C. Zak, O., Konopka, E. A., Tosch, W., Zimmerman, W., Kunz, S., Fehlmann, H. & Kradolfer,
F. (1979). Experimental studies of cefotiam (CGP 14 221/E). Proceedings of the 11th International Congress of Chemotherapy and the 19th Interscience Conference on Antimicrobial Agents and Chemotherapy 1, 223-5. The American Society for Microbiology, Washington, D.C.