Matrix Modulation of the Bioactivation of Estragole by Constituents
of Different Alkenylbenzene-containing Herbs and Spices and
Physiologically Based Biokinetic Modeling of Possible In Vivo Effects
Wasma Alhusainy,*
,†
,‡
,§
,1Suzanne J. P. L. van den Berg,* Alicia Paini,*
,§ Adelaine Campana,* Mariska Asselman,* Albertus Spenkelink,*
Ans Punt,* Gabriele Scholz,§ Benoit Schilter,§ Timothy B. Adams,† Peter J. van Bladeren,*
,§ and Ivonne M. C. M. Rietjens*
*Division of Toxicology, Wageningen University, Tuinlaan 5, 6703 HE Wageningen, The Netherlands; †Flavor and Extract Manufacturers Association, 1620
I Street, NW, Suite 925, Washington, DC, 20006, USA; ‡International Organization of the Flavor Industry, IOFI, rue de Rhone, 100, 1204 Genève, Switzerland;
and §Nestlé Research Centre, 1000 Lausanne 26, Switzerland
1To whom correspondence should be addressed at Division of Toxicology, Wageningen University, Tuinlaan 5, 6703 HE Wageningen, The Netherlands. Fax: +31 317 484931. E-mail: [email protected].
Received January 31, 2012; accepted May 17, 2012
The alkenylbenzene estragole is a constituent of several herbs and spices. It induces hepatomas in rodents at high doses following bio-activation by cytochrome P450s and sulfotransferases (SULTs) giv-ing rise to the ultimate carcinogenic metabolite 1'-sulfooxyestragole which forms DNA adducts. Methanolic extracts from different alkenylbenzene-containing herbs and spices were able to inhibit SULT activity. Flavonoids including quercetin, kaempferol, myri-cetin, apigenin, and nevadensin were the major constituents responsible for this inhibition with Ki values in the nano to micro-molar range. In human HepG2 cells exposed to the proximate carcinogen 1ʹ-hydroxyestragole, the various flavonoids were able to inhibit estragole DNA adduct formation and shift metabolism in favor of glucuronidation which is a detoxification pathway for 1ʹ-hydroxyestragole. In a next step, the kinetics for SULT inhibi-tion were incorporated in physiologically based biokinetic (PBBK) models for estragole in rat and human to predict the effect of co-exposure to estragole and (mixtures of) the different flavonoids on the bioactivation in vivo. The PBBK-model-based predictions indi-cate that the reduction of estragole bioactivation in rat and human by co-administration of the flavonoids is dependent on whether the intracellular liver concentrations of the flavonoids can reach their Ki values. It is expected that this is most easily achieved for nevadensin which has a Ki value in the nanomolar range and is, due to its methyl-ation, more metabolically stable than the other flavonoids.
Key Words: estragole; bioactivation; sulfotransferase
inhibi-tor; flavonoid; matrix; physiologically based biokinetic (PBBK) modeling.
Herbs and spices have a long history of use as food, flavoring
and coloring agents throughout the world (Dearlove et al.,
2008; Smith et al., 2002). In culinary usage, herbs are most
commonly seasonings derived from leaves of plants. Spices,
in contrast, are obtained from seeds, berries, fruits, barks,
or roots (Dearlove et al., 2008). Alkenylbenzenes such as
estragole (1-allyl-4-methoxybenzene), present in the volatile
oils, contribute to the characteristic taste and fragrance of
many herbs and spices including nutmeg, basil, anise, mace,
tarragon, fennel, and pimento (Smith et al., 2002). Oral intake
of estragole results primarily from consumption of foods,
mainly herbs and spices, and of their essential oils. Based
on rodent studies, estragole was found to be genotoxic and
carcinogenic (Drinkwater et al., 1976; Miller, 1983). Based
on these findings, the use of estragole as a pure substance in
foodstuffs has been prohibited since September 2008 within
the European Union (Regulation [EC] No 1334/2008 of the
European Parliament and of the Council of 16 December
2008). Realistic daily intake levels of estragole have been
estimated to range from 0.01 mg/kg bw/day (Smith et al.,
2002) to 0.07 mg/kg bw/day (SCF, 2001). Given that at present
addition of estragole as a pure compound to individual food
categories is no longer allowed, the value of 0.01 mg/kg bw/
day resulting mainly from herbs and spices (Smith et al.,
2002) is taken in the present study as the value for current
levels of dietary human intake.
Figure 1 presents an overview of the bioactivation and
detoxification pathways of estragole. Based on in vivo
stud-ies, at low doses (<10 mg/kg bw), O-demethylation appears
to be more favored in humans and in rodents and yields
phen-olic derivatives which are to a large extent excreted as the
sulfate or glucuronic acid conjugate (Anthony et al., 1987;
Sangster et al., 1987). Bioactivation of estragole proceeds
by 1
ʹ-hydroxylation to 1ʹ-hydroxyestragole and subsequent
sulfonation to 1
ʹ-sulfooxyestragole. The sulfate conjugate
of 1
ʹ-hydroxyestragole is unstable and hydrolyzes to form a
Advance Access publication May 30, 2012© The Author 2012. Published by Oxford University Press on behalf of the Society of Toxicology. All rights reserved. For permissions, please email: [email protected]
reactive electrophilic intermediate (carbocation ion) which
has been linked to glutathione (GSH) depletion, oxidative
stress, protein-, DNA-, and GSH-adduct formation,
prob-ably at or near the site of formation (Phillips et al., 1981;
Smith et al., 2002). Therefore, the sulfate conjugate of
1ʹ-hydroxyestragole is considered to be the ultimate
hepato-toxic and hepatocarcinogenic agent in rodents (Boberg et al.,
1983). This conclusion was corroborated by co-administration
of the specific sulfotransferase (SULT) inhibitor
pentachloro-phenol (PCP), which resulted in a potent inhibition of hepatic
tumor induction by long-term dietary administration of the
closely related alkenylbenzenes safrole or 1ʹ-hydroxysafrole
and a significant decrease of SULT activity and hepatic DNA
and RNA adduct formation by 1ʹ-hydroxysafrole in mice
(Boberg et al., 1983).
A significant difficulty in evaluating the metabolic,
biochemical, and toxicological data for estragole as well
as other alkenylbenzenes is that human exposure to these
substances results from exposure to a complex mixture
of food, spice, and spice oil constituents which may
significantly impact the biochemical fate and toxicological
risk of the alkenylbenzenes. In this respect, we have previously
demonstrated that a methanolic extract from basil, which
contained estragole, also contained the flavone nevadensin
(5,7-dihydroxy-6,8,4ʹ-trimethoxyflavone) which was able to
inhibit DNA-adduct formation in rat hepatocytes exposed to the
proximate carcinogen 1ʹ-hydroxyestragole (Alhusainy et al.,
2010; Jeurissen et al., 2008). This inhibition by nevadensin was
shown to occur at the level of SULT-mediated bioactivation of
1ʹ-hydroxyestragole (Alhusainy et al., 2010; Jeurissen et al.,
2008). Altogether, the results of our previous research point
at a reduction of DNA-adduct formation and consequently
a potential reduction of cancer risk when estragole exposure
occurs within a food matrix containing SULT inhibitors
compared with what is observed upon exposure to pure
estragole. Given these previous results, the objectives of the
present study were (1) to identify the presence and nature
of possible SULT inhibitors able to interfere with estragole
bioactivation in other alkenylbenzene-containing botanical
preparations and (2) to predict the possible effects of combined
exposure to a mixture of SULT inhibitors on formation levels of
the ultimate carcinogen 1ʹ-sulfooxyestragole at physiologically
relevant concentrations by incorporating the kinetics for SULT
inhibition by the compounds in the mixture into our recently
developed physiologically based biokinetic (PBBK) models for
estragole in the liver of rat (Punt et al., 2008) and human (Punt
et al.
, 2009).
MATERIALS AND METHODS
Materials and chemicals. 1ʹ-Hydroxyestragole and 1ʹ-acetoxyestragole are genotoxic and carcinogenic compounds and caution should be taken when handling them. Twelve dried herbs and spices were purchased from local super-markets: nutmeg and mace (Myristica fragrans Houtt.), star anise (Illicium
verum Hook. f.), parsley (Petroselinum crispum (Mill.) Nyman ex A.W. Hill), pimento/allspice (Pimenta dioica (L.) Merr.), cinnamon (Cinnamomum
zeylani-cum J. Presl.), dill (Anethum graveolens L.), laurel (Laurus nobilis L.), tarragon
(Artemisia dracunculus L.), fennel (Foeniculum vulgare Mill.), anise (Pimpinella
anisum L.), and basil (Ocimum basilicum L.). 7-Hydroxycoumarin (7HC; 99%), 7-hydroxycoumarin sulfate (7HCS; 99%), quercetin, kaempferol, myricetin, api-genin, luteolin, 3ʹ-phosphoadenosine-5ʹ-phosphosulfate (PAPS), GSH, uridine 5ʹ-diphosphoglucuronic acid (UDPGA), and fetal bovine serum were obtained from Sigma Aldrich (Steinheim, Germany). Nicotinamide adenine dinucleotide (NAD+) was obtained from Roche Diagnostics (Mannheim, Germany).
Nevadensin was purchased from Apin Chemicals (Milton, U.K.). Trifluoroacetic acid was obtained from Mallinckrodt Baker B.V. (The Netherlands). Methanol (Ultra Liquid Chromatography/Mass Spectrometry, ULC/MS) and acetonitrile (ULC/MS) were obtained from Biosolve (Valkenswaard, The Netherlands), and pro-analysis grade acetic acid was purchased from VWR (Darmstadt, Germany). Hanks Balanced Salt Solution (HBSS), PBS, and gentamicin were purchased from Gibco (Paisley, U.K.). DMEM-F12 L-glutamine medium, tris-hydroxymethylaminomethane (tris), and trypsin were obtained from Invitrogen (Breda, The Netherlands). Dimethyl sulfoxide (DMSO), spectroscopic grade (99.9%) was supplied by Acros Organics (Geel, Belgium). Pooled male rat (Sprague Dawley), pooled human liver S9, and microsomal homogenates were obtained from BD Gentest (Woburn, MA), and PCP (98%) was obtained from Sigma-Riedel de Haen (Seelze, Germany). Nanopure water was obtained from a Barnstead Nanopure Type I ultrapure water system. 1ʹ-Hydroxyestragole was synthesized as described previously by Drinkwater et al. (1976) based on a method described for the synthesis of 1ʹ-hydroxysafrole (Borchert et al., 1973). Structural confir-mation by Gas Chromatography-Mass Spectrometry (GC-MS) was carried out as described previously (Punt et al., 2007).
Preparation of methanolic herb and spice extracts. Methanolic herb and spice extracts were prepared according to the method described previously (Alhusainy et al., 2010; Jeurissen et al., 2008). In short, herb and spice extracts were prepared by stirring 5 g of dried herb or spice twice for 2 h at room tem-perature, each time with 100 mL of a mixture of methanol, ultra-pure water, and acetic acid (ratio 80:19:1). The extracts obtained were filtered using a folded
filter (Schleicher & Schuell), and the pooled filtrates were evaporated to dryness under vacuum using a Rotavapor apparatus (Heidolph Laborota 4000 efficient). Star anise was first minced using a pair of scissors, and then using a pestle and mortar to obtain an efficient extraction yield. The extraction yield for the differ-ent herbs and spices ranged between 18 and 49% (w/w). Afterwards, the dried extracts were dissolved in methanol to achieve three concentrated extract stocks (2, 5, and 20 mg/ml) as described previously (Alhusainy et al., 2010).
Measurement of SULT activity. SULT activity and its inhibition by dif-ferent herb and spice extracts (nutmeg, mace, star anise, parsley, pimento/ allspice, cinnamon, dill, laurel, tarragon, fennel, anise, and basil) were quan-tified using the standard substrate 7-hydroxycoumarine (7HC) in line with our previous work (Alhusainy et al., 2010). Unlike the sulfonated metabo-lite of 1ʹ-hydroxyestragole, the metabolite resulting from the sulfonation of 7HC is stable in aqueous solution and can be detected and quantified by High Performance Liquid Chromatography-Ultraviolet detection (HPLC-UV) as described previously (Alhusainy et al., 2010; Wang et al., 2006).
Identification of SULT inhibitors in alkenylbenzene-containing herbs and spices. The methanolic herb and spice extracts which resulted in the most potent inhibition of SULT activity were fractionated using HPLC–UV, and the fractions obtained were tested for their effect on SULT activity as described in our previous work (Alhusainy et al., 2010). The compounds in the most active fractions were identified based on comparison of their UV spectra and retention time to the UV spectra and the retention time of commercially available refer-ence compounds. In addition, a literature review was made to screen for major SULT inhibitors present in these alkenylbenzene-containing herbs and spices.
Kinetics for inhibition of SULT-catalyzed conversion of 7HC into 7HCS and of oxidation and glucuronidation of 1ʹ-hydroxyestragole into 1ʹ-oxoestragole and 1ʹ-hydroxyestragole glucuronide by selected flavonoids. The Ki for SULT inhibition was determined by performing incubations for SULT activity with pooled male rat liver S9 fractions in the presence of increasing concentrations of 7HC (0–100 µM) in the absence or presence of 0.75 µM quercetin, 0.3 µM kaempferol, 5 µM myricetin, or 0.35 µM apigenin. These flavonoid concentra-tions were selected because they were close to the identified inhibitory concen-tration 50% (IC50) values determined with pooled male rat liver S9 fractions (data not shown). Incubations were performed as described previously (Alhusainy
et al., 2010). The possible effects of the identified SULT inhibitors on the detox-ification of 1ʹ-hydroxyestragole by glucuronidation and oxidation (Figure 1) were quantified in vitro as well. The Ki for the inhibition of 1ʹ-hydroxyestragole oxidation was determined by performing incubations with pooled human liver microsomes in the presence of increasing concentrations of 1ʹ-hydroxyestragole (0–1000 µM) in the absence or presence of 5 µ M quercetin, 5 µM kaempferol, 10 µM myricetin, and 10 µM apigenin. These flavonoid concentrations were selected because they were close to the identified IC50 values determined with pooled human liver microsomal fractions (data not shown). Incubations were performed as previously described (Alhusainy et al., 2010). Subsequently, the maximum velocity (Vmax), the Michaelis–Menten constant (Km), and the inhibi-tion constant (Ki) for the formation of 7HCS and 1ʹ-oxoestragole were deter-mined as described below (Data Analysis). Incubations for testing the effect of the identified SULT inhibitors on 1ʹ-hydroxyestragole glucuronidation were also performed. In short, the effect of the identified botanical constituents querce-tin, kaempferol, myricequerce-tin, and apigenin on 1ʹ-hydroxyestragole glucuronida-tion was examined with pooled human liver microsomes. The incubaglucuronida-tions were performed as described previously (Alhusainy et al., 2010; Punt et al., 2009) in the absence or presence of each respective flavonoid up to a concentration of 80 µM and at 1000 µM of 1ʹ-hydroxyestragole (a concentration close to the Km value determined by Punt et al. (2009) for the formation of 1ʹ-hydroxyestragole glucuronide by pooled human liver microsomes), both added from 200 times concentrated stock solutions in DMSO.
Effect of flavonoid mixtures on SULT activity and on oxidation of 1ʹ-hydroxyestragole. Incubations for testing the SULT inhibition by a mix-ture of quercetin, kaempferol, apigenin, and nevadensin (each flavonoid added from a 400 times concentrated stock solution in DMSO) were performed using
pooled male rat liver S9 fractions at concentrations equal to 0Ki (DMSO con-trol), 0.2Ki, 0.5Ki, 1Ki, 2Ki, 5Ki, or 10Ki of each flavonoid together with 25 µM of the substrate 7HC with incubation conditions similar to what was described previously (Alhusainy et al., 2010). Incubations for testing inhibition of con-version of 1ʹ-hydroxyestragole to 1ʹ-oxoestragole by a mixture of quercetin, kaempferol, myricetin, and apigenin were performed using pooled human liver microsomes. These flavonoids were added to the incubation mixtures from 400 times concentrated stock solutions in DMSO at final concentrations equal to 0Ki (DMSO control), 0.1Ki, 0.2Ki, 0.5Ki, 1Ki, or 2Ki of each flavonoid together with 400 µM of the substrate (a concentration close to the Km value determined by Punt et al. (2009) for the conversion of 1ʹ-hydroxyestragole to 1ʹ-oxoestragole by pooled human liver microsomes) using incubation condi-tions similar to what was described previously (Alhusainy et al., 2010).
Cultivation and treatments of HepG2 cells. A total of approximately 1 × 10⁶ HepG2 cells/well were seeded in a six-well plate with each well con-taining DMEM/F12 medium concon-taining GlutaMax, 10% fetal bovine serum, and 50 µg/ml gentamycin and incubated in a humidified incubator, 5% CO2 and 95% air at 37°C until confluent monolayers were obtained. Then, cells were washed with HBSS. Cytotoxicity of the test compounds was evaluated using the MTT test (Hussain et al., 1993). For testing detoxification and bioactivation of 1ʹ-hydroxyestragole in response to different flavonoid treatments, cells were exposed to 50 µM 1ʹ-hydroxyestragole, added from a 1000 times concentrated stock solution in DMSO, in the absence or presence of the flavonoid mixtures. All flavonoids when tested individually or in a mixture (Table 4) were added individually from 800 times concentrated stock solutions in DMSO to DMEM/ F12 containing GlutaMax and 50 µg/ml gentamicin and incubations were per-formed for 22 h at 37°C in a humidified atmosphere. To measure the effect of the different flavonoids or their mixtures on the formation of the major DNA adduct N2-(trans-isoestragole-3ʹ-y1)-2ʹ-deoxyguanosine (E-3ʹ-N2-dGuo), cells were scraped in PBS and the cells of six wells were pooled in an Eppendorf vial and centrifuged at 6000 rpm for 5 min (Eppendorf centrifuge, type 5415C, Hamburg, Germany) to obtain pellets. The pellets were stored at −20°C until DNA isolation using a Dojindo Get pure DNA Kit Cell, Tissue kit (Dojindo, Amsterdam, The Netherlands), according to the accompanying protocol. Extraction, digestion, and quantification of E-3ʹ-N2-dGuo were performed as previously described (Paini et al., 2010).
Identification, analysis, and quantification of metabolites. Identification and analysis of 7HCS, 1ʹ-hydroxyestragole glucuronide, and 1ʹ-oxoestragole by HPLC–UV and their quantification by calibration curves using available standards was performed as described in our previous work (Alhusainy et al., 2010; Punt et al., 2008, 2009). Detection and quantification of the major DNA adduct N2-(trans-isoestragole-3ʹ-y1)-2ʹ-deoxyguanosine (E-3ʹ-N2-dGuo) by Liquid Chromatography Electrospray Ionization Mass Spectrometry (LC-ESI-MS/MS) was performed as previously described (Paini et al., 2010).
Estragole PBBK model. To obtain insight in the quantitative dose- and species-dependent effects of the flavonoid inhibitors on the formation of the ultimate carcinogenic metabolite 1ʹ-sulfooxyestragole, in the target organ, the liver, we modified our previously developed PBBK models to take the inhibition into account. Supplementary figure 1 presents the basic concept of these models, which were originally developed to simulate the bioactiva-tion, and detoxification of estragole in both rat (Punt et al., 2008) and human (Punt et al., 2009). The original models were described in detail previously (Punt et al., 2008, 2009) and include separate compartments for liver, lung, and kidney, representing organs which were found to be involved in the metabol-ism of estragole. A separate compartment for fat tissue was included in order to take into account the relatively higher partition coefficient of estragole in fat tissue. All other tissues were lumped into either a rapidly perfused or slowly perfused tissue group (Ramsey and Andersen, 1984). The physiological parameters were obtained from literature (Brown et al., 1997; Supplementary table 1). The partition coefficients were estimated from the log Kow based on a published method (DeJongh et al., 1997). Log Kow values were estimated using the software package ClogP version 4.0 (Biobyte, Claremont, CA) and amounted to 3.1 for estragole and 1.6 for 1ʹ-hydroxyestragole (Supplementary
TABLE 1
Flavonoids Present in Some Alkenylbenzene-containing Herbs and Spices Based on Literature
Herb
Major flavonoids identified in herbs and spices based
on literature and their
amounts References
Basil (Ocimum basilicum L.)
Nevadensin (3.78–43.47)b (Grayer et al., 2004)
Apigenin (0.48–2.14)b (Grayer et al., 2004)
Luteolin (0.48–0.78)b (Grayer et al., 2004)
Catechinc (Shan et al., 2005)
Pimento (Pimenta dioica (L.) Merr.)
Quercetin and myricetinc (Kikuzaki et al., 2008)
Nutmeg (Myristica
fragrans Houtt.)a
Catechinc (Shan et al., 2005)
Quercetin and kaempferolc(Suhaj, 2006)
Dill (Anethum graveolens L.)
Quercetin (48–110)d (Justesen and Knuthsen,
2001) Kaempferol (16–24)d (Suhaj, 2006)
Tarragon (Artemisia
dranunculus L.)
Quercetin (10)d (Justesen and Knuthsen,
2001)
Kaempferol (11)d (Justesen and Knuthsen,
2001)
Luteolin (1)d (Justesen and Knuthsen,
2001) Parsley (Petroselinum
crispum (Mill.) Nyman ex A.W. Hill)
Quercetin (0–1)d (Justesen and Knuthsen,
2001)
Apigenin (510–630)d (Justesen and Knuthsen,
2001)
Luteolin (0–4)d (Justesen and Knuthsen,
2001)
aNutmeg is the actual seed of the tree, whereas mace is the dried “lacy”
reddish covering or aril of the seed.
bAmounts expressed as percentages of total flavones. cAmounts are not reported.
dAmounts expressed as (mg/100 g fresh weight).
TABLE 2
Kinetic Parameters of SULT-dependent Formation of 7HCS by Pooled Male Rat Liver S9 in the Absence or Presence of Different
Flavonoids Inhibitor Apparent Vmax (nmol/min/mg protein)a Apparent Km (µM) Kib (µM) Quercetin (0.75 µM) 1.8 ± 0.1* 4.3 ± 0.6 1.5 Kaempferol (0.3 µM) 1.8 ± 0.2* 4.0 ± 1.1 0.6 Myricetin (5 µM) 1.9 ± 0.01* 3.8 ± 0.3 11.9 Apigenin (0.35 µM) 1.8 ± 0.1* 3.5 ± 0.6 0.7
aProtein from pooled male rat liver S9.
bCalculated using the Michaelis–Menten equation for noncompetitive
inhibi-tion (Vapp
max = Vmax/(1+([I]/Ki)), where [I] is the flavonoid concentration (µM). An asterisk (*) indicates a significant inhibition compared with the incubation without inhibitor (p < 0.001).
Note. The control (no inhibitor) values were: Vmax = 2.7 ± 0.2 nmol/min/mg S9 protein, and Km = 4.0 ± 1.0 µM.
table 2). The apparent Vmax values for the different phase I and II reactions, expressed as nmol/min (mg microsomal or S9 protein)−1 were determined in
vitro and were scaled to the liver using a microsomal protein yield of 32 mg/g liver (Barter et al., 2007) or using an S9 protein yield of 143 mg/g liver (Medinsky et al., 1994; Supplementary table 2). The apparent Km values were also determined in vitro and were assumed to correspond to the apparent in vivo
Km values. The absorption rate constant (Ka) was set to 1.0/h, resulting in a rapid absorption of estragole from the gastrointestinal tract with an absorption half-life of 0.7 h (Anthony et al., 1987; Supplementary table 2). Mass balance equations were applied to describe the Absorption, Distribution, Metabolism, Excretion (ADME) of estragole in the different tissue compartments, and the kinetic parameters for the different bioactivation and detoxification reactions of estragole were based on in vitro kinetic data obtained using relevant rat and human tissue fractions. A full description of the mass balance equations can be found in our previous papers (Punt et al., 2008, 2009). Model equations were coded and numerically integrated in Berkeley Madonna 8.0.1 (Macey and Oster, UC Berkeley, CA, USA) using the rosenbrock’s algorithm for stiff systems. The predictions of the PBBK model for male rat (Punt et al., 2008) for the formation of 4-allylphenol and 1ʹ-hydroxyestragole glucuronide were in good agreement with observations in the literature in female Wistar rats in vivo (Anthony et al., 1987), and the PBBK model for human (Punt et al., 2009) could predict levels of the same metabolites within the same order of magnitude compared with the reported levels in vivo in two human volunteers (Sangster et al., 1987).
The uptake of estragole from the gastrointestinal tract in the PBBK models is described by a first-order process, assuming direct entry from the intestine to the liver compartment; thus, uptake of estragole into the liver is set at 100% in line with what is described in literature for estragole (Punt et al., 2008, 2009; Sangster et al., 1987).
In the present study, the PBBK models developed by Punt et al. (2008, 2009) for rat and human were modified as described below to take the flavo-noid inhibition into account. The modified models were subsequently used to predict the effect of three different flavonoid scenarios (Table 5), representing relevant dietary flavonoid intakes, on the formation of the ultimate carcinogenic metabolite 1ʹ-sulfooxyestragole using an estragole dose of 0.01 mg/kg bw/day, representing the estragole dose considered relevant for human dietary exposure from herbs and spices mainly (Smith et al., 2002). Only flavonoids which had an effect on SULT activity, as well as on oxidation of 1ʹ-hydroxyestragole, were included in the first two scenarios (Table 5). The modified models did not include submodels for ADME characteristics of each flavonoid inhibitor. Rather, as a first approximation, each flavonoid included was assumed to fol-low a similar time-dependent concentration curve in the liver of rat and human as that of estragole. To make the link between the external dose of compounds and the internal dose in the liver, the molar ratio (L) between estragole at a dose of 0.01 mg/kg bw/day and each SULT inhibitor was calculated based on the relevant intake scenarios in Table 5 and assumed to be maintained in the liver by keeping the molar ratio (L) between estragole and each flavonoid con-stant during the modeling time (24 h). This was represented in the model using the following equation: [I]=CLE × L × f, where [I] is flavonoid concentration (µmol/l), CLE is the concentration of estragole in the liver (µmol/l), L is the molar ratio between estragole and each SULT inhibitor which is calculated based on an estragole dose of 0.01 mg/kg bw/day and the relevant intake sce-nario of flavonoid(s) (Table 5). To obtain some insight into the effects resulting from differences in kinetics and uptake of estragole on the one hand and the flavonoids on the other hand, the product of CLE × L was multiplied with the factor (f) which varied from 0 to 1. Thus, when f equals 0, this represents no uptake of the flavonoid into the liver, whereas when f equals 1, this represents a 100% uptake of the flavonoid into the liver. The Michaelis–Menten equation representing the sulfonation or oxidation of 1ʹ-hydroxyestragole in the pres-ence of a single inhibitor was as follows:
dAMHES/dt = Vmax,L-HES/(1+([I]/Ki))*CLHE/PLHE/(Km,L-HES +(CLHE/PLHE)) and
dAMHEO/dt = Vmax,L- HEO/(1+([I]/Ki))*CLHE/PLHE/(Km,L-HEO+(CLHE/PLHE))
where dAMHES/dt is the rate of 1ʹ-sulfooxyestragole formation in µmol/h) and dAMHEO/dt is the rate of 1ʹ-oxoestragole formed µmol/h), Vmax,L-HES is the maxi-mum rate of formation of 1ʹ-sulfooxyestragole, Vmax,L-HEO is the maximum rate of formation of 1ʹ-oxoestragole, [I] is the concentration of quercetin (second scenario, Table 5) or nevadensin (third scenario, Table 5) in the liver µmol/l). Correspondingly, Ki is the inhibition constant for the inhibition by the respec-tive flavonoids µmol/l). Km,L-HES is the Michaelis–Menten constant for the formation of 1ʹ-sulfooxyestragole µmol/l), Km,L-HEO is the Michaelis–Menten constant for the formation of 1ʹ-oxoestragole µmol/l), CLHE is the concentra-tion of 1ʹ-hydroxyestragole in the liver µmol/l), PLHE is the liver/blood partition coefficient.
The Michaelis–Menten equations representing the sulfonation or oxidation of 1ʹ-hydroxyestragole in the presence of a mixture of noncompetitive inhibi-tors were derived assuming an additive effect (Results) and that each enzyme molecule can combine with no more than one of the inhibitors at a time and were as follows:
dAMHES/dt = Vmax,L-HES/(1+([I1]/Ki1) +([I2]/Ki2)+([I3]/Ki3)+([I4]/Ki4))*CLHE/PLHE/ (Km,L-HES +(CLHE/PLHE))
and
dAMHEO/dt = Vmax,L-HEO/(1+([I1]/Ki1)
+([I2]/Ki2)+([I3]/Ki3)+([I4]/Ki4))*CLHE/PLHE/(Km,L-HEO+(CLHE/PLHE)) where [I1], [I2], [I3], and [I4] are the concentrations of the inhibitors: querce-tin, kaempferol, myricequerce-tin, and apigenin in the liver µmol/l), respectively. Correspondingly, Ki1, Ki2, Ki3, and Ki4, are the inhibition constants for the inhibi-tion by the respective inhibitors (µmol/l), which were assumed to be equal in liver of human and rat.
Data analysis. The maximum velocity (Vmax) and Michaelis–Menten con-stant (Km) for the formation of 7HCS and 1ʹ-oxoestragole were determined by fitting the data to the standard Michaelis–Menten equation V = Vmax[S]/ (Km+[S]), with [S] being the substrate concentration (µM), using the Life Science Workbench data analysis toolbox (version 1.1.1, MDL information Systems, Inc.). The inhibition constant (Ki) for each of the selected flavonoids was calculated using the Michaelis–Menten equation for noncompetitive inhi-bition (Vapp
max=Vmax/(1+([I]/Ki)), with Vappmax being the apparent Vmax for the reaction in the presence of inhibitor(s) (nmol/min/mg S9 or microsomal pro-tein), Vmax being Vmax for the reaction in the absence of inhibitor(s) (nmol/min/ mg S9 or microsomal protein), and [I] being the inhibitor concentration (µM). The Michaelis–Menten equation representing an additive effect for a group of noncompetitive inhibitors was derived as follows:
V=Vmax/(1+([I1]/Ki1) +([I2]/Ki2)… +([In]/Kin))*[S]/(Km+[S])
The derivation is based on the assumption that each enzyme molecule can com-bine with no more than one of the inhibitors at a time. To test whether the change in the Vmax and Km in the presence of the different inhibitors or whether the SULT inhibition by the methanolic herb and spice extracts as compared with control was significant, a two-sample t-test (one sided) was performed after determining variances equality by the Levene’s version of the F test with SPSS 15.0 for Windows (SPSS Inc., Chicago, IL).
RESULTS
Inhibition of SULT Activity by Methanolic Herb and
Spice Extracts
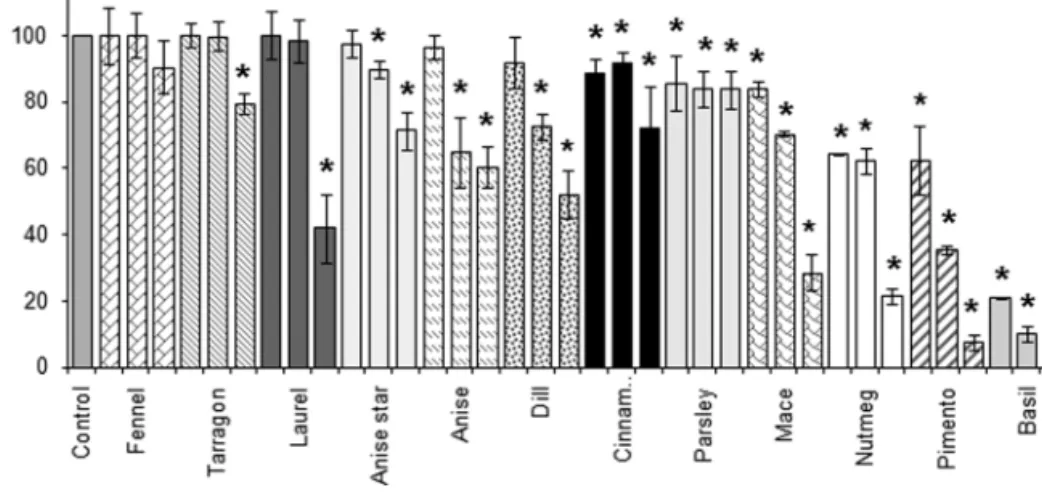
Figure 2 presents the effect of increasing concentrations of a
series of methanolic herb and spice extracts on SULT activity.
With the exception of fennel, increasing concentrations of all
methanolic herb and spice extracts inhibited SULT enzyme
activity in a dose-dependent manner. The extract from basil
was the most potent followed by the extracts from pimento/
allspice, nutmeg, and mace. Extracts from parsley, star anise,
and cinnamon displayed only moderate SULT inhibition and
the extracts from tarragon and laurel significantly inhibited
SULT activity only at the highest concentration tested (100 µg
extract/ml). Blank incubations, which lacked the cofactor
PAPS or which lacked the pooled male rat liver S9 fraction,
did not show any formation of 7HCS (data not shown). This
indicates that the inhibition of 7HCS formation by the herb and
spice extracts was fully dependent on the presence of PAPS
and the S9 fraction containing SULT. Incubations with the
SULT-inhibitor PCP inhibited SULT activity completely at
25 µM (data not shown).
Identification of SULT Inhibitors in the Methanolic Herb
and Spice Extracts
Based on our previous work (Alhusainy et al., 2010), the
fla-vonoid nevadensin was identified as the major SULT-inhibiting
constituent in the methanolic extract from basil. In the present
work, based on comparison of HPLC–UV and retention time
characteristics to HPLC–UV and retention time characteristics
of commercially available reference compounds, apigenin was
identified as the second-most potent constituent in the same
methanolic extract. Among the other most potent methanolic
herb and spice extracts, the extract from nutmeg was
frac-tionated and the compounds in the most active fractions were
identified as (+) catechin and (−) epicatechin, whereas in the
methanolic extract from pimento/allspice, eugenol was
identi-fied as the major SULT inhibitor. Based on the observation that
in potent extracts flavonoids appeared to be the major SULT
inhibitors identified, a literature review was made to screen for
major flavonoids present in alkenylbenzene-containing herbs
and spices focusing on flavonoids which have been reported
to be SULT inhibitors (Eaton et al., 1996; Morimitsu et al.,
2004). Table 1 presents an overview of the flavonoids reported
to be present in alkenylbenzene-containing herbs and spices as
derived from literature and also reported to be SULT inhibitors.
The overview presented reveals that in a series of 15 selected
alkenylbenzene-containing herbs and spices, quercetin,
kaemp-ferol, apigenin, and luteolin are among the most abundant
fla-vonoids, and of these flafla-vonoids, quercetin and kaempferol are
the most widespread in alkenylbenzene-containing herbs and
spices (Justesen and Knuthsen, 2001).
Selection of SULT-inhibiting Flavonoids to be Tested in
Subsequent Studies
Given the identification of flavonoids as an important
cat-egory of food-borne SULT inhibitors, and the fact that these
flavonoids will not only be present in the herbs and spices
ana-lyzed in this study, the selection of the flavonoids to be used in
the subsequent studies was based on their abundance in the diet
as a whole. Generally, estimation of the daily dietary flavonoid
intake is based on the intake of three quantitatively important
dietary flavonols (quercetin, kaempferol, and myricetin) and
two quantitatively important dietary flavones (apigenin and
luteolin) (Hertog et al., 1993a,b). These flavonoids are all
pre-sent in alkenylbenzene-containing herbs and spices, as well as
throughout the diet, they are all reported to have SULT
inhib-iting potency; the total estimated daily intake (EDI) levels of
these flavonoids as recorded by different studies varies between
18.3 ± 3.4 and 25.9 ± 14.5 mg/day (Hertog et al., 1993a, b; Lugasi
et al.
, 2003; Mullie et al., 2008). Given these observations, the
flavonoids quercetin, kaempferol, myricetin, apigenin, luteolin,
and nevadensin, the latter being the major flavone
constitu-ent in basil (Grayer et al., 2004), were used in our subsequconstitu-ent
experiments to examine the influence of flavonoids in mixtures
or individually on the bioactivation of 1ʹ-hydroxyestragole by
SULT and on the detoxification of 1ʹ-hydroxyestragole via
FIG. 2. Inhibition of SULT-catalyzed conversion of 7HC into 7HCS by pooled male rat liver S9 fractions in the absence (control) or presence of increasing
concentrations (10, 25, and 100 µg/ml) of different methanolic herb and spice extracts. 100% 7HCS formation is equal to 1.3 ± 0.1 nmol/min/mg S9 protein. Data points represent mean (±SD) of triplicate measurements obtained in independent experiments. An asterisk (*) indicates a significant inhibition compared with the incubation without inhibitor (p < 0.05).
glucuronidation and oxidation using relevant tissue fractions or
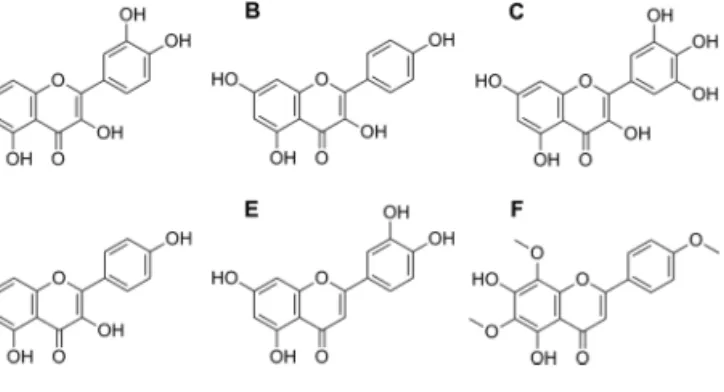
an intact cell model. Figure 3 presents the structure of the
fla-vonoid inhibitors included in the study.
Inhibition of SULT-catalyzed Conversion of 7HC
Into 7HCS and of Oxidation and Glucuronidation
of 1ʹ-Hydroxyestragole Into 1ʹ-Oxoestragole and
1ʹ-Hydroxyestragole Glucuronide by the Selected
Flavonoids
After identification of major SULT inhibitors present in
the selected alkenylbenzene-containing herbs and spices
(nevadensin, quercetin, kaempferol, myricetin, and apigenin),
initial studies testing the effect of the selected flavonoids
quercetin, kaempferol, myricetin and apigenin on
SULT-mediated conversion of 7HC into 7HCS and on oxidation
or glucuronidation of 1
ʹ-hydroxyestragole revealed that
only SULT and oxidation activity appeared to be inhibited.
Nevadensin was not included in these inhibition studies
because its effect on sulfonation, glucuronidation, and
oxidation was already determined in our previous work
(Alhusainy et al., 2010). Oxidation and glucuronidation of
1
ʹ-hydroxyestragole were not inhibited by nevadensin to any
significant extent even at nevadensin concentrations up to
20 μM (Alhusainy et al., 2010). The effect of the other selected
flavonoids quercetin, kaempferol, myricetin, and apigenin
on glucuronidation of 1ʹ-hydroxyestragole was examined by
adding each flavonoid up to 80 µM together with 1000 µM of
the substrate 1
ʹ-hydroxyestragole in incubations with pooled
human liver microsomes and the cofactor for glucuronidation
(UDPGA). None of the flavonoids tested resulted in any
significant effect on the formation of 1
ʹ-hydroxyestragole
glucuronide. Because the catalytic efficiency for the
SULT-catalyzed conversion of 7HC into 7HCS and for
1
ʹ-hydroxyestragole into 1ʹ-sulfooxyestragole is higher in the
liver of rat compared with the liver of human (Alhusainy et al.,
2010; Wang et al., 2006), in vitro incubations for inhibition of
SULT activity by the selected flavonoids was performed using
pooled male rat liver S9. Oxidation of 1
ʹ-hydroxyestragole
to 1
ʹ-oxoestragole represents a minor metabolic route in
the liver of male rat as compared with the liver of human
suggesting that the inhibition of this pathway would hardly
influence the overall bioactivation of estragole in the liver of
male rat but may influence the overall metabolism in human.
Therefore, in vitro incubations for inhibition of oxidation
of 1ʹ-hydroxyestragole by the selected flavonoids were
performed in pooled human liver microsomes. In this way,
the kinetics for inhibition of SULT activity and of oxidation
of 1ʹ-hydroxyestragole were determined, and the mode of
inhibition and the respective K
ivalues were defined. Tables 2
and 3 display the Michaelis–Menten parameters (V
maxand K
m)
and inhibition constants (K
i) for 7HCS and 1ʹ-oxoestragole
formation by pooled male rat liver S9 and pooled human
liver microsomal fractions, respectively, in the presence or
absence of the flavonoids quercetin, kaempferol, myricetin,
and apigenin. The apparent V
maxvalues for sulfonation
were lowered significantly (minus 30–33%; p < 0.001 )
in the presence of each flavonoid, whereas the apparent K
mvalues were not statistically significantly different from the
K
mvalue determined in the absence of each flavonoid. The
apparent V
maxvalues for oxidation of 1ʹ-hydroxyestragole
were lowered significantly (minus 52–77%; p < 0.001 ) in the
presence of each flavonoid, whereas the apparent K
mvalues
were not statistically significantly different from the K
mvalue
determined in the absence of each flavonoid. These results
point at a noncompetitive type of inhibition of sulfonation, as
well as oxidation by each individual flavonoid. Applying the
Michaelis–Menten equation for noncompetitive inhibition,
the inhibition constant (K
i) for SULT inhibition as calculated
from the data amounted to, respectively, 1.5, 0.6, 11.9, and
0.7
µM for quercetin, kaempferol, myricetin, and apigenin.
The inhibition constants (K
i) for inhibition of the conversion
of 7HC to 7HCS by the different flavonoids are not expected
to be significantly different when using 7HC instead of
1ʹ-hydroxyestragole as a substrate. This is based on the type of
inhibition that was shown to be noncompetitive meaning that
only the apparent V
maxand not the apparent K
mof the enzyme
was found to be affected, which corroborates the assumption
that flavonoids do not interfere with the substrate binding site
and exert their inhibiting effect by interaction with another
site on the enzyme than the site involved in substrate binding
(Simmons, 1996). In our previous work (Alhusainy et al.,
2010), the type of SULT inhibition (noncompetitive) and the
K
i(4 nM) for this inhibition by the flavonoid nevadensin was
similar in pooled male rat and pooled human liver S9 fractions.
Based on this result, it was assumed that the K
iand the type
of SULT inhibition by the flavonoids quercetin, kaempferol,
myricetin, and apigenin determined in pooled male rat liver S9
will also be similar in human liver S9, given that the type of
inhibition by each of them was also noncompetitive.
The inhibition constant (K
i) for inhibition of oxidation of
1ʹ-hydroxyestragole to 1ʹ-oxoestragole by quercetin,
kaemp-ferol, myricetin, and apigenin amounted to 4.5, 1.5, 4.8, and
6.5 µM, respectively (Table 3).
FIG. 3. Structural formulas of (A) quercetin, (B) kaempferol, (C)
myrice-tin, (D) apigenin, (E) luteolin, and (F) nevadensin, the major SULT inhibitors in alkenylbenzene-containing herbs and spices and/or throughout the diet.
Effect of Selected Flavonoid Mixtures on SULT-catalyzed
Conversion of 7HC Into 7HCS and on Oxidation of
1ʹ-Hydroxyestragole Into 1ʹ-Oxoestragole
Given that the diet may contain a variety of SULT inhibitors,
experiments were performed to assess the effect of combined
flavonoid exposure on SULT activity, as well as on oxidation of
1
ʹ-hydroxyestragole to 1ʹ-oxoestragole. To this end, a test mixture
was defined that mimics a realistic dietary flavonoid mixture and
included four flavonoids which were found to be abundant in
alkenylbenzene-containing herbs and spices and able to inhibit
SULT activity, namely, quercetin, kaempferol, apigenin, and
nevadensin, the latter being previously identified as a potent
SULT inhibitor present in basil (Alhusainy et al., 2010). The
simultaneous addition of quercetin, kaempferol, apigenin, and
nevadensin at concentrations equal to 0.2K
i, 0.5K
i, 1K
i, 2K
i, 5K
i,
or 10K
iof each flavonoid together with 25 µM of the substrate
7HC lowered the SULT activity in incubations with pooled male
rat liver S9 (Figure 4). The reduction in the formation of 7HCS
was similar to the reduction predicted by the Michaelis–Menten
equation defined for a series of independent noncompetitive
inhibitors (Figure 4), which verifies our assumption for a
noncompetitive type of inhibition by each individual flavonoid
on SULT enzyme activity, as well as an additive interaction
between the flavonoids in the mixture (Figure 4).
With the exception of nevadensin that had no effect on
1
ʹ-hydroxyestragole oxidation in pooled human liver
micro-somal fractions (Alhusainy et al., 2010), the other SULT
inhib-itors identified in alkenylbenzene-containing herbs and spices,
namely, quercetin, kaempferol, myricetin, and apigenin, had
an inhibiting effect on the oxidation of 1
ʹ-hydroxyestragole.
Therefore, incubations for testing the inhibition of
conver-sion of 1
ʹ-hydroxyestragole to 1ʹ-oxoestragole by a mixture
of quercetin, kaempferol, myricetin, and apigenin were
per-formed. Figure 5 shows that the simultaneous addition of
quercetin, kaempferol, myricetin, and apigenin at
concentra-tions equal to 0.1K
i, 0.2K
i, 0.5K
i, 1K
i, or 2K
i, for each
flavon-oid together with 400 µM of the substrate 1ʹ-hydroxyestragole
reduced the formation of 1ʹ-oxoestragole. The observed
inhib-ition in the formation of 1ʹ-oxoestragole in the presence of
the flavonoid mixture at concentrations higher than their K
ivalues matched the predicted values of the derived Michaelis–
Menten formula defined for a series of independent
non-competitive inhibitors, whereas at concentrations lower than
their K
ivalues, the predicted values were somewhat higher
than the values actually observed, which may be due to
dif-ferent types of enzymes playing a role in the oxidation of
FIG. 4. SULT-dependent formation of 7HCS as measured in incubations
with pooled male rat liver S9 in the presence of increasing concentrations of flavonoid mixtures containing quercetin, kaempferol, apigenin, and nevadensin at 0Ki, 0.2Ki, 0.5Ki, 1Ki, 2Ki, 5Ki, or 10Ki of each flavonoid (), or as predicted by our derived Michaelis–Menten equation assuming an additive effect for a series of independent noncompetitive inhibitors (solid line).
FIG. 5. Formation of 1ʹ-oxoestragole as measured in incubations with
pooled human liver microsomes in the presence of increasing concentrations of flavonoid mixtures containing quercetin, kaempferol, myricetin, and apigenin at 0Ki, 0.1Ki, 0.2Ki, 0.5Ki, 1Ki, or 2Ki of each flavonoid (), or as predicted by our derived Michaelis–Menten equation assuming an additive effect for a series of independent noncompetitive inhibitors (solid line).
TABLE 3
Kinetic Parameters of 1ʹ-Oxoestragole Formation by Pooled Human Liver Microsomes in the Absence or Presence of
Different Flavonoids Inhibitor Apparent Vmax (nmol/min/mg protein)a Apparent Km (µM) Kib (µM) Quercetin (5 µM) 4.8 ± 1.0* 1046 ± 258 4.6 Kaempferol (5 µM) 2.3 ± 0.3* 605 ± 69 1.5 Myricetin (10 µM) 3.5 ± 0.9* 727 ± 292 5.4 Apigenin (10 µM) 4.0 ± 0.4* 613 ± 66 6.7
aProtein from pooled human liver microsomes.
bCalculated using the Michaelis–Menten equation for noncompetitive
inhibi-tion (Vapp
max = Vmax/(1+([I]/Ki)), where [I] is the flavonoid concentration (µM). An asterisk (*) indicates a significant inhibition compared with the incubation without inhibitor (p < 0.001).
Note. The control (no inhibitor) Vmax = 10 ± 1.4 nmol/min/mg microsomal protein, and Km = 688 ± 119 µM.
1ʹ-hydroxyestragole. Thus, other modes of interactions than
an additive interaction at concentrations lower than K
ivalues
cannot be excluded. Nonetheless, at all concentrations of the
flavonoid mixture, the difference between predicted values
and observed ones was less than twofold. Moreover, a fit to
the experimental data assuming the inhibition to be
competi-tive instead of noncompeticompeti-tive matched the experimental data
worse, showing deviations even at the high concentrations
and larger variation (up to 2.2-fold) at the lower concentration
range (data not shown). Therefore, it was concluded that the
predictions made by the derived formula gives a reasonable
first approximation.
Effect of Flavonoid Mixtures on Conversion and DNA
Binding of 1ʹ-Hydroxyestragole in HepG2 Cells
To investigate whether the inhibition of bioactivation
and detoxification pathways of 1ʹ-hydroxyestragole would
also be observed in an intact cellular system, cells from
the human HepG2 hepatoma cell line were exposed to
1ʹ-hydroxyestragole in the absence or presence of different
flavonoids and their combinations, followed by detection of
the level of 1ʹ-hydroxestragole oxidation, glucuronidation, and
sulfonation, the latter reflected by the formation of the major
estragole DNA adduct (E-3ʹ-N2-dGuo). Table 4 summarizes
the different flavonoid mixtures and/or pure flavonoids which
were investigated in the HepG2 model system. The outcomes
of these studies will reveal whether selected flavonoids and/or
their mixtures are able to inhibit SULT-mediated bioactivation
of 1ʹ-hydroxyestragole in this cellular system, resulting in an
ultimate shift of metabolism in favor of detoxification at the
cost of bioactivation. The compounds were not cytotoxic to
HepG2 cells under the conditions used in these experiments
as observed by MTT activity measurements (data not shown).
Fig. 6A reveals that a significant reduction in the formation
of E-3ʹ-N2-dGuo compared with control (no flavonoid) is
observed in the human HepG2 cells following co-administration
of 50 µM of the substrate 1ʹ-hydroxyestragole and 13, 5.4, 2.3,
1.5, and 0.34 µM of a flavonoid mixture containing quercetin,
kaempferol, myricetin, apigenin, and luteolin respectively (each
at a concentration corresponding to its relative contribution
in the diet, Table 4). E-3ʹ-N2-dGuo formation in the HepG2
cells is also inhibited significantly by 100
µM of the same
flavonoids in a mixture (each at 20 µM), by 50 µM kaempferol,
or by 100
µM quercetin (Fig. 6A). The data indicate that
the flavonoids are able to pass the cell membrane and exert
an intracellular effect on SULT mediated bioactivation of
1ʹ-hydroxyestragole.
HPLC-UV analysis of the media revealed a significant
reduction in the formation of 1ʹ-oxoestragole (measured as
GS-1ʹ-oxoestragole, Fig. 6B) and a significant increase in
the formation of 1ʹ-hydroxyestragole glucuronide (Fig. 6C).
Altogether, the data indicate a shift metabolism from
sulfona-tion and oxidasulfona-tion to glucuronidasulfona-tion, which is a detoxificasulfona-tion
pathway for 1ʹ-hydroxyestragole.
PBBK-Model-Based Predictions for Estragole Metabolism
in the Presence of Selected SULT-inhibiting Flavonoids
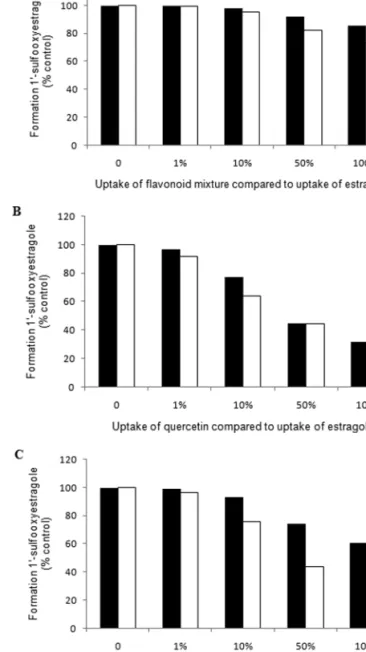
Figure 7A illustrates the PBBK-model-based predictions
for the formation of 1ʹ-sulfooxyestragole in the liver of rat
and human after co-administration of 0.01 mg/kg bw/day of
estragole, representing the estragole dose considered relevant
for human dietary exposure from herbs and spices mainly
(Smith et al., 2002), and a mixture of the flavonoids
quer-cetin, kaempferol, myriquer-cetin, and apigenin at a total EDI level
of 20.0 ± 6.3 mg/day (Lugasi et al., 2003; Mullie et al., 2008),
which corresponds to 0.33 mg flavonoids/kg bw/day for a
per-son of 60 kg. The results presented in Fig. 6A reveal that the
formation of 1ʹ-sulfooxyestragole in the liver of rat after 24 h
is predicted to decrease by 0.18%, 1.7%, 8%, and 14.4%
com-pared with control when assuming, respectively, 1%, 10%,
50%, and 100% uptake of the flavonoid mixture, whereas in
the liver of human, the formation of 1ʹ-sulfooxyestragole was
predicted to decrease by, respectively, 0.5%, 5%, 18%, and
27%. In addition, the possible consequences of consumption of
estragole together with a flavonoid food supplement containing
500 mg of quercetin, representing food supplements actually
available on the market, was also studied. The PBBK model
predictions indicated that the intake of 500 mg quercetin, which
corresponds to 8.3 mg querectin/kg bw/day for a person of
60 kg, together with 0.01 mg/kg bw of estragole may decrease
TABLE 4
Flavonvoid Treatments Tested in Human HepG2 Cells Exposed to 50 µM of 1′-Hydroxyestragole for 22 h at 37°C Sample Flavonoid treatments Concentrations in 2.5 mL medium Rationale
1 Quercetin 13 µM Based on dietary levels of 12, 4.6, 2.2, 1.2, and 0.3 mg/day (Lugasi et al., 2003; Mullie et al., 2008) assuming 3 l plasma and 100% bioavailability
Kaempferol 5.4 µM Myricetin 2.3 µM Apigenin 1.5 µM
Luteolin 0.34 µM
2 Quercetin 20 µM High-dose mixture, up to a total level of 100 µM, shown to be without cytotoxicity Kaempferol 20 µM Myricetin 20 µM Apigenin 20 µM Luteolin 20 µM
3 Quercetin 100 µM Based on highest dose without cytotoxicity given that the level in dietary quercetin supplements of 500 mg/day, assuming 3 l plasma and 100% bioavailability would amount to 552 µM 4 Kaempferol 50 µM Kaempferol was the most
potent flavonoid in inhibiting SULT activity and oxidation of 1ʹ-hydroxyestragole. The con-centration selected is equal to the concentration of the substrate, 1ʹ-hydroxyestragole
the formation of 1
ʹ-sulfooxyestragole in the liver of rat by 3%,
23%, 55%, and 69% when assuming 1%, 10%, 50%, and 100%
uptake of quercetin, and in the liver of human, formation of
1
ʹ-sulfooxyestragole was predicted to decrease by, respectively,
8.6%, 36%, 56%, and 63% at these levels of quercetin uptake
(Fig. 7B).
In a third PBBK modeling scenario, the protective effect of
nevadensin against SULT-mediated bioactivation of estragole
in consumers of basil was evaluated. Assuming that basil
contains 0.5% of essential oil (Smith et al., 2002) and that the
essential oil of basil contains 22.7% of estragole (Sanda et al.,
1998), an EDI of 0.01 mg/kg bw/day of estragole would result
from an intake of 529 mg basil/day. Based on our previous work
(Alhusainy et al., 2010), the amount of nevadensin in 529 mg of
basil is expected to be 0.34 mg, and this would result in an EDI
FIG. 6. Formation of (A) E-3ʹ-N2-dGuo, (B) 1ʹ-oxoestragole (measured
as GSH adducts), and (C) 1ʹ-hydroxyestragole glucuronide in HepG2 cells exposed for 22 h to 50 µM 1ʹ-hydroxyestragole in the absence or presence of a mixture of the following flavonoids: quercetin, kaempferol, myricetin, api-genin, and luteolin (13, 5.4, 2.3, 1.5, and 0.34 ,µM respectively), 100 µM of the same flavonoids in a mixture (each at 20 µM), 50 µM kaempferol, or 100 µM quercetin.
FIG. 7. PBBK-model-based predictions for the formation of
1ʹ-sulfooxyestragole in the liver of rat (black bars) and human (white bars) after co-administration of 0.01 mg/kg bw/day of estragole and (A) a mixture of flavonoids at their EDI levels including 12 mg/day of quercetin, 4.6 mg/day of kaempferol, 2.2 mg/day of myricetin, and 1.2 mg/day of apigenin; (B) quer-cetin at a dose level present in food supplements amounting to 500 mg/day; or (C) nevadensin at 0.34 mg/day, representing the dose level resulting from intake of 529 mg of basil, which is the amount of basil resulting in 0.01 mg/kg bw/ day of estragole (Alhusainy et al., 2010; Sanda et al., 1998; Smith et al., 2002).
for nevadensin of 0.0057 mg/kg bw/day for a person of 60 kg. At
an estragole dose of 0.01 mg/kg bw/day and a nevadensin intake
of 0.0057 mg/kg bw/day, the formation of 1ʹ-sulfooxyestragole
in the liver of rat is predicted to decrease by 0.77%, 7%, 26%,
and 40% compared with control, whereas in the liver of human,
the formation of 1ʹ-sulfooxyestragole was predicted to decrease
by 3.5%, 25%, 56%, and 68% when assuming, respectively,
1%, 10%, 50%, and 100% uptake of nevadensin (Fig. 7C).
Finally, it is worth noting that even when the concentration
of estragole was increased 1000-fold keeping the
concentra-tions of the SULT-inhibiting flavonoids at the values defined
in Table 5, the percentage inhibition of 1ʹ-sulfooxyestragole
formation remains the same as obtained at the 1000-fold lower
dose of estragole. This is a characteristic of noncompetitive
inhibition, for which the level of inhibition depends only on the
dose of the inhibitors (Simmons, 1996).
DISCUSSION
The alkenylbenzene estragole is an important natural
con-stituent of herbs and spices. However, several studies have
shown both genotoxic and carcinogenic properties for this
com-pound in rodents (Drinkwater et al., 1976; Miller, 1983). These
experiments were performed using the pure compound dosed
by gavage in high doses, whereas in herbs and spices, estragole
is present in relatively lower amounts together with other
con-stituents in a food matrix, which can influence its biochemical
fate. The present study reports that methanolic extracts from
different alkenylbenzene-containing herbs and spices were
able to inhibit SULT activity involved in the formation of the
proximate hepatocarcinogen 1
ʹ-sulfooxyestragole. Flavonoids
including nevadensin, quercetin, kaempferol, myricetin, and
apigenin were the major constituents responsible for this
inhib-ition of SULT activity with K
ivalues in the nano- to micromolar
range. Apart from SULT inhibitors present in herbs and spices
and identified in the present study, the regular human diet is
rich in other SULT inhibitors ranging from a number of natural
dietary chemicals, such as polyphenols (Eaton et al., 1996), to
a number of food additives such as (±)-catechin, (+)-catechin,
4-chlorobenzoic acid, aspartame, benzoic acid, erythrosine,
gallic acid, octyl gallate, p-hydroxybenzoic acid, propyl
gall-ate, protocatechuic acid, saccharin, tannic acid, tartrazine, and
vanillin, which have all been shown to be capable to inhibit
the sulfonation of a number of xenobiotics and endobiotics
in human liver cytosol to varying extents (Bamforth et al.,
1993). A great volume of literature data supports the
plausi-bility of noncompetitive inhibition of sulfonation of various
substrates by different flavonoids such as quercetin, genistein,
(+)-catechin, kaempferol, apigenin, and diadzein (Ghazali and
Waring, 1999; Mesía-Vela and Kauffman, 2003; Walle et al.,
1995). The various flavonoids tested in this study were also
shown to be able to significantly inhibit estragole DNA-adduct
formation in human HepG2 cells exposed to the proximate
car-cinogen 1
ʹ-hydroxyestragole (50% reduction compared with
control) even at concentrations as low as 25 µM of the
flavon-oid mixture. The results of the present work also show that at
levels of flavonoids sufficient to inhibit SULT activity, they can
also inhibit the oxidation of 1
ʹ-hydroxyestragole, which is the
major phase-II pathway of 1
ʹ-hydroxyestragole in the liver of
human. Additional results of the present study revealed that
in the human HepG2 cells exposed to 1
ʹ-hydroxyestragole in
the presence of flavonoids, reduction in the activity of
sulfon-ation and oxidsulfon-ation results in a metabolic shift toward
glu-curonidation, which serves as a detoxification pathway for
1
ʹ-hydroxyestragole.
In a next step, the kinetics for SULT inhibition were
incorporated in the PBBK models for estragole in rat and human
to predict the effect of co-exposure to estragole and (mixtures
of) the different flavonoids on the bioactivation in vivo. The
PBBK model-based predictions indicate that the reduction of
estragole bioactivation in rat and human by co-administration
of the flavonoids is dependent on whether the intracellular
liver concentrations of the flavonoids can reach their K
ivalues
determined in the present study. For example, high intake levels
of SULT inhibitors (e.g. quercetin) at levels present in food
TABLE 5
Input Data for PBBK Models Representing Three Possible Intake Scenarios of Flavonoids and Estragole at 0.01 mg/kg bw/day
Scenario Constant (L)a Input PBBK (Flavonoid:estragole) [Flavonoid] = CLE × L × f EDI of flavonoidsb Quercetin (4 × 10⁻⁵ mol/ day) 9.8 [Quercetin] = CLE × 9.8 × f Kaempferol (1.6 × 10⁻⁵ mol/day) 4.0 [Kaempferol] = CLE × 4.0 × f Myricetin (7 × 10⁻⁶ mol/ day) 1.7 [Myricetin] = CLE × 1.7 × f Apigenin (4.4 × 10⁻⁶ mol/ day) 1.1 [Apigenin] = CLE × 1.1 × f Quercetin tablets (0.002 mol/day) 408 [Quercetin] = CLE × 408 × f Nevadensin (1.1 × 10⁻⁶ mol/day)c 0.25 [Nevadensin] = CLE × 0.25 × f
Note. CLE is the concentration of estragole in the liver (µmol/l), L is a constant that is determined based on the corresponding intake scenario and f is the molar ratio between estragole and each flavonoid that varies from 0 (no SULT inhibitors uptake into liver) to 1 (representing 100% uptake of a flavonoid into the liver).
aConstant (L) is calculated as the ratio between the EDI of a flavonoid and the
EDI of estragole of 0.01 mg/kg bw/day (Smith et al., 2002), which is equivalent to 4.1 × 10⁻⁶ mol/day given a molecular weight for estragole of 148 g/mol and assuming a body weight of 60 kg.
bBased on Lugasi et al., 2003; Mullie et al., 2008.
cAssuming that basil contains 0.5% of essential oil (Smith et al., 2002) and
that the essential oil of basil contains 22.7% of estragole (Sanda et al., 1998), an EDI of 0.01 mg/kg bw/day of estragole would result from a 529 mg basil/day. The amount of nevadensin in 529 mg of basil is expected to result in a daily intake of 0.34 mg/day or 1.1 × 10⁻⁶ mol/day for a 60 kg person (Alhusainy et al., 2010).