email: smithahn@iiap.res.in; knn@iiap.res.in; sampoorna@iiap.res.in
2
Institute of Astronomy, ETH Zurich, CH-8093 Zurich, Switzerland email: stenflo@astro.phys.ethz.ch
3
Istituto Ricerche Solari Locarno, Via Patocchi, 6605 Locarno-Monti, Switzerland email: mbianda@irsol.ch; ramelli@irsol.ch
Abstract. In our previous attempt to model the Stokes profiles of the Cr i triplet at 5204-5208 ˚A and the Ba ii D2 at 4554 ˚A, we found it necessary to slightly modify the standard FAL model
atmospheres to fit the observed polarization profiles. In the case of Cr i triplet, this modification was done to reduce the theoretical continuum polarization, and in the case of Ba ii D2, it was
needed to reproduce the central peak in Q/I. In this work, we revisit both these cases using different standard model atmospheres whose temperature structures closely resemble those of the modified FAL models, and explore the possibility of synthesizing the line profiles without the need for small modifications of the model atmosphere.
Keywords. line: formation, line: profiles, polarization, radiative transfer, scattering, Sun:
at-mosphere
1. Introduction
The Cr i triplet at 5204-5208 ˚A and the Ba ii D2 at 4554 ˚A are some of the well
known chromospheric lines showing prominent polarization signals in the Second Solar Spectrum. The Cr i triplet profiles are governed by J -state interference (Smitha et al. 2012) and the Ba ii D2 line is governed by F -state interference (Smitha et al. 2013b).
To model the limb observations of Cr i triplet at μ = 0.15 (μ = cos θ, with θ being the heliocentric angle), Smitha et al. (2012) had to slightly modify FALF, one of the standard model atmospheres of Fontenla et al. (1993). This modification, in the form of an increase in the temperature at the continuum formation heights (0-500 km above the photosphere), was necessary to get a good fit to Q/I in the continuum.
In the case of Ba ii D2 4554 ˚A limb observations (μ = 0.1), which were modeled in
Smitha et al. (2013b), the temperature of the FALX model (Avrett 1995) had to be slightly reduced at the heights where the line center is formed, in order to reproduce the central peak in Q/I. Subsequently it was shown in Smitha et al. (2014a) that although this modified FALX model could reproduce the observations at μ = 0.1, it could not reproduce the observations at other limb distances.
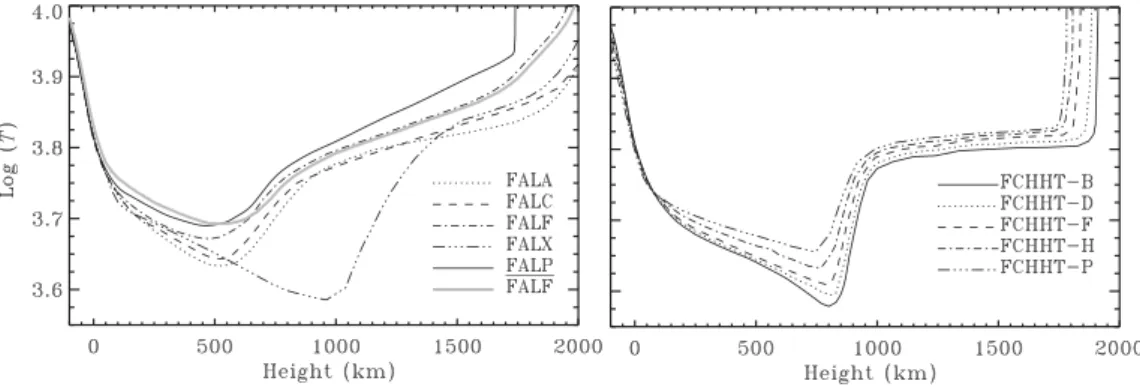
In this paper, we explore the possibility of modeling the above two line profiles with the updated FAL models presented in Fontenla et al. (2009, referred to as the FCHHT models). A comparison between the temperature structures of the FAL and the FCHHT models is shown in Figure 1 (see also Rutten & Uitenbroek 2012).
Figure 1. Temperature structures of the FAL and FCHHT models.
2. Revisiting the Cr i triplet
The model atmospheres tried in Smitha et al. (2012), namely the FALA, FALC, FALF and FALX, predicted a value of the continuum polarization larger than the one found from observations. This problem of over estimation of the continuum polarization by the one-dimensional model atmospheres was also noted in Stenflo (2005). A similar problem was faced in Smitha et al. (2014b) while modeling the Sc ii 4247 ˚A line.
In Smitha et al. (2012), to overcome this, the FALF model was modified into FALF and the temperature was increased in the deeper layers of the atmosphere to reduce the continuum polarization. The FALP model, which is hotter than the FALF model, has a temperature profile similar to the FALF in these deeper layers. However, the FALP model fails to provide as good a fit as FALF.
The FCHHT-P model, which represents a plage region and has a temperature struc-ture significantly different from that of the FALF model, provides a good fit to the Cr i triplet profiles observed in a quiet region. For modeling, we use the partial frequency redistribution (PRD) capable Multi-level Approximate Lambda Iteration code of Uiten-broek (2001) and the PRD theory of J -state interference described in Smitha et al. (2011, 2013a). Further details are described in Smitha et al. (2012). A comparison between the profiles from the FALP and FCHHT-P is shown in Figure 2. The microturbulent mag-netic field strengths used to get the line center amplitude of the three lines are 0 G, 2.5 G and 1.8 G respectively, for the FCHHT-P model.
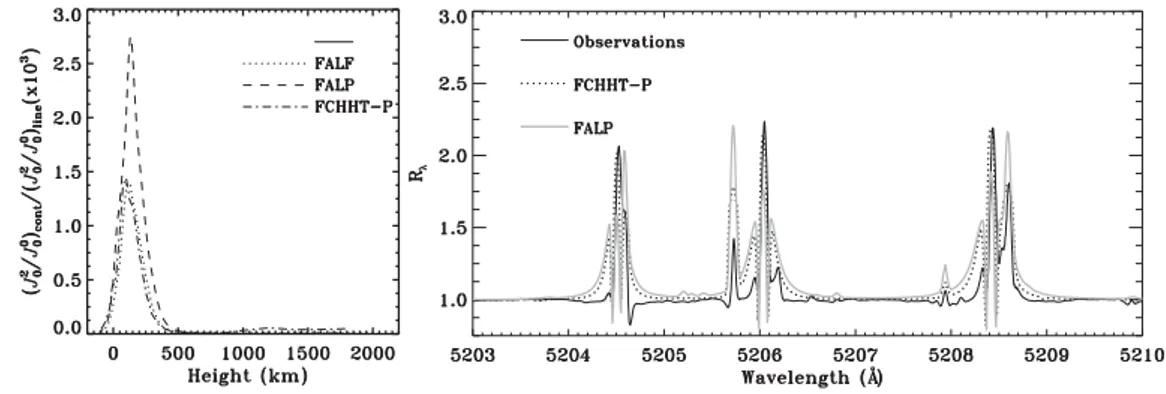
The differences in the profiles from the models FALF, FALP and FCHHT-P can be understood by computing the ratio of the continuum-to-line anisotropy. The left panel of Figure 3 shows this ratio for the 5206 ˚A line of the Cr i triplet. The FALP model, despite having a temperature structure similar to that of FALF at continuum heights (left panel of Figure 1), it does not provide as good a fit as the FCHHT-P model (see Figure 2). The FALP model predicts similar anisotropy to FALF at continuum heights but fails to provide the required continuum-to-line anisotropy ratio which is necessary to obtain a good fit, and this is provided by the FCHHT-P model. Thus the FALF and FCHHT-P models reproduce the observed Cr i triplet profiles at μ = 0.15.
As a further test of the model atmosphere, we compared the observed and theoretical intensity ratio Rλ = (I/Ic)μ/(I/Ic)μ = 1. This is shown in the right panel of Figure 3,
computed from the FCHHT-P and FALP models. Rλ represents the third solar spectrum
described in Stenflo (2015). The FCHHT-P model provides as good a fit to the third solar spectrum as it does to the second solar spectrum. The fit from the FALP model is not as good as the one from the FCHHT-P model. However there are small differences seen between the observed and the theoretical profiles around the 5206 ˚A and the 5208 ˚A lines
Figure 2. Comparison between the observed and the theoretical Stokes (I, Q/I) profiles of the
Cr i triplet computed using the FCHHT-P and FALP models at μ = 0.15.
Figure 3. Left panel : Ratio of continuum to line (5206 ˚A) anisotropy (×103); Right panel : Comparison between the observed (Stenflo 2015) and theoretically computed profiles of the third solar spectrum, Rλ = (I/Ic)μ/(I/Ic)μ = 1 with μ = 0.15.
which may be improved by including the multidimensional effects. Thus the third solar spectrum now provides an additional constraint to test the reliability of the solar model atmospheres.
3. Revisiting the Ba ii D
2line
Modeling the (I, Q/I) observations of the Ba ii D2line at μ = 0.1, which was attempted
in Smitha et al. (2013b, see also Smitha et al. 2014a), was possible only after a small modification in the temperature structure of the FALX model at heights where the line
Figure 4. Comparison between the observed and theoretical (I, Q/I) profiles of the Ba ii D2
line computed using the FCHHT models. The profiles from a 2-component model constructed by combining FCHHT-F and FCHHT-P models in equal proportion fits the observations at μ = 0.1 but fails at higher μ values.
core is formed. This modification was necessary to reproduce the central peak formed due to the even isotopes.
In this paper, we have revisited the modeling of this line using the FCHHT models. We find that four of the five models produce the central peak in Q/I. The intensity profiles from these models match the observed ones well, whereas the Q/I profiles are broader (see the top two panels of Figure 4). It is possible to combine the two models FCHHT-F and FCHHT-P in equal proportion to build a 2-component model like the one described in Holzreuter et al. (2006) and reproduce the observed Q/I profile at μ = 0.1 (see the bottom panels in Figure 4). However as μ increases, we continue to face problems in reproducing the central peak. At other μ values we may need other combinations of the model atmospheres. This demonstrates the possibility of modeling the Ba ii D2 profile
without the need for a modification in the standard model atmospheres. However it may not be possible to find a single one-dimensional model atmosphere that fits the observations at all μ values.
4. Conclusions
In this work, we have explored the possibility of modeling the chromospheric Cr i triplet at 5206 ˚A and the Ba ii D2 at 4554 ˚A line without modifying the standard
model atmospheres. The updated FCHHT models are able to reproduce both these cases. While the Cr i triplet can be modeled with the FCHHT-P model, the Ba ii D2 needs a
third solar spectra, and their center-to-limb variations, provide a rich set of complex observational constraints that should ideally be satisfied simultaneously by a given model atmosphere. Our results here indicate that only multidimensional atmospheric modeling can have a chance to simultaneously reproduce these constraints.
Acknowledgements
We acknowledge the use of the HYDRA cluster facility at the Indian Institute of Astrophysics for computing the results presented in the paper. We are grateful to Dr. Han Uitenbroek for providing his realistic atmospheric modeling code.
References
Avrett, E. H. 1995, in: J. R. Kuhn & M. J. Penn (eds.), Infrared tools for solar astrophysics: What’s next?, Proc. 15th NSO Sac Peak Workshop, p. 303
Fontenla, J. M., Avrett, E. H., & Loeser, R. 1993, ApJ 406, 319
Fontenla, J. M., Curdt, W., Haberreiter, M., Harder, J., & Tian, H. 2009, ApJ 707, 482 Holzreuter, R., Fluri, D. M., & Stenflo J. O. 2006, A&A 449, L41
Rutten, R. J. & Uitenbroek, H. 2012, A&A 540, A86
Smitha, H. N., Nagendra, K. N., Sampoorna, M., & Stenflo, J. O. 2013a, JQSRT 115, 46 Smitha, H. N., Nagendra, K. N., Stenflo, J. O., Bianda, M., Sampoorna, M., Ramelli, R., &
Anusha, L. S. 2012, A&A 541, A24
Smitha, H. N., Nagendra, K. N., Stenflo, J. O., & Sampoorna, M. 2013b, ApJ 768, 163 Smitha, H. N., Nagendra, K. N., Stenflo, J. O., & Sampoorna, M. 2014a, in: K. N. Nagendra, J.
O. Stenflo Z. Q. Qu & M. Sampoorna (eds.), Solar Polarization 7, ASP Conf. Series 489 (San Francisco: ASP), p. 213
Smitha, H. N., Nagendra, K. N., Stenflo, J. O., Bianda, M., & Ramelli, R. 2014b, ApJ 794, 30 Smitha, H. N., Sampoorna, M., Nagendra, K. N., & Stenflo, J. O. 2011, ApJ 733, 4
Stenflo, J. O. 2015, A&A 573, A74 Uitenbroek, H. 2001, ApJ 557, 389