Advance Access publication 4 October 2012
Cluster randomized clinical trials in orthodontics:
design, analysis and reporting issues
Nikolaos Pandis*
,**, Tanya Walsh***, Argy Polychronopoulou**** and
Theodore Eliades*****
*Private Practice, Corfu, Greece, **Department of Orthodontics and Dentofacial Orthopedics, Dental School/Medical Faculty, University of Bern, Switzerland, ***School of Dentistry, University of Manchester, UK,****Department of Community and Preventive Dentistry, School of Dentistry, University of Athens, Greece, and ***** Department of Orthodontics and Paediatric Dentistry Center of Dental Medicine, University of Zurich, Switzerland
Correspondence to: Nikolaos Pandis, 29 p. Zafiropoulou St., Corfu 49100, Greece. E-mail: [email protected]
SUMMARY Cluster randomized trials (CRTs) use as the unit of randomization clusters, which are usually defined as a collection of individuals sharing some common characteristics. Common examples of clus-ters include entire dental practices, hospitals, schools, school classes, villages, and towns. Additionally, several measurements (repeated measurements) taken on the same individual at different time points are also considered to be clusters. In dentistry, CRTs are applicable as patients may be treated as clusters con-taining several individual teeth. CRTs require certain methodological procedures during sample calcula-tion, randomizacalcula-tion, data analysis, and reporting, which are often ignored in dental research publications. In general, due to similarity of the observations within clusters, each individual within a cluster provides less information compared with an individual in a non-clustered trial. Therefore, clustered designs require larger sample sizes compared with non-clustered randomized designs, and special statistical analyses that account for the fact that observations within clusters are correlated. It is the purpose of this article to highlight with relevant examples the important methodological characteristics of cluster randomized designs as they may be applied in orthodontics and to explain the problems that may arise if clustered observations are erroneously treated and analysed as independent (non-clustered).
Introduction
Clinical trials in dentistry aim to prospectively evaluate which treatment modalities are most beneficial to patients. Some common research scenarios are the survival of various types of implants (Telleman et al., 2011), the effectiveness of differ-ent intervdiffer-entions for guided tissue regeneration for periodon-tal infra-bony defects (Needleman et al., 2006), effectiveness of fluoride mouthrinses (Ganss et al., 2010) and interventions that compare risk of failure for different etching methods used in orthodontic bonding (Pandis et al., 2006). Depending on the unit of randomization, clinical trials can be described as individually or cluster randomized trials (CRTs). Clinical tri-als where groups of individutri-als or clusters are randomized to receive the same treatment are known as CRTs. Clusters may be aggregates of individuals such as schools or communities, or even multiple measurements on the same person.
There are a number of reasons why a cluster randomized design would be preferred to an individually randomized design:
1. Trial management: From a design perspective, it may be logistically preferable to randomize to clusters consist-ing of a few, several or many persons who share some common characteristics (Altman and Bland, 1997; Wang and Bakhai, 2006; Hayes and Moulton, 2009a). In a trial
evaluating the effectiveness of supervised tooth brushing at daycare, it would be logistically difficult and resource intensive to administer both intervention to children on an individual basis within each centre.
2. Reduce bias: In certain situations, the internal validity of a trial is optimized when treatments are randomly allo-cated to clusters rather than to individuals. In a trial eval-uating the anti-caries effectiveness of a toothpaste, all children within a family (the cluster) may be randomized to receive either toothpaste A or toothpaste B. It would be possible to randomize individually in this instance, but compliance is likely to be better when all members of the family receive the same intervention rather than inter-ventions that differ within a family. Similarly, the poten-tial for contamination can be reduced. In the context of a CRT, contamination is the potential biasing of results when participants in the various arms of a trial come into contact, leading to an exchange of information between participants and possible dilution (underestimation) of the effect of the active intervention if participants in the control group benefit from the active treatment (Puffer
et al., 2003). Interventions evaluating oral hygiene meth-ods have been delivered in a clustered design in a simi-lar manner to other educational interventions (Lawrence
3. Clinical trials where multiple outcome data are recorded for each participant may be considered as clustered. Such scenarios are common in dentistry where the individual patient is the cluster, contributing a number of observations, such as multiple measurements on the same patient or multiple teeth on which the treatment is applied. For example, in the assessment of the effective-ness of two different antibiotic regimens A or B in chil-dren with one or more abscessed teeth, the child (cluster) is randomized to receive either antibiotic A or B, gen-erating multiple observations (abscessed teeth) for the outcome within the same patient.
4. A patient’s mouth, jaw, quadrant, or repeated measure-ments on the same patient can be considered as a cluster because they include a collection of related observa-tions (individual teeth or a series of measurements). Furthermore, in certain occasions, especially in ortho-dontics, matching may be utilized as it is often feasible for different quadrants (clusters) within the same patients to receive the interventions under investigation (split mouth design). In this situation, the quadrant is the clus-ter, which contains several tooth units. The matching has the benefit of decreasing the required sample size com-pared with a CRT in which each patient receives only one intervention on all of his teeth. The smaller sample size requirement in the matched design stems from the decreased variance, which results from patients acting as their own controls (Hayes and Moulton, 2009b,c). However, matching requires availability of similar units within patients who will receive the different interven-tions, something that is usually difficult in some fields of dentistry (Lesaffre et al., 2009).
Clustered trials require specific design, analysis, and reporting in order for the methods to be credible and the results valid (Kerry and Bland, 1998a, 1998b, 1998c;
Campbell et al., 2004). The value of an observation
within a cluster will be more similar to the value of an observation in the same cluster than a different cluster. It is this absence of independence among observations in the same cluster or the within-cluster correlation, which creates methodological challenges. As observa-tions within clusters are more similar, each observation within a cluster provides less information compared with an observation in a non-clustered trial. Therefore, CRTs require larger sample sizes compared with indi-vidual randomized trials, and statistical analyses that account for the fact that observations within clusters are more similar (Campbell and Grimshaw, 1998; Kerry and Bland, 1998c; Hayes and Bennett, 1999; Donner and Klar, 2000; Hayes and Moulton, 2009d). Applying meth-ods for individually randomized trials to CRTs is inap-propriate and can lead to incorrect inferences (Campbell and Grimshaw, 1998; Murray et al., 2004; Varnell et al., 2004; Hayes and Moulton, 2009e).
The purpose of this educational article is to explain the areas that need special attention when designing clustered trials in orthodontics and to illustrate the problems that may arise if clustered observations are erroneously treated and analysed as independent. This topic will be approached with the use of two relevant examples.
Example #1: Orthodontic bracket failure after bonding with conventional phosphoric acid etching versus self-etching primer in adolescent patients over the course of orthodontic therapy adapted from
Pandis et al., 2006
In this clinical study, the authors compared the risk of failure of brackets bonded with a self-etching adhesive and conventional phosphoric acid in patients followed for 12 months of active treatment. This study included multi-ple observations per patient, and in this design, there are clearly clustering effects, which were not accounted for during the analysis. We will use this study as a starting point and utilize simulated data in order to show the effect on the results of treating the collected data as independ-ent (incorrect approach) or as clustered data (the correct approach).
Sample size calculations
Sample size calculations for individual randomized trials are appropriately adjusted to account for clustering (Kerry and Bland, 1998c; Hayes and Bennett, 1999; Eldridge
et al., 2006). The degree of variability between clusters can be given by one of two measures, the coefficient of variation (k) or the intracluster correlation coefficient (expressed as ICC or rho or ρ). In the context of CRTs, both the coefficient of variation and the ICC are ways of measuring the same thing, i.e. the degree of clustering in the data.
• Coefficient of variation (k): This is the ratio of the data’s standard deviation to the mean (or the proportion or the rate) of the cluster level outcomes. As the value of the standard deviation can be greater than the mean, values of k can exceed 1.
• ICC: This is a measure of the within-cluster correlation and is defined as the proportion of the total variation (between and within clusters), which can be attributed to the variation between clusters. The value of the ICC can range from −1 to +1, though values in the 0 to +1 range are usually observed. An ICC of 0 indicates that there is no within-cluster similarity in measurements, i.e. that the observations within a cluster can be considered to be independent; an ICC of 1 indicates perfect correla-tion. Even small ICC values are important. In CRTs, an increase in the sample size is required in order to com-pensate for loss of information (loss of precision/power) due to the correlated nature of the data. The required
sample size must be increased by a factor related to the degree of correlation or similarity of the outcome within clusters (Kerry and Bland, 1998c; Killip et al., 2004;
Eldridge et al., 2006).
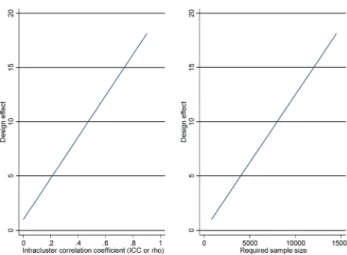
The ICC can be used in the calculation of the design effect to determine the effect of clustering on the sample size of a trial. This is the factor by which the sample size of a trial without clustering effects must be increased in order to give equivalent power for a cluster randomized design.
D = 1 + (m‒1)ρ.
Formula 1. Design effect (Hayes and Bennett,
1999) as a function of cluster size and ICC, where m = number of units per cluster and ρ = ICC. For example, number of m teeth contributed by each patient (cluster)
The larger the ICC (with m being the same), the larger the design effect and the required sample size for the CRT compared with the individually randomized trial with simi-lar power (Figure 1).
In the example trial evaluating the proportion of fail-ures for the two etching methods, if we erroneously ignore clustering of teeth within a patient and consider bond failures within patients as independent events, 800 teeth (40 patients) would have almost 80% power to detect a 5% difference in the proportion of failures (5% failure acid etching, 10% failures self-etching). If we take into account the clustering of on average 20 teeth within each patient and randomize patients to either acid etching or self-etching, assuming an ICC of 0.01, the design effect is
D = 1 + (m ‒ 1)ρ = 1 + (20 ‒ 1) * .01 = 1.19.
Increasing the original sample size by the design effect results in a sample size of 952 teeth, approximately 50 patients, assuming that all patients/clusters contribute 20 teeth. This is almost a 20% increase in the number of patients in order to maintain the same level of significance and power. The ICC value of 0.01 is merely used for illus-trative purposes and to indicate that even small clustering effects are sufficient to have an important impact on the size of the trial. Figure 1 shows the dramatic effect of the ICC on the design effect and consequently the required sample size. Unfortunately, ICC is rarely reported in the literature and especially in dental literature. A recent study in orthodontics indicated that clustering effects are con-sidered in the analysis in only a quarter of the studies, which have clustering due to their designs (Koletsi et al.,
2012). If clustering is not identified as a problem in ortho-dontics, then suboptimal reporting of ICC values is to be expected.
Randomization
The number of clusters available for randomization may be extensive or small. Where the number of clusters avail-able for study is limited, methods such as restricted rand-omization, matching, and stratification may be employed in order to achieve balance in baseline characteristics between treatment arms and adjusted analyses can address unavoid-able imbalances of baseline characteristics (Campbell and Grimshaw, 1998). In CRTs in orthodontics, matching can be easily and successfully achieved when all interventions (per jaw or quadrant) are applied within each patient, result-ing in more precise estimates and greater study power. In our working example, cluster randomizing to acid etching or self-etching can be applied in three ways:
• Randomize patients to one etching method, conventional etching or self-etching. Each patient (cluster) contrib-utes outcomes from 20 teeth (observations). Each patient receives one intervention.
• Randomize conventional etching to one jaw and self-etching to the other jaw. Each jaw (cluster) contrib-utes outcomes for 10 teeth (observations). Each patient receives both interventions with the benefit of decreased variability achieved through matching. Etching method is randomly not systematically allocated to the maxilla or mandible.
• Randomize each one of the four quadrants (clusters), each contributing five teeth (observations). The advan-tages of matching, as stated above, are evident because both interventions are delivered for each patient. Allocation of etching method is randomly allocated to quadrants.
In our example, patients are randomized to receive one etching method either conventional or self-etching.
Figure 1 The effect of the intracluster correlation coefficient (ICC or rho) on the design effect and consequently on the required sample size. The sample size shows number of teeth and the assumption was that each patient contributed 20 teeth.
Analysis
CRTs can be analysed at the cluster level, taking the cluster as the unit of analysis, or at the unit level accounting for clustering, where analysis is carried out on the observations within a cluster. Analysis at a cluster level is based on the calculation of a summary value per cluster followed by sim-ple statistical tests to compare the effect estimate between treatment arms (Hayes and Moulton, 2009a). For variable cluster size, a weighted average for proportions or odds, when binary outcomes are utilized, and weighted t-test are
available. As the analysis is based on cluster summaries, there is some loss of information; analysis at the unit (tooth) level where the clustered nature of the data is taken into account is generally preferred, providing the number of clusters is reasonable (more than 15–20 per arm).
Analyses using the unit (in our example the unit is the tooth) are most commonly undertaken using regression models that adjust for clustering such as robust standard errors, generalized estimating equations (GEE), and ran-dom effects (Mollison, 2000). In these approaches, analy-sis is carried out at the unit level (tooth level) taking into account to a lesser or greater degree the clustering present in the data.
Analysis of the etching method data (simulated data) was undertaken using a variety of different methods, to illustrate the similarities and differences in results, and how inferences made from the analyses can differ. To recap, 50 patients (clusters) were randomly allocated to receive bonding with either conventional etching or self-etching on 20 units-teeth. The outcome of interest was the proportion of failures with each of the etching methods, and it was measured at tooth level. A null hypothesis of no difference in the proportions or odds of bracket failure between etching methods was specified.
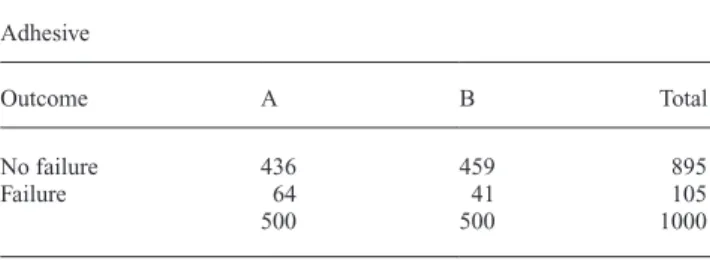
The number of bond failures by etching method at the tooth level is presented in Table 1; however, this does not indicate the number of failures per cluster. The simulated data set included failures that were highly clustered in 21 out of 50 patients (Figure 2). All failures were concentrated on 11 patients for conventional etching and 10 for self-etch-ing, with the other 29 patients having no failures at all.
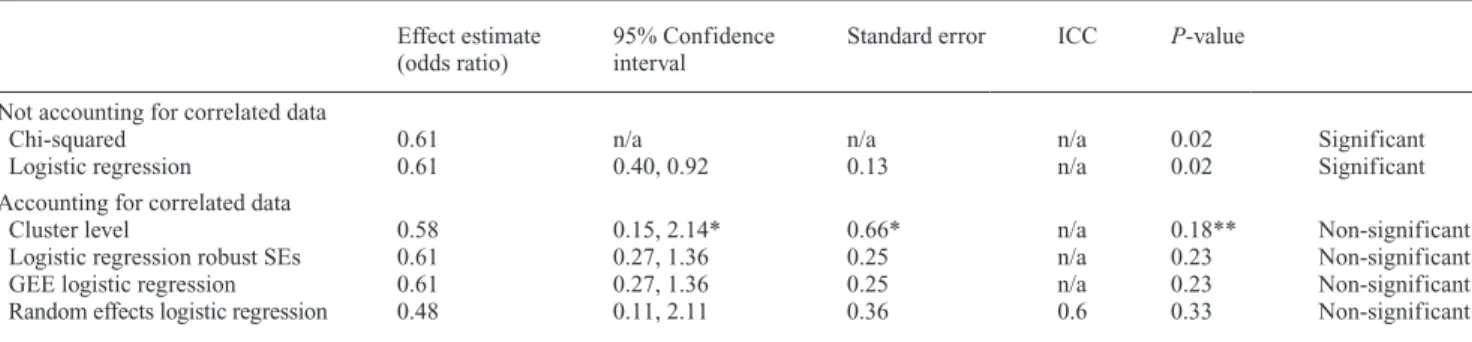
The results of the various analytical approaches are given in Table 2. The result of treating the teeth as independent observations with a sample size of 500 teeth per adhesive group generates small standard errors and consequently small P-values and statistically significant results [odds
ratio (OR) = 0.61, Chi-squared = 5.68, df = 1, P = 0.02;
unconditional logistic regression OR = 0.61, 95% confi-dence interval (CI): 0.40, 0.92, P = 0.02]. Failing to take
into account the clustering inherent in the data, treating the teeth as independent observations and carrying out an anal-ysis treating bond failures within patients as independent, has resulted in a standard error smaller than it should be, leading to an increased value of the test statistic and CIs that
are too narrow, with a real possibility of incorrect inferences being made. The fact that failures are concentrated to only a portion of patients is masked and disregarded because all observations (one per tooth) are treated as independent.
Analyses taking into account the clustering of teeth within a patient give different results. As the contribution of each individual observation has decreased relative to inde-pendent observations, so has the effective sample size. The standard errors are now greater and consequently a smaller test statistic and larger P-values. This phenomenon explains
the fact that when the correlated data were analysed as if it were uncorrelated (no clustering present in the data), the results were significant, and when correctly treated as cor-related (accounting for teeth belonging to the same patient) are no longer statistically significant (Hayes and Moulton, 2009d). Cluster level analysis gives non-significant results (OR = 0.58, 95% CI: 0.15, 2.14, P = 0.18). Logistic
regres-sion with robust standard errors ignores clustering when generating the effect estimates but not when estimating standard errors, and so produces the same effect estimate as unconditional logistic regression, but a larger standard error and statistically non-significant results (OR = 0.61, 95% Table 1 Example #1: Frequency of bond failure per etching method at tooth level.
Adhesive
Outcome A B Total
No failure 436 459 895
Failure 64 41 105
500 500 1000
Figure 2 Scatterplot showing clustering of failures within a few patients. The x-axis shows the patient id and the y-axis indicates the number of bond failures per patient.
CI: 0.27,1.36, P = 0.23). Unlike the previous approaches,
GEE logistic regression, with exchangeable correlation matrix, with robust standard errors takes account of cluster-ing in generatcluster-ing both the estimates and the standard errors (OR = 0.61, 95% CI: 0.27, 1.36, P = 0.23). In this particular
example, the results using logistic regression with robust standard errors gives the same results with GEE logistic regression; however, this is not always the case and it also depends on the chosen correlation matrix. The random effects logistic regression model incorporates the variation between clusters in the likelihood. Clustering is accounted for in the effect estimates and standard errors (OR = 0.48, 95% CI: 0.11, 2.11, P = 0.33). From all the analyses
accounting for clustering, it is inferred that there is insuffi-cient evidence to reject the null hypothesis of no difference in proportion of failures according to etching method.
The above problem, where different analyses produce different results in terms of significance, is exacerbated when interpretation is based solely on P-values, and
con-clusions are reduced to significant or non-significant dis-regarding the clinical relevance of the treatment effects (Savitz,1993; Chia, 1997; Rothman et al., 2008). A study published by Petracci et al. on assessing bond failures
using survival methods for clustered observations is a good example of how this type of data can be analysed. (Petracci
et al., 2009).
Example 2. Is there evidence of an effect of extraction of primary maxillary canines versus non-extraction on permanent maxillary canine impaction resolution?
The null hypothesis is that there is no difference on the resolution of canine impaction between extraction and non-extraction of primary canines. The number of primary impacted canines in each treatment group along with the success/failure for permanent canine resolution is shown in Table 3. There were 23 successful impaction resolutions (77%) in the extraction group compared with 15 successful
impaction resolutions (50%) in the non-extraction group. In the patients with two impacted canines, clustering effects are expected. This is a simulated data set consisting of 46 patients with 60 impacted canines and with a higher prevalence of successful outcomes among the patients with two impacted canines. Figure 3 shows the number of impacted canines per patient.
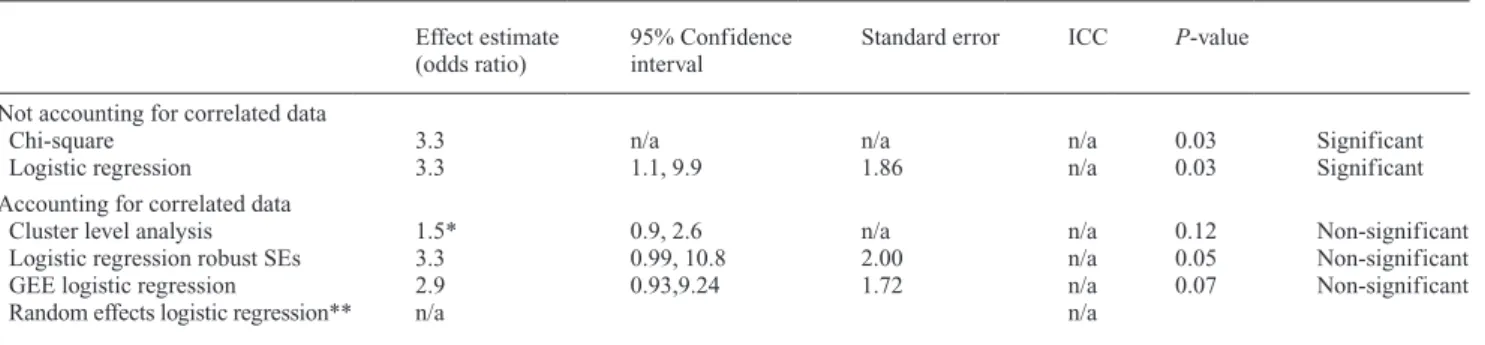
The results of the various analytical approaches are given in Table 4. Results of after using chi-square testing and unconditional logistic regression assuming independ-ent observations give statistically significant results. As it was pointed out in this simulated data set, several patients have two impacted canines, and that most patients with two impacted canines have a successful or unsuccessful out-come for both. In other words, success or failure is clus-tered on patients with two canines. If we analyse the data using methods that account for clustering, our inferences are likely to be different compared with analyses that do not account for clustering. Failing to account for the clus-tering in the data leads us to the conclusion that there is evi-dence of beneficial effect of the intervention (OR = 3.29, chi-squared = 4.52, df = 1, P = 0.03; unconditional
logis-tic regression OR = 3.29, 95% CI: 1.08, 9.95, P = 0.03);
analyzing the data appropriately leads us to the opposite conclusion (cluster level analysis RR = 1.50, 95% CI: 0.99, 2.6, P = 0.12, robust standard errors logistic regression:
OR = 3.29, 95% CI: 0.99, 10.83, P = 0.05, GEE logistic Table 2 Example #1: Analyses for bond failure by etching method.
Effect estimate
(odds ratio) 95% Confidence interval Standard error ICC P-value Not accounting for correlated data
Chi-squared 0.61 n/a n/a n/a 0.02 Significant
Logistic regression 0.61 0.40, 0.92 0.13 n/a 0.02 Significant
Accounting for correlated data
Cluster level 0.58 0.15, 2.14* 0.66* n/a 0.18** Non-significant
Logistic regression robust SEs 0.61 0.27, 1.36 0.25 n/a 0.23 Non-significant
GEE logistic regression 0.61 0.27, 1.36 0.25 n/a 0.23 Non-significant
Random effects logistic regression 0.48 0.11, 2.11 0.36 0.6 0.33 Non-significant
GEE, generalized estimating equation; ICC, intracluster correlation coefficient; SE, standard error.
*Assuming ICC = 0.6 calculated from random effects logistic regression and using formula described by Donner and Klar (Donner and Klar, 2000). **From two-sided t-test.
Table 3 Example 2: Frequency of successful/unsuccessful resolution of canine impaction among treatment and control groups.
Intervention
Outcome Control Extraction Total
No resolution of impaction 15 7 22
Resolution of impaction 15 23 38
regression OR = 2.93, 95% CI: 0.93, 9.24, P = 0.05). On
the basis of the analyses accounting for clustering, there is insufficient evidence to reject the null hypothesis of no difference in the resolution of canine impaction between the extraction and non-extraction groups. In reality, a 27% difference between treatment groups is large and clinically important, and it is likely that a larger sample size might have given statistically significant also for the analyses that account for clustering effects. However, the point for this example is to show how application of incorrect methods when analyzing clustered data may lead to incorrect inferences and associations that are not genuine.
The examples above used binary outcome; however, appropriate statistical methods that account for clustering are available for continuous outcomes and for rates (Hayes and Moulton, 2009b). It is worth noting that a sensitivity analysis study comparing analytical methods in CRTs that consider the clustering effect has found lower sensitivity
when the assessed outcomes are continuous compared with binary (Donner, 1982).
Reporting of CRTs
Reporting of study design and results of randomized con-trolled trials has been explicitly described in the CONSORT (CONsolidated Standards Of Reporting Trials) guide-lines (Moher et al., 2010). The CONSORT group has also published an extension to the CONSORT guidelines spe-cifically for CRTs (Campbell et al., 2004) in which key rec-ommendations are to report:
• rationale for choosing a cluster randomized clinical trial • how clustering was incorporated into design and sample
size calculations
• method of randomizing the assignment such as blocking, stratification, and matching
• flow of clusters from randomization to analysis
• how the effects of clustering were incorporated into the analysis
• reporting of the ICC and the coefficient of variation
Summary
• The usual assumptions of independence of the observa-tions are often violated in orthodontic and dental research, due to the use of clustered data such as multiple observa-tions within patients.
• In the presence of correlated (non-independent) data, appropriate methods for randomization, sample size cal-culation, statistical analysis, and reporting should be followed.
• CRTs require larger sample sizes than individually rand-omized trials.
• Not accounting for clustering and analyzing clustered data using methods for individually randomized trials may result in incorrect inferences.
• Transparent reporting of CRTs is required. Figure 3 Scatterplot showing the patients with one or two impacted
canines. Clustering effects in the presence of two impacted canines in a patient.
Table 4 Example 2: Analyses of canine impaction by treatment. Effect estimate
(odds ratio) 95% Confidence interval Standard error ICC P-value Not accounting for correlated data
Chi-square 3.3 n/a n/a n/a 0.03 Significant
Logistic regression 3.3 1.1, 9.9 1.86 n/a 0.03 Significant
Accounting for correlated data
Cluster level analysis 1.5* 0.9, 2.6 n/a n/a 0.12 Non-significant
Logistic regression robust SEs 3.3 0.99, 10.8 2.00 n/a 0.05 Non-significant
GEE logistic regression 2.9 0.93,9.24 1.72 n/a 0.07 Non-significant
Random effects logistic regression** n/a n/a
GEE, generalized estimating equation; ICC, intracluster correlation coefficient; SE, standard error. *Risk ratio.
References
Altman D G, Bland J M 1997 Statistics notes. Units of analysis. British Medical Journal 314: 1874
Blinkhorn A 2010 Influencing patients’ oral hygiene behaviour. Evidence-Based Dentistry 11: 41
Campbell M K, Elbourne D R, Altman D G; CONSORT group 2004 CONSORT statement: extension to cluster randomised trials. British Medical Journal 328: 702–708
Campbell M K, Grimshaw J M 1998 Cluster randomised trials: time for improvement. The implications of adopting a cluster design are still largely being ignored. British Medical Journal 317: 1171–1172 Chia K S 1997 “Significant-itis”–an obsession with the P-value.
Scandinavian Journal of Work, Environment & Health 23: 152–154 Donner A 1982 An empirical study of cluster randomization. International
Journal of Epidemiology 11: 283–286
Donner A, Klar N 2000 Design and analysis of cluster randomization trials in health research. Arnold, London
Eldridge S M, Ashby D, Kerry S 2006 Sample size for cluster ran-domized trials: effect of coefficient of variation of cluster size and analysis method. International Journal of Epidemiology 35: 1292–1300
Ganss C, Neutard L, von Hinckeldey J, Klimek J, Schlueter N 2010 Efficacy of a tin/fluoride rinse: a randomized in situ trial on erosion. Journal of Dental Research 89: 1214–1218
Harrison R, Veronneau J, Leroux B 2010 Design and implementation of a dental caries prevention trial in remote Canadian Aboriginal communi-ties. Trials 11: 54
Hayes R J, Moulton L H 2009a Cluster randomized trials. Interdisciplinary Statistic Series. Chapman & Hall/CRC, Florida, pp.15–23
Hayes R J, Moulton L H 2009b Cluster randomized trials. Interdisciplinary Statistic Series. Chapman & Hall/CRC, Florida, Chapter 5
Hayes R J, Moulton L H 2009c Cluster randomized trials. Interdisciplinary Statistic Series. Chapman & Hall/CRC, Florida, Chapter 2
Hayes R J, Moulton L H 2009d Cluster randomized trials. Interdisciplinary Statistic Series. Chapman & Hall/CRC, Florida, Chapter 7
Hayes R J, Moulton L H 2009e Cluster randomized trials. Interdisciplinary Statistic Series. Chapman & Hall/CRC, Florida, Chapter 9–11 Hayes R J, Bennett S 1999 Simple sample size calculation for cluster-
randomized trials. International Journal of Epidemiology 28: 319–326
Kerry S M, Bland J M 1998a Analysis of a trial randomised in clusters. British Medical Journal 316: 54
Kerry S M, Bland J M 1998b Analysis of a trial randomised in clusters. British Medical Journal 316: 54
Kerry S M, Bland J M 1998c Sample size in cluster randomisation. British Medical Journal 316: 549
Killip S, Mahfoud Z, Pearce K 2004 What is an intracluster correlation coefficient? Crucial concepts for primary care researchers. Annals of Family Medicine 2: 204–208
Koletsi D, Pandis N, Polychronopoulou A, Eliades T 2012 Does published orthodontic research account for clustering effects during statistical data analysis? European Journal of Orthodontics 34: 287–292
Lesaffre E, Philstrom B, Needleman I, Worthington H 2009 The design and analysis of split-mouth studies: what statisticians and clinicians should know. Statistics in Medicine 28: 3470–3482
Lawrence H P et al. 2008 A 2-year community-randomized controlled trial
of fluoride varnish to prevent early childhood caries in Aboriginal chil-dren. Community Dentistry and Oral Epidemiology 36: 503–516 Moher D et al. 2010 CONSORT 2010 explanation and elaboration:
updated guidelines for reporting parallel group randomised trials. British Medical Journal 340: c869
Mollison J, Simpson J A, Campbell M K, Grimshaw J M 2000 Comparison of analytical methods for cluster randomised trials: an example from a primary care setting. Journal of Epidemiology and Biostatistics 5: 339–348
Murray D M, Varnell S P, Blitstein J L 2004 Design and analysis of group-randomized trials: a review of recent methodological developments. American Journal of Public Health 94: 423–432
Needleman I G E et al. 2006 Guided tissue regeneration for
periodon-tal infra-bony defects. Cochrane Database Systematic Reviews 19: CD001724
Pandis N, Polychronopoulou A, Eliades T 2006 Failure rate of self-ligating and edgewise brackets bonded with conventional acid etching and a self-etching primer: a prospective in vivo study. The Angle Orthodontist 76: 119–122
Petracci E, Farella M, Galeone C, Albano A, Ferraroni M, Decarli A 2009 Survival analysis with clustered observations of orthodontic brackets. Statistics in Medicine 28: 3483–3491
Puffer S, Torgerson D, Watson J 2003 Evidence for risk of bias in clus-ter randomised trials: review of recent trials published in three general medical journals. British Medical Journal 327: 785–789
Rothman K J, Greenland S, Lash T L 2008 Modern epidemiology. Lippincot Williams and Wilkins, Philadelphia, pp. 156–162
Savitz D A 1993 Is statistical significance testing useful in interpreting data? Reproductive Toxicology (Elmsford, N.Y.) 7: 95–100
Telleman G, Raghoebar G M, Vissink A, den Hartog L, Huddleston Slater J J, Meijer H J 2011 A systematic review of the prognosis of short (<10 mm) dental implants placed in the partially edentulous patient. Journal of Clinical Periodontology 38: 667–676
Varnell S P, Murray D M, Janega J B, Blitstein J L 2004 Design and analy-sis of group-randomized trials: a review of recent practices. American Journal of Public Health 94: 393–399
Wang D, Bakhai A 2006 Clinical trials: a practical guide to design, analy-sis, and reporting. Remedica, London, Chapter 15