http://dx.doi.org/10.1351/PAC-CON-12-04-02
© 2012 IUPAC, Publication date (Web): 31 August 2012
Hydrophobicity with atomic resolution:
Steady-state and ultrafast X-ray ab sorption and
molecular dynamics studies*
Thomas J. Penfold
1,2,3, Christopher J. Milne
1, Ivano Tavernelli
2, and
Majed Chergui
1,‡1Ecole Polytechnique Fédérale de Lausanne, Laboratoire de Spectroscopie
Ultrarapide, ISIC, FSB-BSP, CH-1015 Lausanne, Switzerland;
2Ecole Polytechnique Fédérale de Lausanne, Laboratoire de Chimie et Biochimie
Computationnelles, ISIC, FSB-BSP, CH-1015 Lausanne, Switzerland;
3Paul-Scherrer-Institut, CH-5232 Villigen, Switzerland
Abstract: Static and time-resolved X-ray absorption spectroscopy (XAS) is used to probe the solvent shell structure around iodide and iodine. In particular, we characterize the changes ob served upon electron abstraction of aqueous iodide, which reflects the transition from hydrophilic to hydrophobic solvation after impulsive electron abstraction from iodide. The static spectrum of aqueous iodide, which is analyzed using quantum mechani cal/molecular mechanics (QM/MM) molecular dynamics (MD) simulations, indicates that the hydrogens of the closest water molecules point toward the iodide, as expected for hydrophilic solvation. In addition, these simulations demonstrate a small anisotropy in the solvent shell. Following electron abstraction, most of the water molecules move away from iodine, while one comes closer to form a complex with it that survives 3–4 ps. This lifetime is governed by the reorganization of the main solvation shell, basically the time it takes for the water molecules to reform a hydrogen bond network in the hydrophobic solvation shell.
Keywords: halides; hydrophobicity; ultrafast spectroscopy; X-ray absorption spectroscopy; X-ray structure.
INTRODUCTION
The properties of solvated atomic species and the role of the surrounding water molecules are impor-tant in a large variety of chemical reactions and biochemical processes [1,2]. They are also key for the transport of solutes in water [3], which plays a central role in several physiological processes such as ion transport through membranes, where the hydration shell reorganizes in the initial and final stages of the membrane-crossing mechanism [4]. Of par ticular importance to these processes is the nature of hydrophobic and hydrophilic solvation.
The solvation of halides, namely, iodide which is of interest here, represents the simplest system to characterize these interactions. Theoretical simulations [5–8] have demon strated that there are sig-nificant differences between the solvation environments of anionic, neutral, and cationic halides, which can be traced to the different orientation of water in the primary solvation shell of the ions (H atoms
*Pure Appl. Chem. 85, 1–305 (2013). A collection of invited papers based on presentations at the 32ndInternational Conference on Solution Chemistry (ICSC-32), La Grande Motte, France, 28 August–2 September 2011.
pointing toward anions and O atoms toward cations). Lynden-Bell, Rasaiah, and co-workers [5,6] showed that the behavior of solvated halogen atoms could be characterized as a function of charge with the entropy of solvation of the solute being smallest near zero-charge, because the water molecules are able to form a H-bonded cavity around the halide (hydrophobic hydration). The solvation entropy increases gradually as a function of the solute charge (positive or negative), reflect ing break-up of the cavity, as the solvent molecules preferentially interact with the solute species rather than between them-selves.
So far, the microscopic understanding of hydrophobic hydration has relied almost solely on the-ory [5,6] and simulations [4,7,8]. This is due to the fact that, experimentally, probing hydrophobicity on the atomic scale is difficult. Here we review our recent work on the solvation of aqueous iodide and iodine using X-ray absorption spectroscopy (XAS) and molecular dynamics (MD) simulations. Static and time-resolved XAS is ideal for the study of solvation dynamics, as it offers a direct and element-specific insight into the local geometric and electronic structure around the X-ray absorbing atom [9–11]. In particular, the L1-edge, consisting of transitions from the 2s core-orbital offers, through dipole-allowed transitions, insight into the electronic structure of the 5p valence orbitals. In contrast, the L3-edge, consisting of transitions from the 2p3/2core-orbital, gives information about the structure of the solvent, through above ionization multiple scattering (MS) resonances.
The experimental procedure for the static, pico-, and femtosecond XAS experiments has already been described in refs. [9–13], and for the present experiment more details are given in refs. [14,15]. Briefly, the sample consists of a flowing liquid jet of aqueous iodide which, for the time-resolved meas-urements is excited at a repetition rate of 1 kHz by 400-nm femtosecond laser pulses. The sample is probed in absorption by ~60 ps hard X-ray pulses from the synchrotron. For the sub-picosecond exper-iments, femtosecond X-ray pulses are generated using the so-called slicing scheme [12,16]. In all cases, the X-ray absorption through the sample is recorded at 2 kHz. The use of 400-nm excitation, which is well below the charge-transfer-to-solvent (CTTS) states of iodide (<260 nm), implies a multi-photon excitation process for the electron abstraction, which is predominantly a three-photon absorption [15], ensuring that the iodide is directly excited well into the ionization continuum, and the electron is ejected far from the excited center. Details of the quantum mechanics/molecular mechanics (QM/MM) [17–20] and full QM MD simulations are presented in refs. [14,15,21].
RESULTS
The solvent structure around iodide
Figure 1a shows the static L3-edge spectrum of iodide (black line) for a sample of 100 mM iodide con-centration. It exhibits features, labeled A and B, which were shown to be MS X-ray absorption near-edge spectroscopy (XANES) features [22] and therefore, they bear information about the 3D structure of the solvent shell.
The local solvent shell structure around the iodide can be extracted from the X-ray absorption fine structure (EXAFS) spectrum. For this, we perform QM/MM MD simulations and represent the solvent structure as a radial distribution function (RDF). The RDF may then be used to calculate the EXAFS spectrum to compare to the experimental kχ(k) spectrum [14].
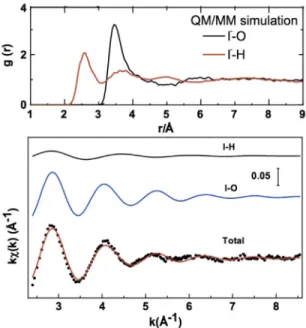
Figure 2 (upper panel) shows the RDF calculated from QM/MM MD simulations. It shows that for iodide the oxygens of the closest water molecules are at a distance ~3.5 Å, while the hydrogens are at ~2.75 Å, indicating as previously reported that the water molecules are oriented so that the hydro-gens point toward the iodide. The sum of these two con tributions (total) shows good agreement with the EXAFS experimental signal. In addition, these QM/MM MD simulations contain evidence (14) for the presence of a weak anisotropy in the first solvation shell, which arises from the polarization of iodide, as previously postulated by Wick et al. [23].
Fig. 1 Left: (a) Normalized static iodide L3-edge XAS (solid line) and reconstructed I0spectrum (dots) using the transient spectrum at 50 ps time delay (b) and the photolysis yield of 3 % (as determined in ref. [15]) for a 100-mM sample concentration; (b) normalized L3-edge transient spectrum at a time delay of 50 ps. Right: (i) Normalized static iodide XAS at the L1-edge (solid line) and reconstructed I0spectrum (dots) using the transient spectrum at a time delay of 50 ps (ii) and the photolysis yield of 4.8 % for a 50 mM sample concentration; (ii) normalized transient spectra at a time delay of 50 ps; (iii) same as panel (ii), but at a time delay of 2 ns. Figure reproduced from ref. [15].
Fig. 2 Upper panel: RDF around iodide of the O (black, right trace) and H (red, left trace) atoms of water molecules
from QM/MM MD simulations. Lower panel: The dots represent the experimental EXAFS spectrum at the L3-edge. The black (top) and blue (middle) curves are EXAFS signals associated with I-H and I-O scattering, respectively. The red (bottom) curve is the total EXAFS signal compared to the experimental signal (dots). Figure reproduced from ref. [14].
Transient X-ray absorption spectroscopy
The solvent structure around iodine
Figure 1b shows the transient L3-edge spectrum at a time delay of 50 ps after electron abstraction. This is used to reconstruct the excited state spectrum (Fig. 1a, circles), based on a photolysis yield of 3 % that was derived in ref. [15]. Clear photoinduced changes are seen both in the XANES and EXAFS region. In particular, the transient spectrum exhibits a first negative feature at 4560.8 eV, which is assigned to the oxidation (blue) shift of the edge arising from the loss of the electron. The positive peak of the transient (at 4564.3 eV) lies between the A and B MS features of the iodide spectrum and is there-fore related to the changes in the solvent cage compared to iodide. This is also the case for the changes observed at higher energies.
The right panels of Fig. 1 show the static and transient L1-edge spectra. In panel (i) full (black) trace represents the static iodide spectrum, and the transient XANES spectra for 50 ps and 2 ns time delays are shown in (ii) and (iii), respectively. Using the photolysis yield determined in ref. [15], the iodine spectrum is reconstructed (dots in Fig. 1i). The transients show positive and negative features near 5185 and 5192 eV, respectively. The positive peak is due to the bound–bound 2s → 5p transition, which appears because electron abstraction leaves a hole in the 5p orbital [24]. This feature is therefore a fingerprint of neutral iodine at early times. In Fig. 1iii, it shifts to higher energies and is broader on its high-energy side. This is due to formation of subsequent products, predominantly I2–. The time evo-lution of the positive signal was recorded up to several nanoseconds and reflects the kinetics of elec-tron-iodine recombination, and diiodide formation, as discussed in ref. [15]. The negative feature, as in the case of the L3-edge, is due to the blue shift of the absorption edge when the oxidation state of the solute changes from 1 to 0.
To interpret the changes measured at the L3-edge at 50 ps time delay, we simulate the RDFs of I0, within the framework of QM/MM MD, which we show in Fig. 3. These were used to generate the transient EXAFS spectra which reproduced the experimental data in a satisfactory way [15]. The RDFs show an increase of the I-O distances from iodide to iodine, but the most dramatic changes show up on the I-H RDF, where the first peak shifts on average by well over 1 Å from iodide to iodine. While for iodide the first peak of the I-H RDF lies at smaller distances than that of the I-O RDF, for iodine it is at almost the same distance as the first peak of the I-O RDF, but it is broader and has a long tail extend-ing to larger distances. Finally, the I-H RDF shows clear modulations in the case of iodide, but the sep-aration between solvent shells is less clear-cut in the iodine case. All this indicates that the majority of
Fig. 3 I-O and I-H RDFs of aqueous iodide and iodine from the QM/MM MD. The QM/MM MD simulations
represent an equilibration over 15 ps with a single I–/I0described at DFT level of theory. Figure reproduced from ref. [15].
the H atoms rotated to point away from the iodine atom, contrary to the iodide case. This indicates the formation of a hydrophobic cavity.
The transition from hydrophilic to hydrophobic
The sub-picosecond transient spectra at the L1-edge is shown in Fig. 4 for time delays of 300 and 850 fs. The 300 and 850 fs transients exhibit a weak broadening (typically <1 eV), with respect to the 50 ps transient, on the high-energy side of both their positive and negative features. The broadening of the positive 2s → 5p resonance feature shows similarity to the broadening seen in the transients at much later times (Fig. 1iii). Whereas in the latter this is clearly due to formation of diiodide species, which is diffusion-controlled, in the femtosecond data this is excluded. Contrary to the L1-edge, a broadening or shift was less clear at the L3-edge.
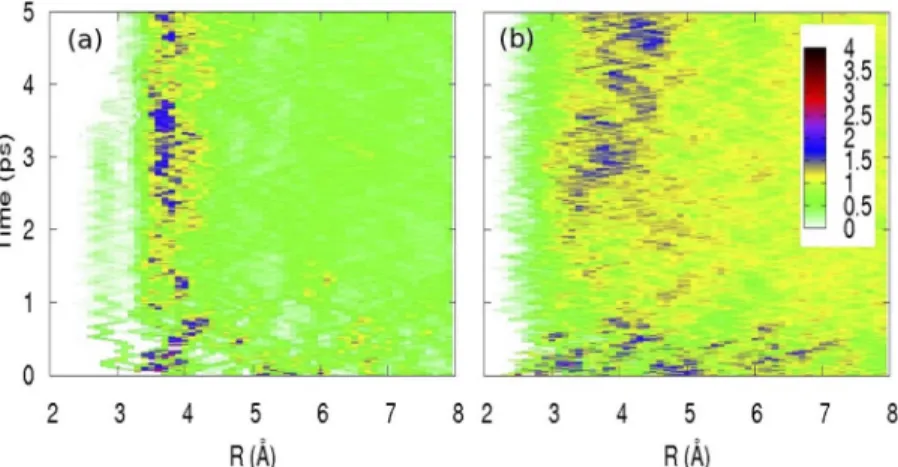
In order to understand the broadening of the 2s-5p resonance, we performed QM/MM MD sim-ulations with I0and 9 water molecules, described at density functional theory (DFT) level, within a bath of 1183 classical water molecules. Figure 5 shows the time evolution of the I-O (a) and I-H (b) RDFs over the first 5 ps after removal of the electron from iodide. These results are an average of 15 starting configurations for each time step. Within 200–300 fs, there is a break -up of the first shell with most mol-ecules moving away from the iodine while one moves closer (Fig. 5a), with an average probability of 0.4, and forms a complex with the iodine atom. The formation of this complex, which may be favored by the anisotropy of the solvent cage around the iodide [14,23], results in a blue shift of the valence orbitals of iodine according to the quantum chemistry calculations [15], which leads to the broadening on the blue side of the sub-ps transient spectra (Fig. 4). The binding energy of the complex is small (50 meV), and its formation is due to a three-electron bond between the I0and the H2O, as was already reported for Cl0[25] and Br0[26]. For the I-H RDF, there is a prompt expansion within about 200 fs. Up to ~2.0 ps, the solvation shell remains very diffuse and unstructured as can be seen on both the I-O and I-H RDFs. From about 2 ps onward, one observes that the first shell starts to form and to become gradually structured. This is visible both in the increase of the number of O atoms but also in that of H atoms that have on average their probability at larger distances than the O atoms; that is, they point toward the bulk rather than toward the solute. This process continues up to about 3.5 ps. At ~3.5 ps, the water molecule, which formed a complex with the iodine species, merges with the bulk of the solvent.
Fig. 4 Normalized transient L1-edge spectra of photoexcited aqueous iodide at 50 ps (open dots), 300 fs (crossed dots), and 850 fs (black dots) time delays after excitation. The sub-picosecond transients were multiplied by a fac-tor of 1.75 in order to match the value of the 50 ps transient at the maximum of the positive feature. Figure repro-duced from ref. [15].
This occurs as the new solvation shell is completing formation of a structured H bond network. This preference of the water molecules to interact with each other rather than with the solute is the hallmark of hydrophobicity. It also agrees with the prediction by Lynden-Bell and Rasaiah of hydrophobic hydra-tion around zero charge solutes [5,6], confirming that this process is entropy-driven.
Insight into the formation of the I0ⴢⴢⴢOH2complex can be obtained using ab initio MD simula-tions, for which both the iodine and all of the solvent molecules (64 in this case) are described at the DFT level [21]. In Fig. 6, we present an analysis of the electronic density associated to iodine in the first 75 fs following removal of the electron. Initially, at t = 0, the solvent configuration is still that of iodide and the number of valence electrons attributed to the iodine is 6.8, reflecting its 5s25p5 configu-ration, with a small amount of electron density transferred to the H atoms on the closest water
mole-Fig. 5 (a) Time evolution of the I0-O radial distribution for the first 5 ps following the removal of an electron from iodide. These distributions are obtained from an average over 15 starting configurations over the entire time range; (b) same for I0-H. Figure reproduced from ref. [15].
Fig. 6 Isosurfaces (isovalue = 0.025) of the electron density at 0 (a), 35 (b), and 70 fs (c) after abstraction of an
electron from aqueous iodide. Lower panel: number of valence electron attributed to iodine following a Voronoi analysis up to 75 fs after removal of the electron from iodide.
cules as is the case for iodide. However, within 75 fs we observe a transfer of density corresponding to almost one electron to the iodine. This derives from electron donation from the closest water molecule, and reflects the large electron affinity of iodine. In the upper panel of Fig. 6 we plot the density at 0, 35, and 70 fs after removal of the electron. The water molecule (indicated with a red arrow), which forms the complex, is just above and right of the iodine (green). Initially, there is no interaction, however, in the second frame one can observe a slight distortion of the density near the oxygen. After 70 fs there is a clear interaction with density being donated to the iodine from the water molecule. This interaction has been previously described as a three-electron bond [15], as predicted for Cl0and Br0[25,26]. Using a Mayer bond order analysis [27], we find that this initial complex has a bond order of 0.32, which is consistent with a three-electron bond [28]. Although the ab initio MD concerns only one trajectory, due to the computational expense, we believe that it is representative of what occurs in Fig. 5, in particular with respect to the complex formation.
SUMMARY
In summary, the picture that emerges from the above results is that, upon abstraction of the electron from iodide, there is a prompt expansion of the cage within 200–300 fs, but the development of hydrophobic solvation shell is a complex process that requires a time span of 3–4 ps. During this period, a weakly bonded transient I0ⴢⴢⴢ(OH2) complex is formed, which survives the time it takes to complete the formation of a new shell of water molecules around iodine. This new shell is characterized by an expansion of the I-O distances but more important, by a reorientation of most of the H atoms away from the solute and toward the bulk solvent, such as to allow them to build up a network of H-bonded water molecules. Once the H bonds have reached their steady-state regime, the lone water molecule is pulled toward the bulk of the solvent, probably because the interaction with the water molecules of the cavity overwhelms the weak I0ⴢⴢⴢ(OH2) interaction.
The present experimental results, consisting of picosecond and femtosecond X-ray ab sorption spectra, and of quantum chemical calculations and MD simulations, allow us to unravel the entire evo-lution of the system from the hydrophilic hydration in the case of iodide to the hydrophobic one in the case of iodine. With the advent of the free electron lasers, which provide very intense ultrashort pulses of X-ray, it is now possible to carry out detailed X-ray absorption studies of the present system with femtosecond resolu tion and a greatly improved signal-to-noise ratio, such that the details revealed by the MD simulations can fully be verified.
ACKNOWLEDGMENTS
This work was funded by the Swiss NSF through the NCCR MUST “Molecular ultrafast science and technology” and contracts 200021-107956, 200021-105239/1, and 200020-116533 and the COST D35.
REFERENCES
1. L. R. Pratt, A. Pohorille. Chem. Rev. 102, 2671 (2002).
2. K. A. Dill, T. M. Truskett, V. Vlachy, B. Hribar-Lee. Annu. Rev. Biophys. Biomol. Struct. 34, 173 (2005).
3. G. Galli. Proc. Natl. Acad. Sci. USA 104, 2557 (2007).
4. B. J. Berne, J. D. Weeks, R. Zhou. Annu. Rev. Phys. Chem. 60, 85 (2009).
5. S. Koneshan, J. C. Rasaiah, R. M. Lynden-Bell, S. H. Lee. J. Phys. Chem. B 102, 4193 (1998). 6. R. M. Lynden-Bell, W. A. Steele. J. Phys. Chem. 88, 6514 (1984).
7. S. L. Lee, J. C. Rashaiah. J. Chem. Phys. 101, 6964 (1994). 8. S. L. Lee, J. C. Rashaiah. J. Phys. Chem. 100, 1420 (1996). 9. C. Bressler, M. Chergui. Annu. Rev. Phys. Chem. 61, 263 (2010).
10. M. Chergui. Acta Crystallogr., Sect. A 66, 229 (2010).
11. C. Bressler, R. Abela, M. Chergui. Z. Kristallogr. 223, 308 (2008).
12. C. Bressler, C. Milne, V. T. Pham, A. El Nahhas, R. M. van der Veen, W. Gawelda, S. L. Johnson, P. Beaud, D. Grolimund, M. Kaiser, C. N. Borca, G. Ingold, R. Abela, M. Chergui. Science 323, 489 (2009).
13. M. Saes, F. van Mourik, W. Gawelda, M. Kaiser, M. Chergui, C. Bressler, D. Grolimund, R. Abela, T. E. Glover, P. Heimann, R. W. Schoenlein, S. L. Johnson, A. M. Lindenberg, R. W. Falcone. Rev. Sci. Instru m. 75, 24 (2004).
14. V. T. Pham, I. Tavernelli, C. J. Milne, R. M. van der Veen, P. D’Angelo, C. Bressler, M. Chergui. Chem. Phys. 371, 24 (2010).
15. V. T. Pham, T. J. Penfold, R. M. van der Veen, F. Lima, A. El Nahhas, S. L. Johnson, P. Beaud, R. Abela, C. Bressler, I. Tavernelli, C. J. Milne, M. Chergui. J. Am. Chem. Soc. 133, 12740 (2011).
16. P. Beaud, S. Johnson, A. Streun, R. Abela, D. Abramsohn, D. Grolimund, F. Krasniqi, T. Schmidt, V. Schlott, G. Ingold. Phys. Rev. Lett. 99, 174801 (2007).
17. A. Laio, J. VandeVondele, U. Rothlisberger. J. Phys. Chem. B 106, 7300 (2002). 18. A. Laio, J. VandeVondele, U. Rothlisberger. J. Chem. Phys. 116, 6941 (2002). 19. U. Rothlisberger, P. Carloni. Lect. Notes Phys. 704, 437 (2006).
20. E. Brunk, N. Ashari, P. Athri, P. Campomanes, B. F. E. Curchod, P. Diamantis, M. Doemer, J. Garrec, A. Laktionov, M. Micciarelli, M. Neri, G. Palermo, T. J. Penfold, S. Vanni, I. Tavernelli, U. Rothlisberger. Chimia 65, 667 (2011).
21. T. J. Penfold, I. Tavernelli, M. Doemer, U. Rothlisberger, M. Chergui. Chem. Phys. Submitted for publication.
22. H. Tanida, K. Kato, I. Watanabe. Bull. Chem. Soc. Jpn. 76, 1735 (2003). 23. C. J. Wick, S. S. Xantheas. J. Phys. Chem. B 113, 4141 (2009).
24. V. T. Pham, W. Gawelda, Y. Zaushitsyn, M. Kaiser, D. Grolimund, S. L. Johnson, R. Abela, C. Bressler, M. Chergui. J. Am. Chem. Soc. 129, 1530 (2007).
25. M. D. Sevilla, S. Summerfield, I. Eliezer, J. Rak, M. C. R. Symons. J. Phys. Chem. A 101, 2910 (1997).
26. C. G. Elles, I. A. Shkrob, R. A. Crowell, D. A. Arms, E. C. Landahl. J. Chem. Phys. 128, 061102 (2008).
27. I. Mayer. Int. J. Quantum Chem. 26, 151 (1984).
28. F. M. Bickelhaupt, A. Diefenbach, S. P. de Visser, L. J. de Koning, N. M. M. Nibber ing. J. Phys. Chem. A 102, 9549 (1998).