HAL Id: hal-00303891
https://hal.archives-ouvertes.fr/hal-00303891
Submitted on 4 Apr 2006HAL is a multi-disciplinary open access
archive for the deposit and dissemination of sci-entific research documents, whether they are pub-lished or not. The documents may come from teaching and research institutions in France or abroad, or from public or private research centers.
L’archive ouverte pluridisciplinaire HAL, est destinée au dépôt et à la diffusion de documents scientifiques de niveau recherche, publiés ou non, émanant des établissements d’enseignement et de recherche français ou étrangers, des laboratoires publics ou privés.
Technical note: Evaluation of standard ultraviolet
absorption ozone monitors in a polluted urban
environment
E. J. Dunlea, S. C. Herndon, D. D. Nelson, R. M. Volkamer, B. K. Lamb, E.
J. Allwine, M. Grutter, C. R. Ramos Villegas, C. Marquez, Stéphane Blanco,
et al.
To cite this version:
E. J. Dunlea, S. C. Herndon, D. D. Nelson, R. M. Volkamer, B. K. Lamb, et al.. Technical note: Evaluation of standard ultraviolet absorption ozone monitors in a polluted urban environment. At-mospheric Chemistry and Physics Discussions, European Geosciences Union, 2006, 6 (2), pp.2241-2279. �hal-00303891�
ACPD
6, 2241–2279, 2006 Evaluation of UV ozone monitors E. J. Dunlea et al. Title Page Abstract Introduction Conclusions References Tables Figures J I J I Back CloseFull Screen / Esc
Printer-friendly Version Interactive Discussion
EGU
Atmos. Chem. Phys. Discuss., 6, 2241–2279, 2006 www.atmos-chem-phys-discuss.net/6/2241/2006/ © Author(s) 2006. This work is licensed
under a Creative Commons License.
Atmospheric Chemistry and Physics Discussions
Technical note: Evaluation of standard
ultraviolet absorption ozone monitors in a
polluted urban environment
E. J. Dunlea1, ∗
, S. C. Herndon2, D. D. Nelson2, R. M. Volkamer1, B. K. Lamb3, E. J. Allwine3, M. Grutter4, C. R. Ramos Villegas5, C. Marquez6, S. Blanco6, B. Cardenas6, C. E. Kolb2, L. T. Molina1, and M. J. Molina1
1
Department of Earth, Atmospheric and Planetary Sciences, Massachusetts Institute of Technology, Bldg. 54, 77 Massachusetts Ave, Cambridge, MA 02139, USA
2
Aerodyne Research Inc., 45 Manning Road, Billerica MA 01821-3876, USA 3
Laboratory for Atmospheric Research, Department of Civil and Environmental Engineering, Washington State University, 101 Sloan Hall, Spokane Street, Pullman, WA 99164-2910, USA 4
Centro de Ciencias de la Atm ´osfera, UNAM, Ciudad Universitaria, 04 510 Mexico City, Mexico 5
Gobierno del Distrito Federal, Agricultura 21, Piso 1, Col. Escandon, Del. M. Hidalgo, CP 11 800, Mexico, D.F., Mexico
ACPD
6, 2241–2279, 2006 Evaluation of UV ozone monitors E. J. Dunlea et al. Title Page Abstract Introduction Conclusions References Tables Figures J I J I Back CloseFull Screen / Esc
Printer-friendly Version Interactive Discussion
EGU 6
Centro Nacional de Investigacion y Capacitacion Ambiental-INE, Av. Perif ´erico 5000, Col. Insurgentes Cuicuilco, CP 04530, Mexico, D.F., Mexico
∗
now at: University of Colorado at Boulder, Cooperative Institute for Research in Environmental Sciences, UCB 216, Boulder, CO 80309, USA
Received: 5 December 2005 – Accepted: 12 January 2006 – Published: 4 April 2006 Correspondence to: E. J. Dunlea ([email protected])
ACPD
6, 2241–2279, 2006 Evaluation of UV ozone monitors E. J. Dunlea et al. Title Page Abstract Introduction Conclusions References Tables Figures J I J I Back CloseFull Screen / Esc
Printer-friendly Version Interactive Discussion
EGU
Abstract
The performance of the EPA Federal Equivalent Method (FEM) technique for moni-toring ambient concentrations of O3 via ultraviolet absorption (UV) has been evalu-ated using data from the Mexico City Metropolitan Area (MCMA-2003) field campaign. Comparisons of UV O3 monitors with open path Differential Optical Absorption
Spec-5
troscopy (DOAS) and open path Fourier Transform Infrared (FTIR) spectroscopy instru-ments in two locations revealed average discrepancies in the measured concentrations of+13% to −10%. Excellent agreement of two separate open path DOAS measure-ments at one location indicated that spatial and temporal inhomogeneities were not substantially influencing comparisons of the point sampling and open path instruments.
10
The poor agreement between the UV O3monitors and the open path instruments was attributed to incorrect calibration factors for the UV monitors, although interferences could not be completely ruled out. Applying a linear correction to these calibration fac-tors results in excellent agreement of the UV O3monitors with the co-located open path measurements; regression slopes were 0.94 to 1.04 and associated R2 values were
15
>0.89. A third UV O3 monitor suffered from large spurious interferences, which were attributed to extinction of UV radiation within the monitor by fine particles (<0.2 µm) due to a particulate filter with too large a pore size. The overall performance of this par-ticular monitor was poor owing to a combination of interferences from a contaminated particle filter and/or ozone scrubber. Suggestions for improved operation practices of
20
these UV O3monitors and recommendations for future testing are made.
1 Introduction
Ozone (O3) often serves as the benchmark for the overall pollution level of a given airshed and has been designated as a “criteria pollutant” by the United States Environ-mental Protection Agency (US EPA). The costs of reducing O3pollution are estimated
25
ACPD
6, 2241–2279, 2006 Evaluation of UV ozone monitors E. J. Dunlea et al. Title Page Abstract Introduction Conclusions References Tables Figures J I J I Back CloseFull Screen / Esc
Printer-friendly Version Interactive Discussion
EGU
Nacional de Ecolog´ıa (INE) in Mexico (McKinley et al., 2003) found that the implemen-tation of several control measures could achieve a 3% reduction in daily maximum ozone concentration at the cost of approximately two billion dollars. Regulatory action is initiated by the US EPA when measured O3concentrations in an urban area exceed a certain threshold (see Reynolds et al., 2004, for recent discussion of one-hour and
5
eight-hour averaged daily maxima standards); this is referred to as “non-attainment”. Hundreds of US counties are either close to the threshold or already in non-attainment, and it has been suggested that up to half of the non-attainment counties in the US have O3concentrations in excess of the threshold as a result of measurement interferences (Leston et al., 2005).
10
The improvement of monitoring of O3and its precursors was mandated by the 1990 Clean Air Act Amendments (Sect. 182 (c) (1)) (Demerjian, 2000). The US EPA has de-veloped recommendations for standard measurement techniques and calibration prac-tices (Environmental Protection Agency, 1998; Paur and McElroy, 1979) to ensure the quality of measurements for these pollutants. The Federal Reference Method (FRM)
15
for O3 is a chemiluminescence detector, however, by far the most common technique for determining the ambient concentration of O3is ultra-violet absorption (UV O3 mon-itor), which has been designated as a Federal Equivalent Method (FEM). Indeed, UV O3monitors account for almost all of the UV monitoring in the US (Leston et al., 2005). Monitoring networks in other countries have also adopted UV O3monitors making them
20
the most ubiquitous instruments for O3monitoring worldwide. Due to the importance of measuring O3and the widespread use of UV O3monitors, it is critical that this mea-surement technique be accurate, precise, and well-characterized.
The technique of UV absorption measurement of O3has been described elsewhere (Proffitt and McLaughlin, 1983) and only a brief description is included here.
Advan-25
tages of the UV absorption technique include its relatively low cost and overall reliability. UV O3monitors employ mercury (Hg) lamps as reliable sources of line UV radiation at 253.65 nm, corresponding closely to the peak in the O3 cross section (Sander et al., 2002). A typical UV O3 monitor utilizes an ozone-specific scrubber, often manganese
ACPD
6, 2241–2279, 2006 Evaluation of UV ozone monitors E. J. Dunlea et al. Title Page Abstract Introduction Conclusions References Tables Figures J I J I Back CloseFull Screen / Esc
Printer-friendly Version Interactive Discussion
EGU
dioxide (MnO2) on a substrate or heated silver wool, to create an ozone-free air flow for reference. The UV radiation intensity passing through this reference flow is compared to that through a flow of ambient air and the number density of O3is determined by the straight-forward Beer-Lambert absorption equation. The measurement of the O3 num-ber density by this absorption method is in principle an absolute determination, relying
5
only on the absorption cross section of the O3 molecule at 253.65 nm. Scattering or absorption of UV radiation by ambient aerosols is prevented by a PTFE fluorocarbon particle filter with pore sizes between 0.2 and 5.0 µm placed in the inlet to the UV O3 monitor. These filters must be changed frequently to prevent a buildup of materials which might then catalyze the breakdown of O3 on the filter or release compounds
10
that could absorb UV radiation. Although UV absorption is in theory an absolute mea-surement technique, in practice, these monitors are routinely calibrated by generating a known amount of O3 via UV photolysis of molecular oxygen in dried/clean air, often ambient air passed through a desiccant and a charcoal filter.
Possible interferences in this measurement technique have been summarized in
sev-15
eral recent reviews (Cavanagh and Verkouteren, 2001; Demerjian, 2000; Environmen-tal Protection Agency, 1993; McClenny et al., 2002; Parrish and Fehsenfeld, 2000; Sickles, 1992). Overall, previous evaluations of the performance of UV O3 monitors have yielded mixed results. Several studies have shown adequate performance of UV O3 monitors in comparison to chemiluminescence (Ryerson et al., 1998) and
spec-20
troscopic (Stevens et al., 1993) instruments. Alternatively, a number of studies have shown interferences due to scattering of UV radiation by fine particles within the in-strument (Arshinov et al., 2002; Leston and Ollison, 2000) and anomalous sensitivity of the manganese dioxide scrubbers to ambient water vapor, causing a discrepancy compared with calibrations typically performed with dry gas (ASTM, 2003; Butcher and
25
Ruff, 1971; Cavanagh and Verkouteren, 2001; Leston et al., 2005; Maddy, 1999; Par-rish and Fehsenfeld, 2000). Aromatic hydrocarbons and oxidized or nitrated aromatics are known to absorb UV radiation and are the most likely to be present in sufficient quantities in an urban environment to potentially contribute to this type of
interfer-ACPD
6, 2241–2279, 2006 Evaluation of UV ozone monitors E. J. Dunlea et al. Title Page Abstract Introduction Conclusions References Tables Figures J I J I Back CloseFull Screen / Esc
Printer-friendly Version Interactive Discussion
EGU
ence (Cavanagh and Verkouteren, 2001; Grosjean and Harrison, 1985; Hudgens et al., 1994; Kleindienst et al., 1993; Leston et al., 2005). Overall, there is still a need for field intercomparisons of these UV O3monitors, particularly intercomparisons done in urban locations with high O3 concentrations typical of non-attainment conditions (Par-rish and Fehsenfeld, 2000).
5
This study aims to evaluate the performance of several standard UV O3monitors dur-ing a field measurement campaign in Mexico City durdur-ing sprdur-ing of 2003. The Mexico City Metropolitan Area field campaign (MCMA-2003) featured a comprehensive suite of both gas and particle phase instrumentation from numerous international laborato-ries, including multiple measurements of O3. We utilize this unique data set to assess
10
the performance of these standard monitors in a heavily polluted urban atmosphere, examine possible interferences and make recommendations for advances in testing and operation of these monitors that should be pursued.
2 Measurements
Figure 1 provides a map of the MCMA with the locations of the various sites from
15
where measurements will be presented. A more complete description of the MCMA-2003 field campaign is given elsewhere (de Foy et al., 2005; Molina and Molina, 2005). Details of the O3 measurements made at each location are described below, and we briefly introduce the sites here. “CENICA”, where the campaign was headquartered, receives a mix of fresh pollution from nearby traffic corridors and aged pollution from
20
more downtown locations. The “La Merced” site is located very near a busy roadway and the La Merced marketplace. The “Pedregal” site is located at an elementary school in an affluent residential neighborhood west of the city center. As a downwind receptor site, Pedregal often has the highest ozone readings in the city. The “Santa Ana” site is located in the small town of Santa Ana just outside of Mexico City to the southwest and
25
up on a mountain ridge above the Mexico City basin floor. Mexico City is surrounded on three sides by mountains (east, south and west); Santa Ana is close to the southern
ACPD
6, 2241–2279, 2006 Evaluation of UV ozone monitors E. J. Dunlea et al. Title Page Abstract Introduction Conclusions References Tables Figures J I J I Back CloseFull Screen / Esc
Printer-friendly Version Interactive Discussion
EGU
gap in the mountains at Amecameca and receives mostly aged urban air during the day and rural air overnight. The ozone data measured by various instruments located at these sites form the basis of this evaluation.
2.1 CENICA
The “supersite” for the MCMA-2003 campaign was located at the headquarters
build-5
ing of the Centro Nacional de Investigacion y Capacitacion Ambiental (CENICA) and included a comprehensive suite of both gas phase and aerosol instrumentation from a number of Mexican, American and European institutions (de Foy et al., 2005; Molina and Molina, 2005). The two-story CENICA building is located on the Iztapalapa cam-pus of the Universidad Aut ´onoma Metropolitana (UAM), to the southeast of the city
10
center (see Fig. 1). The site is approximately 1000 m from a minor roadway and 1500 m from a major roadway. For the MCMA-2003 campaign, two research grade long path Differential Optical Absorption Spectroscopy (DOAS) instruments and a research grade long path Fourier Transform Infrared (FTIR) spectrometer were installed on the rooftop of the CENICA building and were operated by groups from the Massachusetts
Insti-15
tute for Technology (MIT) and Chalmers University of Technology (CTH), respectively. The DOAS technique has been described elsewhere (Platt, 1994). In brief, light from a broadband UV/vis lightsource (Xe-short arc lamp) is projected into the open atmo-sphere onto a distant array of retro reflectors, which folds the lightpath back into the instrument where spectra are recorded using a Czerny-Turner type spectrometer
cou-20
pled to a 1024-element PDA detector. For the MCMA-2003 campaign, the DOAS-1 light path was directed towards an antenna tower in a south-easterly direction at an av-erage height of 16 m with a 430 m path length (total 860 m). The DOAS-2 lightpath was directed towards a local hill side of Cerro de la Estrella in a south-westerly direction at an average height of 70 m with a 2.21 km path length (total 4.42 km). Both LP-DOAS
25
instruments measured O3 among other species (Volkamer et al., 1998, 2005b) us-ing ozone’s unique specific narrow-band (<5 nm) absorption structures between 252– 262 nm (DOAS-1) and 325–358 nm (DOAS-2). Temperature dependent absorption
ACPD
6, 2241–2279, 2006 Evaluation of UV ozone monitors E. J. Dunlea et al. Title Page Abstract Introduction Conclusions References Tables Figures J I J I Back CloseFull Screen / Esc
Printer-friendly Version Interactive Discussion
EGU
cross-sections (Bass and Paur, 1981) for 293 K and 313 K were convoluted to match the spectral resolution of the instruments, and fitted simultaneously with other trace-gas reference spectra and a fifth order polynomial high-pass filter to account for broadband molecule and aerosol extinction using non-linear least squares fitting routines (Fayt and van Roozendael, 2001; Stutz and Platt, 1996). The detection limits for O3 were
5
1.3 ppb for DOAS-1 and 5.0 ppb for DOAS-2. This significantly smaller detection limit of DOAS-1 reflects the roughly 20 times larger differential absorption cross section in the wavelength range used by this system. This potential for much more sensitive ozone measurements is partly offset by increasing light extinction from Rayleigh and Mie scat-tering at shorter wavelengths, which limits attainable absorption pathlengths and thus
10
detection limits. Also, the broadband light absorption from O3 in the Hartley band re-duces the transparency of the atmosphere and may increase photon shot-noise in the spectra. Moreover, different straylight sources gain relative importance in this wave-length range, and need to be corrected for. Finally, the atmospheric oxygen absorption features in the Herzberg band-systems need to be eliminated carefully to allow for
ab-15
solute measurements of ozone by DOAS. We have overcome all the above limitations following the procedure described in Volkamer et al. (1998).
The open-path FTIR system was operated parallel to the DOAS-1 lightpath sampling nearly identical airmasses (same length light path, <2 m apart). The FTIR consisted of a medium resolution (1 cm−1) spectrometer (Bomem MB104) coupled to a homemade
20
transmitting and receiving telescope, and provided CO data (among other species) with 5 min integration time. Spectra were analyzed using the latest HITRAN database cross sections (Rothman et al., 2003) and a nonlinear fitting algorithm (Samuelsson et al., 20051). The detection limit for the FTIR system was 10 ppb.
In addition to the equipment installed for the MCMA-2003 campaign, CENICA
main-25
tains a monitoring station located on the roof of its headquarters building, which in-cludes a standard UV O3monitor (Advanced Pollution Instruments (API) model #400, detection limit 3 ppb, heated metal wool scrubber (12 W) with typical operating
temper-1
ACPD
6, 2241–2279, 2006 Evaluation of UV ozone monitors E. J. Dunlea et al. Title Page Abstract Introduction Conclusions References Tables Figures J I J I Back CloseFull Screen / Esc
Printer-friendly Version Interactive Discussion
EGU
ature of 70◦C). The inlet for this monitoring station was 15 m above the ground. This UV O3 monitor was calibrated on the same afternoon and via the same standard method as the one on board the ARI Mobile Lab (see Sect. 2.3).
2.2 La Merced, Pedregal and Santa Ana
Another featured component of the MCMA-2003 campaign was a measurement site
5
located downtown near the La Merced marketplace; the site is located in close prox-imity to a busy roadway and <500 m from major bus station (TAPO). This site and instrumentation have been described in detail elsewhere (Grutter et al., 2003); briefly, researchers from Universidad Nacional Aut ´onoma de M ´exico (UNAM) operated two open path remote sensing instruments: one research grade FTIR and one
commer-10
cial DOAS system (Opsis AR500). The light paths were run side-by-side between the rooftops of two four-story buildings (∼20 m above the ground) and were 426 m long. O3 was measured by both FTIR and DOAS in addition to numerous other compounds; the detection limit for O3by the FTIR technique was better than 2 ppb (Grutter et al., 2003) and employs the latest HITRAN database cross sections (Rothman et al., 2003). The
15
UNAM instruments were in close proximity (<30 m) to a monitoring station operated by Red Autom ´atica de Monitoreo Ambiental (RAMA, 2005). RAMA operates 32 mon-itoring sites around the Mexico City metropolitan area, 20 of which are equipped with standard UV O3 monitors, including the La Merced location (API 400, MnO2 scrub-ber). The RAMA network has been audited by the US EPA (Environmental Protection
20
Agency, 2003), and was concluded to be “accurate and well-implemented”. In particu-lar, the O3audit data “were of outstanding quality with no significant bias or imprecision detected across all stations and concentrations audited.” The inlet at the La Merced site is ∼6 m above the ground and is <10 m from the nearby roadway.
The Pedregal site also housed a RAMA monitoring station including a UV O3monitor
25
(API 400, MnO2scrubber). The inlet for the monitoring station is at a height of ∼4 m and the site is ∼300 m away from a major roadway. At the Santa Ana site, researchers from CENICA operated a monitoring station that included several criteria pollutant monitors
ACPD
6, 2241–2279, 2006 Evaluation of UV ozone monitors E. J. Dunlea et al. Title Page Abstract Introduction Conclusions References Tables Figures J I J I Back CloseFull Screen / Esc
Printer-friendly Version Interactive Discussion
EGU
including a UV O3 monitor (Thermo Environmental (TECO), Model 49C with a MnO2 scrubber). The Santa Ana monitoring station was 600 m away from a minor roadway with an inlet that was 3 m above the ground.
2.3 Aerodyne Mobile Laboratory
Another major component of the MCMA-2003 campaign was the Aerodyne Research,
5
Inc. Mobile Laboratory (ARI Mobile Lab), a van equipped with a comprehensive suite of research grade gas and particle phase instrumentation (Kolb et al., 2004), including a UV O3 monitor (Thermo Environmental (TECO), Model 49-003 with an unheated MnO2 scrubber). All instruments included in this study sampled from the main inlet line. When moving, this inlet sampled from in the front of the mobile lab at a height of
10
2.4 m above the road surface, protruding 1.2 m from the front bulkhead above the driver seat, resulting in a typical minimum horizontal distance between the inlet and a chased vehicle of at least several meters (Shorter et al., 2005). While stationary, an extension was added to the inlet to sample from a height of 5 m above the ground. Measured and calculated lag times for all instruments were short (<10 s) and agreed within 15%
15
(Herndon et al., 2005).
The ARI Mobile Lab was operated in two modes interspersed throughout the five weeks of the MCMA-2003 field campaign – mobile and stationary modes (Kolb et al., 2004). The goals of the mobile mode were to follow specific vehicles to measure their on-road emission ratios and to map out the influence of stationary emission sources. In
20
stationary mode, the ARI Mobile Lab visited the three locations within Mexico City listed in Sect. 2.2 and made continuous measurements at each location for several days in a row. Additionally, the ARI Mobile Lab spent a majority of the nights and several full days during the five week field campaign in the parking lot adjacent to the CENICA building (Sect. 2.1).
25
The UV O3monitor on board the ARI Mobile Lab was calibrated near the beginning of the field campaign via the EPA standard method by RAMA technicians for continuity of comparisons with RAMA monitors, as all UV O3 monitors in the RAMA network are
ACPD
6, 2241–2279, 2006 Evaluation of UV ozone monitors E. J. Dunlea et al. Title Page Abstract Introduction Conclusions References Tables Figures J I J I Back CloseFull Screen / Esc
Printer-friendly Version Interactive Discussion
EGU
routinely calibrated by this method (RAMA, 2005). This calibration procedure involved the use of a charcoal filter for the production of O3 free air in which a known amount of O3 is generated by the photolysis of O2 at 185 nm. The performance of the O3 generator was tracked by the use of a reference O3 monitor maintained in pristine condition in a laboratory. Additionally for the ARI Mobile Lab UV O3 monitor, zero
5
checks were performed several times throughout the campaign by placing a charcoal filter in front of inlet to remove ambient O3; the resulting readings were always near zero (between −4 and 2 ppb). The detection limit for this UV O3monitor was 2 ppb.
3 Results and discussion
3.1 Interference from ambient particles for UV O3monitor on board ARI Mobile Lab
10
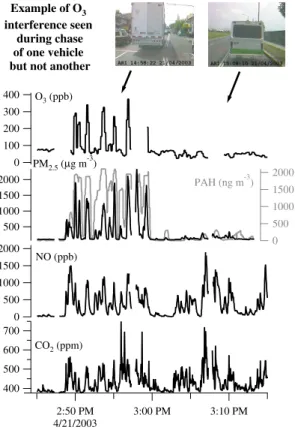
During the course of the five week MCMA-2003 campaign, distinct “spike events” in the UV O3monitor on board the ARI Mobile Lab were observed when the ARI Mobile Lab was sampling the ambient diluted exhaust from on-road diesel vehicles. This UV O3 monitor registered spikes of up to 400 ppb occurring simultaneously with large in-creases in CO2 and NO concentrations from sampled combustion plumes. Figure 2
15
shows an example of such an O3spike event while sampling a diesel truck with large particle loadings, but then not present during a chase of a non-diesel microbus just min-utes later. More than twenty-five of these events were observed during the MCMA-2003 campaign. All such interference events were coincident with large enhancements in particle number density. Almost all of these events were observed when the ARI Mobile
20
Lab was clearly sampling the exhaust from a diesel vehicle (Canagaratna et al., 2004; Herndon et al., 2005; Shorter et al., 2005). Of the various instruments on board the ARI Mobile Lab, the best correlations in time for these interferences were found with sev-eral particle instruments, specifically a DustTrack PM2.5 instrument, which measured the mass loading of particulate matter smaller than 2.5 microns, and an EcoChem
25
ACPD
6, 2241–2279, 2006 Evaluation of UV ozone monitors E. J. Dunlea et al. Title Page Abstract Introduction Conclusions References Tables Figures J I J I Back CloseFull Screen / Esc
Printer-friendly Version Interactive Discussion
EGU
photoionization of particulate surfaces and has been shown to respond strongly to sur-face bound PAHs and possibly to elemental carbon (EC); see Marr et al. (2004) and Jiang et al. (2005) for a description of the use and interpretation of these instruments while sampling very fresh on-road exhaust emissions. Also on board the ARI Mobile Lab, an Aerodyne Aerosol Mass Spectrometer (AMS) (Jayne et al., 2000) measured
5
size resolved chemical composition of non-refractory particles less than 1 µm. The AMS showed an increased loading of organic material from diesel vehicles, but no enhancement in nitrate, sulfate or ammonium, consistent with other observed diesel exhaust measurements (Canagaratna et al., 2004). Poor correlations at the time of these O3 interference spikes were found with other gas phase species measured on
10
board the ARI Mobile Lab, including CO, formaldehyde (HCHO), sulfur dioxide (SO2), nitrogen dioxide (NO2), and a suite of volatile organic compounds (VOC) measured in real time by an on-board Proton Transfer Reaction Mass Spectrometer (PTRMS) (Knighton et al., 2006).
Diesel vehicles are not known to emit O3directly (Chow, 2001; Yanowitz et al., 2000).
15
The NO concentrations observed in Fig. 2 (>500 ppb) result in a short lifetime for O3 with respect to loss via reaction with NO (<6 s); this was shorter than the residence time in the inlet for the UV O3 monitor inside the ARI Mobile Lab (∼12 s). Thus, if O3were directly emitted by a diesel vehicle, it would have to be in enormous concentrations (>2 ppm per 1 ppm of CO2emitted) to be observed in the large concentrations in Fig. 2.
20
It is concluded that these large O3spikes were not due to O3itself, but rather are due to interferences in the O3measurement.
Diesel vehicles are known to emit particles with large number densities in both a nanomode, (0–0.05) µm, and an accumulation mode, (0.05–0.5) µm (Canagaratna et al., 2004; Kittelson, 1998). Particles less than 0.2 µm in geometric diameter are known
25
to pass through standard inlet filters and cause a interferences in UV O3monitors, by as much as a factor of three in a previous study (Arshinov et al., 2002), although not all studies have observed this (Huntzicker and Johnson, 1979). Submicron particles, which were emitted from diesel vehicles and pass through the particulate filter of the
ACPD
6, 2241–2279, 2006 Evaluation of UV ozone monitors E. J. Dunlea et al. Title Page Abstract Introduction Conclusions References Tables Figures J I J I Back CloseFull Screen / Esc
Printer-friendly Version Interactive Discussion
EGU
UV O3monitor and scatter and/or absorb UV light within the detection chamber, were thus the most likely explanation for the large interferences like that shown in Fig. 2. Other gas phase species emitted from diesel vehicles, but not measured by the ARI Mobile Lab, or species desorbing off of the particulate filter specifically during sampling of diesel exhaust could also explain these observed interferences. However, neither of
5
these possibilities seems as likely as an interference from submicron particles entering the detection chamber within the UV O3monitor.
The question is whether this type of interference presents a significant issue for most UV O3monitors. Arshinov et al. (2002) observed a significant interference to a UV O3 monitor from fine particles with median particle diameters between 0.06 to 0.07 µm.
10
When a suitable filter to remove these particles was placed in front of the UV O3 mon-itor, the interference disappeared. Obviously, the UV O3 monitor on board the ARI Mobile Lab in this study did not have a filter with a small enough pore size to remove these fine particles. This is not necessarily the case for all UV O3 monitors however. Additionally, the placement of UV O3 monitors in locations that do not directly sample
15
fresh traffic emissions allows the fine particles characteristic of fresh traffic emissions to grow into large enough sizes to be more efficiently filtered out. Thus, sampling done from the ARI Mobile Lab represented an extreme case, with particle loadings often greater than 2000 µg m−3, which were heavily dominated by fresh traffic emissions and were thus comprised mostly of fine particles (Dp<0.2 µm). The interference in the UV 20
O3 monitor on board the ARI Mobile Lab roughly correlated with the PM2.5 particle loading as measured by the DustTrack instrument; the correlation factor was (0.12– 0.18 ppb) of O3interference per 1 µg m−3 of particle loading. Ambient loadings typical for many urban environments of <15 µg m−3would thus lead to a potential interference for a normally situated UV O3 monitor (at least one that was not on board a mobile
25
laboratory) of <3 ppb. Over the course of an eight hour day in an urban area with a daily maximum O3concentration of 100 ppb, this type of interference could lead to an average measured O3concentration that is at most 3% higher than reality. The actual influence of fine particles on the measured O3 concentration by typical UV O3
moni-ACPD
6, 2241–2279, 2006 Evaluation of UV ozone monitors E. J. Dunlea et al. Title Page Abstract Introduction Conclusions References Tables Figures J I J I Back CloseFull Screen / Esc
Printer-friendly Version Interactive Discussion
EGU
tors would be expected to be even less owing to a more suitable placement of most UV O3 monitors that will not sample primarily fresh traffic emissions. This indicates that this type of interference is not likely to be a significant problem, even for UV O3 monitors that do not use a filter with a small enough pore size to remove fine particles (Dp<0.2 µm). In summary, although the UV O3 monitor on board the ARI Mobile Lab
5
was shown to have large interferences from fine particles, this type of interference is not likely to greatly affect most UV O3monitors used for ambient sampling.
3.2 Overall comparison of multiple O3measurement techniques
During MCMA-2003, O3 concentrations in Mexico City were observed to exceed 200 ppb on several occasions and exceeded 100 ppb on every day of the 5 week
cam-10
paign. Thus, the evaluation of the UV O3 monitors in this setting constituted a test under non-attainment conditions by the US EPA’s standards. In this study, the per-formance of UV O3 monitors at the CENICA and La Merced sites was evaluated by comparison with co-located DOAS and FTIR open path spectroscopic measurements, which are both non-intrusive and are considered absolute techniques in so far as they
15
rely on extensively studied absorption cross sections (Orphal and Chance, 2003). Ta-ble 1a lists the results of linear regressions for the O3concentrations as measured by UV O3 monitors versus those from the corresponding spectroscopic measurements. The two UV instruments differed from the open path measurements by more than 8% at each of the CENICA and La Merced sites, however one was systematically higher
20
than the open path determination and the other was lower. The R2 values listed in Table 1 are all >0.89. The three most probable reasons for divergence from near-perfect agreement were: (3.2.1) inherent difficulties in comparing open path and point sampling techniques, (3.2.2) incorrect calibration factors for the UV O3 monitors, and (3.2.3) interferences in the UV O3monitors. The UV O3monitor on board the ARI
Mo-25
bile Lab (Table 1d) is not included in this assessment for reasons described below in Sect. 3.2.4.
ACPD
6, 2241–2279, 2006 Evaluation of UV ozone monitors E. J. Dunlea et al. Title Page Abstract Introduction Conclusions References Tables Figures J I J I Back CloseFull Screen / Esc
Printer-friendly Version Interactive Discussion
EGU
3.2.1 Comparison of open path and point sampling measurements
The comparison of an open path measurement with a point sampling measurement is inherently difficult owing to the spatial and temporal inhomogeneities within an ur-ban airshed, driven by complex micro-meteorology and/or strong vertical gradients in concentration due to dry deposition. At the CENICA site, the measurements made by
5
the two open path DOAS instruments, which were pointed in different directions and measured at different mean heights and pathlengths, provide an insight into the uni-formity of the air mass in the area surrounding the site. The high level of agreement between the two DOAS instruments shown in Table 1b (15 min averaged points, re-gression slope ≥0.93, R2=0.96) indicates that O3is mixed rather homogeneously over
10
a spatial scale of few kilometers near the CENICA site. The regression slope for this comparison was less than unity (0.93) owing to a number of points at low O3 concen-trations where the DOAS-2 light path showed higher O3 levels than the DOAS-1 light path, which is thought to be due to the closer proximity of the DOAS-1 light path to fresh combustion sources (see discussion below Sect. 3.2.2). Comparisons between
15
the point sampling UV O3monitor and either of the DOAS instruments should be able to achieve the same level of agreement, but they do not.
To further put the comparisons of the O3 measurements in context, we also com-pared the measurements of CO by point sampling and open path techniques at both the CENICA and La Merced sites; see Table 1c. Because CO is not as reactive as O3
20
nor as likely to have strong vertical gradients owing to deposition (Stutz et al., 2004), CO should be more homogeneously mixed throughout the boundary layer within the city. At the same time, CO is a primary pollutant from mobile and other sources and there may be inhomogeneities in close proximity to CO sources that do not occur for O3. For example, the relatively poorer correlation of the CO monitor at the La Merced
25
site may be due to the close proximity of the La Merced RAMA monitoring station to a heavily trafficked corridor. The R2 values for the linear regressions for the CO mea-surements are thus another indicator of the level of spatial and temporal variation. The
ACPD
6, 2241–2279, 2006 Evaluation of UV ozone monitors E. J. Dunlea et al. Title Page Abstract Introduction Conclusions References Tables Figures J I J I Back CloseFull Screen / Esc
Printer-friendly Version Interactive Discussion
EGU
R2 values for the CO measurements were smaller than those for the respective O3 regression plots at both the CENICA and La Merced sites. This further corroborates our conclusion above that spatial inhomogeneities do not limit the comparison of open-path and point-sampling O3 measurements at these two locations, particularly for the afternoon periods of elevated ozone concentrations. The next step is to examine why
5
the slopes of the regression analyses deviate from unity. 3.2.2 Calibration factors for UV O3monitors
Barring interferences (discussed below in 3.2.3), the slopes of the regression analyses for these comparisons are indicative of the relative calibration factors. We again use the linear regressions for co-located open path DOAS O3 and CO measurements as
10
points of comparison with the O3 measurements. The open path DOAS O3 and CO regressions had slopes closer to unity than those for the O3regression plots, indicating better agreement in the relative calibration factors of the two instruments. The slopes for the open path DOAS O3 and CO comparisons were all within 7% of unity. The slopes of the O3 regression were not as consistent; (1.08–1.13) and (0.82–0.90) for
15
CENICA and La Merced respectively. It is noteworthy, that differences were found largest for the commercial DOAS instrument at La Merced (−18%). The reason for this is unclear and unfortunately, any further discussion of this data is only possible to a very limited extent, as the evaluation procedure employed by the company is not clear to us. A previous comparison of the O3 reported at La Merced by this DOAS
20
and the more reliable FTIR instrument (Grutter and Flores, 2004), however, presented a very high correlation (R2=0.99). Since the absolute concentration by the DOAS was consistently lower than that from the FTIR, a correction to the DOAS results was applied accordingly. For this reason, the regression comparing the O3 monitor with the FTIR (−10%) is probably a better indicator of the actual difference. Intercepts for
25
the O3regressions with respect to the UV monitors were negligible indicating that the differences in the regression slopes were not skewed by offsets, but are attributed to
ACPD
6, 2241–2279, 2006 Evaluation of UV ozone monitors E. J. Dunlea et al. Title Page Abstract Introduction Conclusions References Tables Figures J I J I Back CloseFull Screen / Esc
Printer-friendly Version Interactive Discussion
EGU
differences in the calibration factors. Because of the given evidence, the most probable reason for the discrepancies found is then determined to be due to the calibration factors in the UV O3monitors.
A closer inspection of the daily patterns corroborates that the calibration of the UV O3 monitors was the cause of the non-unity slopes in the linear regression plots.
Fig-5
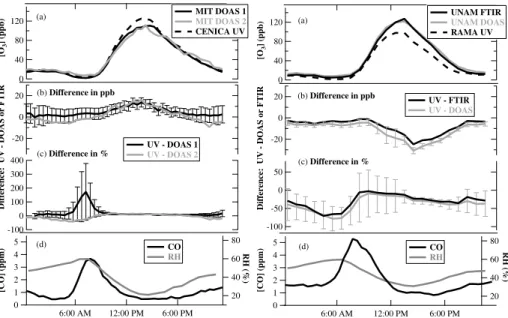
ure 3a shows that the UV O3 monitor differs most in absolute concentration from the corresponding spectroscopic measurement at both CENICA and La Merced during af-ternoons when the O3 concentrations were at their highest. Although the absolute concentration difference (Fig. 3b) varied throughout the course of the day, the per-centage difference (Fig. 3c) remained constant from roughly 10 a.m. to 5 p.m. local
10
time each day, with values around+12% (±2.5%) of the ambient O3concentration for CENICA and −14% (±8.4%) for La Merced. Overall, in both comparisons, the consis-tent percentage difference for most of the day light hours, averaged over the span of a month leads us to the conclusion that the UV O3 monitors at both sites differed from the co-located open path measurements due to a calibration issue.
15
This discrepancy in the UV O3 monitor calibration factors can be corrected for by multiplying the O3concentrations from the UV O3monitors by a constant factor based on the linear regression plots’ slopes listed above. Such a correction brings all com-parisons with all four open path measurements listed to within 5% with corresponding R2values all greater than 0.90; see Table 2. This is excellent agreement in light of the
20
other comparisons shown in Table 1 and previous studies, which have concluded that UV O3 monitors can measure tropospheric O3 concentrations with uncertainties less than ±3% (Parrish and Fehsenfeld, 2000).
The open path spectroscopic measurements are dependent on knowledge of the absorption cross section for the molecule being detected. Recent studies have shown
25
that the infrared cross sections of O3 from the HITRAN data base, upon which the FTIR open path measurements depend, are up to 5% too large (Picquet-Varrault et al., 2005). Although using this information could bring the comparisons with the UV O3 monitor into better agreement, it would only partially explain the observed differences
ACPD
6, 2241–2279, 2006 Evaluation of UV ozone monitors E. J. Dunlea et al. Title Page Abstract Introduction Conclusions References Tables Figures J I J I Back CloseFull Screen / Esc
Printer-friendly Version Interactive Discussion
EGU
of 10%.
In theory, the UV O3monitor is an absolute measurement that does not require ad-justment. In practice, however, these monitors are routinely calibrated by generating a known amount of O3in a flow of dry zero air and then adjusting the “span” or relative response of the UV O3monitor to match the calibration standard (Parrish and
Fehsen-5
feld, 2000). The US EPA recommends that calibrations be performed every six months with zero/span checks performed every two weeks with adjustments of the span up to 20% considered acceptable (Environmental Protection Agency, 1998). Typically, mon-itoring networks perform calibrations and zero/span checks more frequently, e.g. cali-brations every month, and zero/span checks nightly (TCEQ, 2006). UV O3monitors in
10
the RAMA monitoring network are calibrated every two weeks with span/zero checks performed weekly and allowable span adjustments of ±10% (RAMA, 2005). Some studies have shown problems in this method arising from the use of dry calibration gas where ambient measurements are made in moist air (Leston et al., 2005; Parrish and Fehsenfeld, 2000), and this is discussed in Sect. 3.2.3. The most likely explanation for
15
the observed differences between the open path and UV O3monitors is the resetting of the calibration factors on the UV O3 monitors as part of routine calibrations. We reiterate that the RAMA network has been audited by the US EPA (Environmental Pro-tection Agency, 2003) and found to be operating well under the guidelines for proper maintenance of their instruments, which indicates that it was the approved calibration
20
procedures that allowed these differences to occur.
Looking at the rest of the diurnal pattern for the O3comparisons in Fig. 3c, the largest percentage differences occur during the morning (5 a.m. to 9 a.m. local time), which we will refer to here as “morning rush hour”. During this period, the O3concentrations were at their smallest and, as such, were most prone to slight differences between
25
open path and point sampling measurements, in particular the influence of NO and other combustion products. Motor vehicles are the most dominant NOx sources in this environment, and at this time of day, the major source of O3at the surface is the down-mixing of O3from above. Typical NO concentrations during the morning rush hour were
ACPD
6, 2241–2279, 2006 Evaluation of UV ozone monitors E. J. Dunlea et al. Title Page Abstract Introduction Conclusions References Tables Figures J I J I Back CloseFull Screen / Esc
Printer-friendly Version Interactive Discussion
EGU
on order of >100 ppb, making the lifetime of O3 with respect to titration by NO<30 s. During the morning rush hour, the suppression of the O3concentration by 40% to 70% as measured by the UV O3monitor relative to the DOAS-2 open path at CENICA and relative to both open path instruments at La Merced was consistent with both of these UV O3 monitors being in relatively close proximity to fresh NO emissions. Thus, O3
5
as measured at these point sources was titrated by NO to a larger degree than along the open paths used by the spectroscopic techniques, which would have been more greatly influenced by down-mixing of O3from aloft. Note that the absolute differences in O3concentration during this morning rush hour time frame were 5 to 7 ppb for these three comparisons, which was only just larger than the combined uncertainties of the
10
pairs of instruments. The relatively higher amount of O3 measured by the UV O3 monitor at CENICA relative to the DOAS-1 open path instrument requires a different explanation; this difference in the concentration of UV O3monitor minus DOAS-1 had a maximum of 170%, which corresponds to 3.4 ppb out of 1.9 ppb total O3. We note that combustion sources also peak at this time of day; see Fig. 3d which shows the diurnally
15
averaged profiles of CO at CENICA and La Merced. The higher concentration of O3as measured by the UV O3monitor could potentially be explained by a small interference, presumably from a combustion product, perhaps fine particles (Sect. 3.1). However, the magnitude of this difference (3.4 ppb) was within the combined uncertainty of the two measurements, so there was no definitive evidence for an interference in the UV
20
O3monitor here.
3.2.3 Possible interferences in UV O3monitors
As introduced earlier, several, but not all, previous studies have observed interferences in the O3concentrations reported by UV O3monitors (Arshinov et al., 2002; Huntzicker and Johnson, 1979; Leston et al., 2005). The observed biases of the UV O3monitors at
25
the two comparison sites in this study, positive at CENICA and negative at La Merced, indicate that a single type of interference in the UV O3 monitor was not responsible for both of the observed differences between the monitors and the co-located open
ACPD
6, 2241–2279, 2006 Evaluation of UV ozone monitors E. J. Dunlea et al. Title Page Abstract Introduction Conclusions References Tables Figures J I J I Back CloseFull Screen / Esc
Printer-friendly Version Interactive Discussion
EGU
path instruments. However, we more thoroughly explore the possibility of interferences in the UV O3 monitors from (a) changing ambient relative humidity levels affecting the adsorption rate of aromatic compounds onto the scrubber in the UV O3 monitor (Leston et al., 2005) or directly influencing the transmission of UV radiation through the detection cell within the monitor (Wilson, 2005) and (c) particles entering the detection
5
chamber of the monitor (described in Sect. 3.1) or contaminating the particle filter. (a) We observed no evidence for either a positive or negative interference in the UV O3monitors from aromatic compounds being adsorbed/desorbed onto/from the scrub-ber coincident with variations in the ambient relative humidity. A positive interference in the UV O3monitor would be expected during periods when the ambient relative
hu-10
midity was decreasing or relatively stable, which would be from approximately 8 a.m. to 5 p.m. local time as shown in Fig. 3d. A positive bias in the UV O3 monitor was observed at the CENICA site during these times, however, the diurnal profiles for am-bient relative humidity were similar at both the CENICA and La Merced sites, and as noted above, the biases in the UV O3 monitors were of opposite direction relative to
15
the co-located open path spectroscopic instruments.
A positive interference would also be expected during periods of high ambient con-centrations of aromatic compounds which may adsorb onto the scrubber, causing an apparent increase in O3 concentration (Huntzicker and Johnson, 1979). The MCMA-2003 field campaign included multiple measurements of ambient VOC compounds
20
from several instruments: the two DOAS instruments located at the CENICA supersite, two PTRMS instruments, one of which was on board the ARI Mobile Lab (Knighton et al., 2006), and canister sampling followed by gas chromatography (GC) analysis at all of the locations described in this study (Lamb et al., 2004). These measurements provide a consistent picture that within Mexico City overall loadings of gas phase
aro-25
matics were higher during the morning hours (on order of ∼30 ppbv) and lower during the afternoons (on order of ∼15 ppbv). This was inconsistent with the overall pattern of the observed differences between the UV O3 monitors and the open path instru-ments, which showed a maximum in the afternoon. Additionally, both the DOAS and
ACPD
6, 2241–2279, 2006 Evaluation of UV ozone monitors E. J. Dunlea et al. Title Page Abstract Introduction Conclusions References Tables Figures J I J I Back CloseFull Screen / Esc
Printer-friendly Version Interactive Discussion
EGU
PTRMS instruments located at the CENICA site observed several large styrene (up to 3.9 ppbv) and naphthalene (up to 1.9 ppbv) events during the five week field campaign (Volkamer et al., 2005a). Laboratory tests have shown that UV O3 monitors respond to both styrene (Grosjean and Harrison, 1985; Hudgens et al., 1994) and naphthalene (Kleindienst et al., 1993), with response factors of (20%–113%) and 116%,
respec-5
tively. Corresponding interferences in the UV O3 monitors as compared to the DOAS instrument were not observed for these styrene and naphthalene events. We conclude that ambient aromatic hydrocarbons do not significantly influence the measurements made by UV O3monitors.
However, aromatic VOC’s are considered less likely to be the primary compounds
10
responsible for interferences in UV O3monitors than the oxidized and/or nitrated com-pounds formed from these aromatic VOC’s. For example, an EPA laboratory study (Wisbith, 1999) showed that modest levels of o-nitrotoluene (24 ppb) can cause a sig-nificant interference at low humidity (20–30%). (This same study (Wisbith, 1999) also showed that mercury was a significant interference, but mercury was found only in
15
sporadic short-duration events in Mexico City and would not have been the cause of interferences in the diurnal O3levels.) The aromatic hydrocarbon concentrations mea-sured during this study were large enough such that the concentrations of oxidized and/or nitrated products of these aromatics, which were not directly identified by the VOC measurements made during MCMA-2003, might be found in sufficient
concentra-20
tions to cause an interference as large as the observed difference between the UV O3 monitors and the co-located spectroscopic instruments. Thus, measured hydrocarbon levels during MCMA-2003 provided no evidence for interferences in the UV O3 moni-tors from oxidized and/or nitrated aromatic compounds, but did not definitively rule out the possibility.
25
A negative interference in the UV O3monitors would be expected as relative humidity rises in the late afternoon and aromatic compounds desorb from the scrubber into the reference channel of the UV O3 monitor (Leston et al., 2005). However, the negative difference between the UV O3monitor and the open path spectroscopic instruments at
ACPD
6, 2241–2279, 2006 Evaluation of UV ozone monitors E. J. Dunlea et al. Title Page Abstract Introduction Conclusions References Tables Figures J I J I Back CloseFull Screen / Esc
Printer-friendly Version Interactive Discussion
EGU
La Merced occurred during the early afternoon as relative humidity was decreasing. Some field studies involving co-located measurements of O3via chemiluminescence and UV absorption on board an airplane have shown no evidence for this effect of am-bient relative humidity variations on the scrubber performance (Ryerson et al., 1998). However, careful laboratory studies have shown that variations in relative humidity can
5
interact with the material of the detection cells within the UV O3monitors, causing spu-rious O3 concentration differences during times of rapid changes in ambient relative humidity (Meyer et al., 1991; Wilson, 2005). In this study, the fastest change in ambi-ent relative humidity occurred before 9 a.m. local time, which did not correspond with the maximum observed difference between the UV O3 monitors and the open path
10
spectroscopic instruments which occurred several hours later, typically after 12 p.m. local time. Additionally, this afternoon time period of maximum discrepancy in the UV O3 monitors was coincident with periods of relatively stable ambient relative humid-ity. Thus, we did not observe any evidence for this interference of changing relative humidity in this field study.
15
Lastly, we note that our results contradict those of Leston et al. (2005) from their Mexico City study, who observed a difference between co-located UV and chemilumi-nescence O3 monitors that they attributed to contamination of the O3 scrubber in the UV O3 monitor. The reasons for this contradiction are unclear, but further measure-ments are suggested at the end of this article.
20
In conclusion, we observed no evidence for any interference, either positive or nega-tive, in the UV O3monitors from varying ambient relative humidity levels, either affecting the sorption of aromatic compounds onto the scrubber or interacting with the material within the detection cells within the monitors. Measurements of ambient hydrocarbons exclude the possibility that aromatic VOC’s cause a significant interference in UV O3
25
monitors, but do not preclude the possible influence of oxidized and/or nitrated aromat-ics. However, as detailed in Sect. 3.2.2, the most plausible explanation for the observed differences between the UV O3monitors and the open path spectroscopic instruments was the incorrect calibration factors for the UV monitors.
ACPD
6, 2241–2279, 2006 Evaluation of UV ozone monitors E. J. Dunlea et al. Title Page Abstract Introduction Conclusions References Tables Figures J I J I Back CloseFull Screen / Esc
Printer-friendly Version Interactive Discussion
EGU
(b) A possible interference from ambient particles was not substantiated by diurnal profiles of particle mass below 0.2 µm from either previous studies (Moya et al., 2004) or from the MCMA-2003 campaign (Salcedo et al., 2005a, b). Fine particles of diameter
<0.2 µm reached a maximum mass concentration in Mexico City during the morning
hours, but differences between the UV O3monitors and the spectroscopic instruments
5
were largest during the afternoon. PM10 measurements at both the CENICA and La Merced sites corroborate this diurnal pattern, also showing maximum particle loadings in the morning (RAMA, 2005). Thus, ambient particles could not have accounted for the observed differences between the UV O3monitors and the open path spectroscopic instruments.
10
3.2.4 UV O3monitor on board ARI Mobile Lab
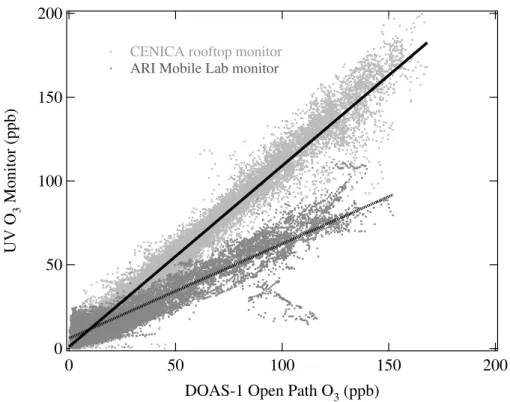
Comparisons of the data from the UV O3 monitor on board the ARI Mobile Lab with measurements from DOAS, FTIR and other UV O3monitors during stationary deploy-ments at all four co-located sites (Table 1b) revealed a degraded performance for this particular monitor. Figure 4 shows the linear regressions for the UV O3monitor on the
15
roof of the CENICA headquarters building and the monitor on board the ARI Mobile Lab versus the co-located DOAS-1 open path measurement. The UV O3monitor on board the ARI Mobile Lab displayed a negative bias at high ambient O3levels and a positive bias at low ambient O3levels. This pattern was observed at all four stationary sites in comparisons with both open path and point sampling O3measurements indicating that
20
the problem was definitely with the UV O3 monitor on board the ARI Mobile Lab. This behavior may be partially explained by calibration factor differences but was most likely due to a contaminated particle filter and/or scrubber for this particular monitor. For ex-ample, this pattern was consistent with a contaminated particulate filter destroying O3 at high ambient O3levels and releasing particles and/or some UV absorbing species at
25
low ambient O3levels. Contamination of this particular particle filter was not surprising given its use on board the ARI Mobile Lab where it directly sampled exhaust plumes from heavy traffic.
ACPD
6, 2241–2279, 2006 Evaluation of UV ozone monitors E. J. Dunlea et al. Title Page Abstract Introduction Conclusions References Tables Figures J I J I Back CloseFull Screen / Esc
Printer-friendly Version Interactive Discussion
EGU
Additionally, a negative interference was observed in the UV O3 monitor on board the ARI Mobile Lab during routine deliberate zero air purges of the main sampling inlet line, which were for calibration of other instruments sampling from the same inlet as the O3 monitor. Recent work has shown that this type of behavior is consistent with rapid relative humidity changes influencing the transmission of UV light within the detection
5
cell of the UV O3monitor (Wilson, 2005).
In summary, the performance of standard UV O3 monitors is dependent upon the performance of the particulate filter, which was definitely an issue during this study for the UV O3 monitor on board the ARI Mobile Lab. Overall, this particular monitor suf-fered from both the observed aerosol interference (Sect. 3.1) and from a contaminated
10
particulate filter and/or scrubber, such that data from this monitor was excluded from the earlier comparisons.
4 Conclusions
In this study, the performance of several UV O3monitors (US EPA Federal Equivalent Method) has been assessed based on data from a recent field campaign in Mexico
15
City. Two of these monitors were co-located with open path DOAS and FTIR measure-ments of O3. The O3 values determined by these UV monitors were systematically different from those determined by the open path instruments, with averaged discrep-ancies of up to 13%. If uniform span corrections are applied to these two sets of UV O3 monitor data, the agreement with the co-located open path instruments is within
20
5% with R2>0.89. Comparisons of two co-located open path DOAS O3measurements and co-located point sampling and open path CO measurements showed that this level of agreement was adequate for the comparison of a point sampling technique with an open path measurement. Titration of O3 by NO is shown to influence these compar-isons significantly only during morning rush hour when O3 levels were low and NOx
25
levels were at their highest. For these two comparisons at the CENICA and La Merced fixed sites, there was no evidence to suggest that the observed differences in measured
ACPD
6, 2241–2279, 2006 Evaluation of UV ozone monitors E. J. Dunlea et al. Title Page Abstract Introduction Conclusions References Tables Figures J I J I Back CloseFull Screen / Esc
Printer-friendly Version Interactive Discussion
EGU
O3 concentration were due to interferences affecting the reported O3 concentration of the UV O3monitors, but such a possibility was not ruled out.
A third UV O3monitor employed in this study displayed significant interferences from fresh diesel emissions attributed to fine particles (Dp<0.2 µm) passing through the
particulate filter and scattering and/or absorbing radiation within the detection cell. This
5
same monitor also produced biased measurements owing to a contaminated particle filter and/or scrubber.
As discussed in Sect. 3.2.2, the concentration of O3 was overestimated by the UV O3 monitor at CENICA and was underestimated by the UV monitor at La Merced. As mentioned, we used the regression slopes for the comparisons of the UV O3 monitors
10
with the open path spectroscopic instruments to determine a corrected calibration fac-tor for the UV monifac-tors. To assess the larger implications of these incorrect calibration factors, the number of violations of the US EPA’s O3 non-attainment thresholds was determined for the O3concentrations as measured by the UV O3monitors for 1-h and 8-h standards of 120 ppb and 85 ppb, respectively (Environmental Protection Agency,
15
2005; Reynolds et al., 2004); see Table 3. (Note that Mexican 1-h and 8-h standards are 110 ppb and 80 ppb, respectively.) Correcting the calibration factor in the UV moni-tors resulted in a slight decrease in the number of days with violations at CENICA, 10% for 1-h average and 5% for 8-h average, and a relatively large increase in the number of days with violations at La Merced, 61% for 1-h average and 72% for 8-h average. This
20
data was only from the MCMA-2003 campaign and thus represents a limited sample size and limited amount of seasonal variation. However, it is clear that this issue of correct calibration factors can have a major impact on the non-attainment status of a polluted urban area, falsely inflating or deflating the number of violations, potentially by very large amounts.
25
In summary, we conclude that UV O3 monitors, if accurately calibrated, have the potential to work well in a heavily polluted urban environment, but that there are signif-icant challenges associated with calibrating and operating these instruments properly. Regardless of new technologies that may become available, use of UV O3monitors in
ACPD
6, 2241–2279, 2006 Evaluation of UV ozone monitors E. J. Dunlea et al. Title Page Abstract Introduction Conclusions References Tables Figures J I J I Back CloseFull Screen / Esc
Printer-friendly Version Interactive Discussion
EGU
monitoring networks worldwide will undoubtedly continue for many years to come, and as such, several advances with respect to testing and operation of these instruments should be pursued:
1. Although interferences due to anomalous interactions of relative humidity with the scrubber were not observed in this study, a “wet” calibration procedure that
5
addresses possible interferences owing to varying relative humidity should be developed and new scrubber technology that completely avoids the possibility of these interferences should be pursued (Cavanagh and Verkouteren, 2001). 2. The significant interferences observed from ambient diesel particles mandates
that small pore size filters (0.2 µm or less) that are replaced frequently are
neces-10
sary for accuracy in urban areas.
3. Previously recommended calibration procedures involving frequent side-by-side comparisons with an O3 instrument that is maintained in good operating order, preferably employing a different measurement technique (Parrish and Fehsen-feld, 2000), should be adopted by routine users of UV O3 monitors in addition to
15
whatever calibration practices are currently employed.
4. Although this study was able to reach conclusions employing comparisons of the integrated O3concentration over a long light path with a point sampling measure-ment, spatial and temporal inhomogeneities necessarily limit the ultimate preci-sion of such comparisons. Future studies could avoid this limitation by comparing
20
UV O3 monitors side-by-side with point sampling spectroscopic instruments. Po-tential spectroscopic point sampling techniques include tunable infrared laser dif-ferential absorption spectroscopy (TILDAS), folded light path FTIR and folded light path UV-DOAS. We encourage future field studies that incorporate point sampling spectroscopic O3measurement techniques to operate co-located with a standard
25
UV O3monitor so as to more definitively evaluate the performance of this standard measurement technique.
ACPD
6, 2241–2279, 2006 Evaluation of UV ozone monitors E. J. Dunlea et al. Title Page Abstract Introduction Conclusions References Tables Figures J I J I Back CloseFull Screen / Esc
Printer-friendly Version Interactive Discussion
EGU
Acknowledgements. The authors would like to thank C. Pastor for creating Fig. 1; J.
Samuell-son, J. Mellqvist, B. Galle, J. Jayne, P. Mortimer, T. Onasch and D. Worsnop for sharing data; J. C. Wormhoudt, F. San Martini, L. Marr, B. Knighton and L. Earle for helpful discussions; and especially the CENICA staff for hosting the MCMA-2003 field campaign. M. Grutter would like to thank R. Basaldud and E. Flores for their support in the measurements at the Merced site, and
5
CONACYT (J33620-T) and MIT-CAM for the financial support. Financial support from Comi-sion Ambiental Metropolitana (Mexico), the National Science Foundation (ATM-308748) and the Department of Energy (Awards DE-FG02-05ER63980 and DE-FG02-05ER63982) is grate-fully acknowledged. R. M. Volkamer is a Dreyfus Postdoctoral Fellow.
References
10
Arshinov, M. Y., Belan, B. D., Krasnov, O. A., Kovalevskii, V. K., Pirogov, V. A., Plotnikov, A. P., Tolmachev, G. N., and Fofonov, A. V.: Comparison of ultraviolet and chemiluminescent ozonometers, Atmos. Oceanic Opt., 15, 8, 656–658, 2002.
ASTM: Standard Test Methods for Continuous Measurement of Ozone in Ambient, Workplace, and Indoor Atmospheres (Ultraviolet Absorption), Annual Book of ASTM Standards, Amer.
15
Soc. Testing and Materials Int., 2003.
Bass, A. M. and Paur, R. J.: UV Absorption Cross-Sections for Ozone – the Temperature-Dependence, J. Photochem., 17, 141–141, 1981.
Butcher, S. and Ruff, R. E.: Effect of Inlet Residence Time on Analysis of Atmospheric Nitrogen Oxides and Ozone, Anal. Chem., 43, 13, 1890, 1971.
20
Canagaratna, M. R., Jayne, J. T., Ghertner, A., Herndon, S. C., Shi, Q., Jimenez, J. L., Silva, P., Williams, P., Lanni, T., Drewnick, F., Demerjian, K. L., Kolb, C. E., and Worsnop, D. R.: Chase Studies of Particulate Emissions from in-use New York City Vehicles, Aerosol Sci. Technol., 38, 6, 555–573, 2004.
Cavanagh, R. R. and Verkouteren, R. M.: Improving the Scientific Basis for Informed
Deci-25
sions on Atmospheric Issues, NIST-NOAA-Industry Workshop on Atmospheric Measures and Standards, National Institute of Standards and Technology, 2001.
Chow, J. C.: Diesel Engines: Environmental Impact and Control – A Critical Review Introduc-tion, J. Air Waste Manag. Assoc., 51, 807–808, 2001.
de Foy, B. , Caetano, E., Magaa, V., Zitcuaro, A., Crdenas, B., Retama, A., Ramos, R., Molina,
ACPD
6, 2241–2279, 2006 Evaluation of UV ozone monitors E. J. Dunlea et al. Title Page Abstract Introduction Conclusions References Tables Figures J I J I Back CloseFull Screen / Esc
Printer-friendly Version Interactive Discussion
EGU L. T., and Molina, M. J.: Mexico City basin wind circulation during the MCMA-2003 field
campaign, Atmos. Chem. Phys., 5, 2267–2288, 2005.
Demerjian, K. L.: A review of national monitoring networks in North America, Atmos. Env., 34, 1861–1884, 2000.
Environmental Protection Agency, U.S.: Air Quality Criteria for Oxides of Nitrogen, Office of
5
Research and Development, 1993.
Environmental Protection Agency, U.S.: Quality Assurance Handbook for Air Pollution Measure-ment Systems; Volume II: Part 1; Ambient Air Quality Monitoring Program Quality System Development, Office of Air Quality Planning and Standards, http://www.epa.gov/ttn/amtic/ files/ambient/qaqc/redbook.pdf, 1998.
10
Environmental Protection Agency, U.S.: US EPA Audit of RAMA Network,http://www.sma.df. gob.mx/sma/download/archivos/auditoria epa ingles.pdf, 2003.
Environmental Protection Agency, U.S.:www.epa.gov, 2005.
Fayt, C. and van Roozendael, M.: WinDoas 2.1 Software User Manual, 2001.
Grosjean, D. and Harrison, J.: Response of Chemiluminescent NOx Analyzers and Ultraviolet
15
Ozone Analyzers to Organic Air Pollutants, Environ. Sci. Technol., 19, 9, 862, 1985.
Grutter, M. and Flores, E.: Air pollution monitoring with two optical remote sensing techniques in Mexico City, SPIE, Proceedings of SPIE, 2004.
Grutter, M., Flores, E., Basaldud, R., and Ruiz-Suarez, L. G.: Open-path FTIR spectroscopic studies of the trace gases over Mexico City, Atmospheric and Oceanic Optics, 16, 232–236,
20
2003.
Herndon, S. C., Shorter, J. H., Zahniser, M. S., Wormhoudt, J., Nelson, D. D., Demerjian, K. L. and Kolb, C. E.: Real-Time Measurements of SO2, H2CO and CH4Emissions from In-Use Curbside Passenger Buses in New York City Using a Chase Vehicle, Environ. Sci. Technol., 39, 7984–7990, 2005.
25
Hudgens, E. E., Kleindienst, T. E., MeElroy, F. F., and Ollison, W. M.: A Study of Interferences in Ozone UV and Chmiluminescence Monitors, Measurement of Toxic and Related Air Pollu-tants, Air Waste Manag. Assoc., 405, 1994.
Huntzicker, J. J. and Johnson, R. L.: Investigation of an Ambient Interference in the Mea-surement of Ozone by Ultraviolet Absorption Photometry, Environ. Sci. Technol., 13(11),
30
1414–1416, 1979.
Jayne, J. T., Leard, D. C., Zhang, X., Davidovits, P., Smith, K. A., Kolb, C. E., and Worsnop, D. R.: Development of an Aerosol Mass Spectrometer for Size and Composition Analysis of