Anomaly Detection Through Explanations
by
Leilani Hendrina Gilpin
B.S., University of California, San Diego (2011)
M.S., Stanford University (2013)
Submitted to the Department of Electrical Engineering and Computer
Science
in partial fulfillment of the requirements for the degree of
Doctor of Philosophy in Electrical Engineering and Computer Science
at the
MASSACHUSETTS INSTITUTE OF TECHNOLOGY
September 2020
© Massachusetts Institute of Technology 2020. All rights reserved.
Author . . . .
Department of Electrical Engineering and Computer Science
August 28, 2020
Certified by. . . .
Gerald Jay Sussman
Panasonic Professor of Electrical Engineering
Thesis Supervisor
Certified by. . . .
Lalana Kagal
Principal Research Scientist in CSAIL
Thesis Supervisor
Accepted by . . . .
Leslie A. Kolodziejski
Professor of Electrical Engineering and Computer Science
Chair, Department Committee on Graduate Students
Anomaly Detection Through Explanations
by
Leilani Hendrina Gilpin
Submitted to the Department of Electrical Engineering and Computer Science on August 28, 2020, in partial fulfillment of the
requirements for the degree of
Doctor of Philosophy in Electrical Engineering and Computer Science
Abstract
Under most conditions, complex machines are imperfect. When errors occur, as they inevitably will, these machines need to be able to (1) localize the error and (2) take appropriate action to mitigate the repercussions of a possible failure. My thesis con-tributes a system architecture that reconciles local errors and inconsistencies amongst parts. I represent a complex machine as a hierarchical model of introspective sub-systems working together towards a common goal. The subsub-systems communicate in a common symbolic language. In the process of this investigation, I constructed a set of reasonableness monitors to diagnose and explain local errors, and a system-wide architecture, Anomaly Detection through Explanations (ADE), which reconciles system-wide failures. The ADE architecture contributes an explanation synthesizer that produces an argument tree, which in turn can be backtracked and queried for support and counterfactual explanations. I have applied my results to explain incor-rect labels in semi-autonomous vehicle data. A series of test simulations show the accuracy and performance of this architecture based on real-world, anomalous driving scenarios. My work has opened up the new area of explanatory anomaly detection, towards a vision in which: complex machines will be articulate by design; dynamic, internal explanations will be part of the design criteria, and system-level explanations will be able to be challenged in an adversarial proceeding.
Thesis Supervisor: Gerald Jay Sussman
Title: Panasonic Professor of Electrical Engineering Thesis Supervisor: Lalana Kagal
Acknowledgments
“You can do it, only you can do it, you can’t do it alone.”
– Patrick Henry Winston
I would like to thank the many people who helped me to develop, shape, and write this dissertation.
I am indebted to my advisor, Gerald Jay Sussman, who taught me how to think slowly and clearly. Jerry reinvigorated my love of programming and organization (in Emacs, of course)! I am grateful to him for his guidance, support, tea, and direct feedback these many years. Although we will continue to learn together, I am humbled to have been a Sussman student.
Many of the implementation choices came from Lalana Kagal, the co-advisor of this thesis. Lalana provided the strategic ideas to shape this work into conference papers and reusable artifacts.
Patrick H. Winston taught me how to effectively communicate ideas. He showed me the power of a good demo. He provided me with encouragement and a research family: the Genesis group, a research community where everyone helped.
Jacob Andreas, Julie Shah, and Howard Shrobe were my dissertation committee members. They supported an idea composed of many parts, ideas, and disciplines. Thank you for the relentless encouragement throughout this process.
Many people shaped my academic journey before coming to MIT. I worked at Palo Alto Research Center (PARC), where I learned from from Juan (Julia) Liu, Johan de Kleer, and others in the Intelligent Systems Laboratory (ISL). Karianne Bergen and Qian Yang from the Stanford ICME 2011 cohort are lifelong colleagues and friends. The UCSD CSE tutor community sparked my interests in teaching and debugging, and provided me with a close-knit community.
I worked closely with collaborators in the Internet Policy Research Initiative (IPRI) at MIT CSAIL. Julius Adebayo, Sam DeLaughter, Natalie Lao, Mike Specter, and Jessica Van Brummelen read and edited early versions of this thesis. Ben Z. Yuan encouraged me to “make almost anything.” Cecilia Testart was my office mate,
coau-thor, and coffee companion. Cecilia is one of the women in the 2015 EECS cohort; a remarkable group of women with whom I shared weekly coffees and brunches. With that, I want to acknowledge the numerous coffee shops around the Kendall Square area, where I was a regular customer. Thank you for the caffeinated support.
I called MIT CSAIL home for five years, and I spent four of those years in Burton-Conner as a Graduate Student Advisor (GRA) on Burton 4. My role was to support undergraduate students, but the students ended up supporting me and giving me a sense of purpose. Another home was the MIT Rowing Club (MITRC), where I made some of my closest friends: Elise, Muriel, Ray, and Richard. Rowing on the Charles in the mornings was where I developed some of my best research ideas.
My family has relentlessly supported my academic pursuits. Thank you to Brian and Patty Gilpin, my parents who taught me how to be patient, thoughtful, and resilient. My younger brother, Cory Gilpin, the unofficial copy editor of this thesis, inspires me to be creative every day.
I moved across the country to pursue my doctorate, leaving a previous life in California. Graham Lockett and Alex Toschi visited Boston numerous times. Thank you for bringing California sunshine during the cold, winter months. My boyfriend, Răzvan Valentin Marinescu, exemplifies what it means to be a supportive partner. Thank you for being my reasonableness monitor in all things technical, and my anchor point in life.
And finally, thank you to the sources of funding for this work: Toyota Research Institute (TRI) and Sloan UCEM. Thank you for seeing the potential in me, this work, and its impact.
Contents
1 Introduction 21
1.1 Definitions . . . 25
1.2 Thesis Contributions . . . 25
1.2.1 Local Sanity Checks . . . 26
1.2.2 System-wide Communication . . . 26 1.2.3 Explanation Feedback . . . 26 1.3 Thesis Overview . . . 27 2 Background 29 2.1 Anomaly Detection . . . 29 2.1.1 Diagnostics . . . 30 2.1.2 Monitoring . . . 31
2.2 Knowledge Representation and Reasoning . . . 31
2.2.1 Frame-based Representations . . . 31
2.2.2 Ontology . . . 32
2.2.3 Commonsense Knowledge and Reasoning . . . 32
2.2.4 Reasoning . . . 32
2.2.5 Cognitive Architectures . . . 33
2.2.6 Theory of Mind . . . 33
2.3 Multi-agent Systems . . . 33
3 Ex post facto Explanations 35
3.1 Introduction . . . 36
3.1.1 Definition of Vehicle Specific Components . . . 36
3.2 Method Overview . . . 37
3.2.1 Data Generation and Analysis . . . 38
3.2.2 Qualitative Algebras . . . 42
3.2.3 Models . . . 42
3.2.4 Vehicle Modeling with the Propagator System . . . 43
3.2.5 Qualitative Mechanical Model . . . 45
3.2.6 Semi-quantitative Physics Model . . . 46
3.2.7 Reasoning . . . 47
3.3 Experiment Results . . . 47
3.3.1 Examples from the Mechanical Model . . . 48
3.3.2 Examples from the Physics Model . . . 49
3.4 Applying this Methodology . . . 51
3.5 Related Work . . . 51 3.6 Limitations . . . 52 3.7 Contributions . . . 53 4 Reasonableness Monitors 55 4.1 Introduction . . . 56 4.2 Method Overview . . . 56 4.2.1 Input Parsing . . . 57
4.2.2 Representation: Conceptual Primitives . . . 57
4.3 Adaptable Implementation . . . 62
4.3.1 Log Generation and Ontology . . . 62
4.3.2 Rule Input . . . 64
4.3.3 Reasoning and Explanations . . . 65
4.4 Evaluation . . . 66
4.4.2 User Study . . . 67
4.4.3 Example Explanations . . . 69
4.5 Applying Reasonableness Monitors . . . 70
4.6 Limitations . . . 70
4.7 Ongoing Work . . . 71
4.8 Related Work . . . 72
4.9 Contributions . . . 74
5 Interpreting Sensor Data 77 5.1 Introduction . . . 78
5.1.1 LiDAR Sensor Limitations . . . 79
5.2 LiDAR Sensor Overview . . . 80
5.2.1 Simulated LiDAR format . . . 80
5.2.2 LiDAR format in Collected Data Sets . . . 81
5.2.3 Related Work on LiDAR Processing . . . 83
5.3 Method . . . 86
5.3.1 Edge Detection for Object Detection . . . 86
5.3.2 Angle Estimation . . . 87
5.3.3 Object Tracking: Describing Movement . . . 90
5.3.4 Parking Rules . . . 90
5.4 Experiment Results . . . 92
5.4.1 Simulated LiDAR challenge scenarios . . . 92
5.4.2 Data Set LiDAR Challenge Results . . . 94
5.5 Applying Sensor Interpretation . . . 98
5.6 Limitations . . . 98
5.7 Contributions . . . 99
6 Learning from Explanations 101 6.1 Introduction . . . 102
6.2 Method . . . 103
6.2.2 Rule Learning . . . 104 6.2.3 RACECAR Architecture . . . 105 6.3 Experiments . . . 106 6.3.1 Experiment Design . . . 106 6.3.2 Experiment Results . . . 108 6.3.3 Challenges . . . 108
6.4 Applying Rule Learning . . . 111
6.5 Limitations . . . 111
6.6 Ongoing Work . . . 113
6.7 Contributions and Discussion . . . 113
7 System-wide Anomaly Detection 115 7.1 The Problem . . . 116
7.2 System Monitoring Architecture . . . 116
7.2.1 Inspiration from Human Committee Structures . . . 117
7.2.2 Generating Qualitative Descriptions . . . 119
7.2.3 Monitoring for Reasonableness within Each Subsystem . . . . 120
7.2.4 Reconcile Inconsistencies with a Synthesizer . . . 121
7.3 Explanation Synthesizer . . . 121
7.3.1 Priority Hierarchy . . . 122
7.3.2 Underlying Logic Language . . . 123
7.3.3 Abstract Rules . . . 124
7.4 Evaluation . . . 126
7.4.1 Simulation Setup . . . 127
7.4.2 Uber Accident Scenario . . . 127
7.4.3 Reasoning . . . 131
7.4.4 Adding Mistakes to Existing Data . . . 132
7.4.5 Evaluation of Inserted Errors . . . 133
7.5 Challenges and Benchmarks . . . 136
7.6 Requirements to Apply ADE . . . 137
7.7 Related Work . . . 138
7.8 Limitations . . . 138
7.9 Conclusion and Future Work . . . 139
8 Philosophy of Explanations: A Review with Recommendations 141 8.1 Background and Foundational Concepts . . . 142
8.1.1 What is an Explanation? . . . 142
8.1.2 Interpretability vs. Completeness . . . 143
8.1.3 Explainability of Deep Networks . . . 145
8.2 Review . . . 145
8.2.1 Explanations of Deep Network Processing . . . 145
8.2.2 Explanations of Deep Network Representations . . . 148
8.2.3 Explanation-Producing Systems . . . 150
8.3 Related Work . . . 153
8.3.1 Interpretability . . . 153
8.3.2 Explainable AI for HCI . . . 154
8.3.3 Explanations for Black-Box Models . . . 156
8.3.4 Explainability in Other Technical Domains . . . 157
8.3.5 Explanations for Society . . . 158
8.4 Taxonomy . . . 158
8.5 Evaluation . . . 160
8.5.1 Processing . . . 161
8.5.2 Representation . . . 162
8.5.3 Explanation-Producing . . . 162
8.6 Societal Expectations for Explanations . . . 163
8.6.1 Definitions . . . 164
8.6.2 Current Limitations . . . 165
8.7 A Big Problem: Opaque Perception Processes . . . 166
8.7.2 Imagining Possible Futures . . . 167
8.7.3 Commonsense Reasoning . . . 168
8.8 The Risk of Deploying Opaque Models . . . 169
8.9 Conclusions . . . 170
9 Contributions and Future Work 171 9.1 Explanations as a Debugging Language . . . 172
9.2 Future Applications . . . 173
9.2.1 Hybrid Approaches to Intelligent Systems . . . 174
9.2.2 Using Explanations as Internal Narrative . . . 174
9.2.3 Explanations for Society . . . 175
9.2.4 Security Applications . . . 175
9.3 Reevaluating Evaluations . . . 176
9.3.1 Tasks that Require Explanations . . . 176
9.3.2 Challenges for Imagining and Explaining Possible Futures . . 177
9.4 Implications . . . 179
9.5 A Salute . . . 180
A Auxiliary Information 183 A.1 Qualitative Algebras . . . 183
A.2 Conceptual Primitive Descriptions . . . 185
B Code 189 B.1 Vehicle Specific Artifacts . . . 189
B.2 Adaptable Code Artifacts . . . 192
B.2.1 Conceptual Dependency Parsing . . . 192
B.2.2 Commonsense Data Querying . . . 192
B.3 Interpreting LiDAR data . . . 195
B.4 Synthesizer . . . 196
B.5 Sample Results . . . 197
B.5.2 Parsing Examples . . . 197
C Data Samples 201
C.1 LiDAR Data . . . 201 C.2 Simulations . . . 210
List of Figures
3-1 Ex post facto explanation generation process . . . 38 3-2 A difficult driving scenario inspired by the off-ramp of Route 95 in
Massachusetts. The yellow star signifies the starting point, and blue arrows show the vehicle’s ideal trajectory. . . 39 3-3 A sample CAN bus data record. Each line has a time stamp, CAN
bus code, and parameter information. The mappings for the CAN bus codes are in Appendix B-1. . . 40 3-4 A diagram of the mechanical model that describes the interactions
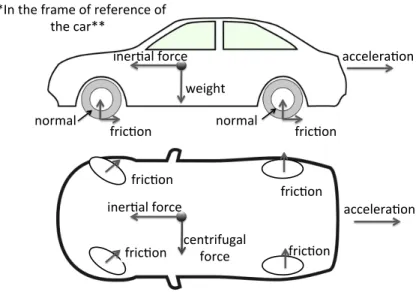
between the vehicle’s mechanical parts. . . 45 3-5 The forces that are calculated and used in the semi-quantitative physics
model. Shown from the lateral and top-down view. . . 46
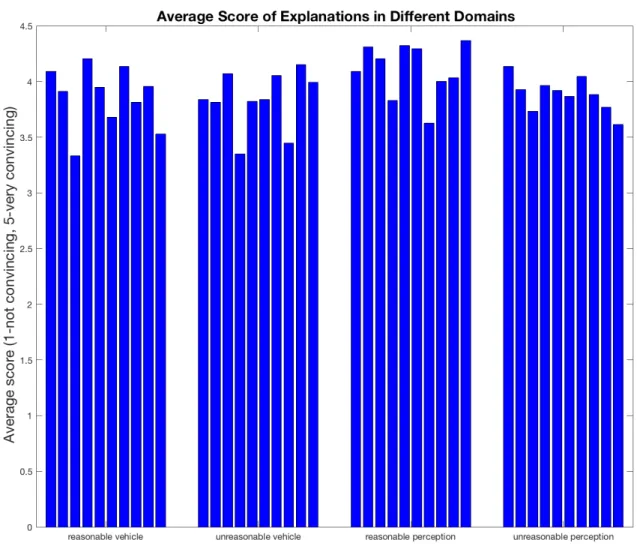
4-1 The system diagram schematic of a reasonableness monitor as an adapt-able framework. . . 63 4-2 Average rating of 40 explanations over 100 user trials. There are 4 sets
of explanations (from left to right): reasonable vehicle plans, sonable vehicle plans, reasonable perception descriptions, and unrea-sonable perception descriptions . . . 68
5-1 The 4th, 5th, and 8th beams of nuScenes LiDAR data for one sample. The 4th beam is in blue, the 5th beam is in green, and the 8th beam is in red. The 8th beam, seen in red, is hitting the ground. . . 82
5-2 The 1st, 10th, and 20th beams of nuScenes LiDAR data. The 1st beam is blue, the 10th beam is green and the 20th beam is red. The first and 10th beam are reflecting off parts of the vehicle. And the 20th beam is too scattered. . . 82 5-3 A top-down view of all the LiDAR beams. . . 84 5-4 A view of all the LiDAR beams on top of the front-facing camera image. 85 5-5 The geometric definitions for an object detected precisely in front. . . 88 5-6 The geometric definitions for a vehicle detected to the front and to
the side. The precise setup is shown on the left, and the estimated definitions are shown on the right. . . 89 5-7 Visual diagram for the variables for the parallel parking scenario. . . 91 5-8 Screenshots of the four stages of parallel parking from the Unity game
engine. . . 93 5-9 Various sensor outputs for a nuScenes scene snapshot. . . 94 5-10 The nuScenes metadata for an annotated object. . . 96 5-11 A visualization of a raw data and bounding box for a traffic cone behind
the vehicle. . . 96 5-12 A visualization of a raw data and bounding box for a pedestrian. . . . 97 5-13 A visualization of a raw data and bounding box for a vehicle. . . 97 5-14 LiDAR density between 2015 and 2020. . . 99
6-1 A flow diagram of the experiment design. The RACECAR system outputs a log file after a running through a specific sequence of cones. That log file is then processed by the rule learning system, which either creates a new rule for the existing monitoring system, or not In the case of a normal test run no rule is made. . . 107 6-2 A subset of a repeated error log. . . 109 6-3 The output of the rule learning system for the repeated error in Figure
6-2 that should be parsed into a new rule. The resulting rule text is appended to the rule file and updated in the monitoring system. . . . 110
6-4 The dynamic reasonableness monitoring architecture. . . 112 7-1 The ADE architecture model for a simplified self-driving vehicle. It
is composed of reasonableness monitors (dotted borders) around each subsystem and explanation synthesizer . . . 119 7-2 The conditions for passenger safety as a natural language abstract goal. 123 7-3 A screenshot of the Uber accident simulation (in segmentation mode)
on the Carla Platform. . . 128 7-4 The qualitative description outputs from my simulation of the Uber
accident in the ADE architecture. . . 129 7-5 The symbolic reasons that are used in the explanation synthesizer. . . 132 7-6 The “true” annotation of a pedestrian. . . 135 9-1 My vision for articulate machines that can coherently communicate to
each other and to a human. . . 172 9-2 A difficult driving scenario for a self-driving vehicle. . . 178 A-1 An example of qualitative addition for the qualitative direction algebra. 185 B-1 CAN bus mapping code for the vehicle simulation in Chapter 3 . . . 189 B-2 A subset of the edge detection rules for the “intervals of interest” in
Chapter 3. . . 190 B-3 A labeled data sample from NuScenes. . . 197 B-4 The parse tree for “A mailbox crossing the street.” . . . 197 B-5 The parse tree for a real image caption from “A man looks at his
cellphone while standing next to a motorcycle.” . . . 198 C-1 A sample of the simulated LiDAR data extracted from a simulated
vehicle log. This corresponds to a subset of a single snapshot (or point in time). . . 208 C-2 A screenshot of the Uber accident simulation (with similar lighting to
List of Tables
3.1 The complete set of the possible relationships among time intervals, as determined by James F. Allen [6]. . . 41
3.2 Summary of the “intervals of interest” accumulated during an over-steering skid. . . 42
4.1 The Conceptual Dependency (CD) “physical” primitives used, and the ConceptNet anchor points used to bind them to incoming verbs. . . . 59
4.2 List of ConceptNet anchor points used for actor and object roles in the CD transframe, and constraints on where a concept may reasonably serve in the role. . . 60
4.3 Comparison of explanation descriptions for the four types of expla-nations tested: reasonable vehicle plans, unreasonable vehicle plans, reasonable perception descriptions, and unreasonable perception de-scriptions. . . 69
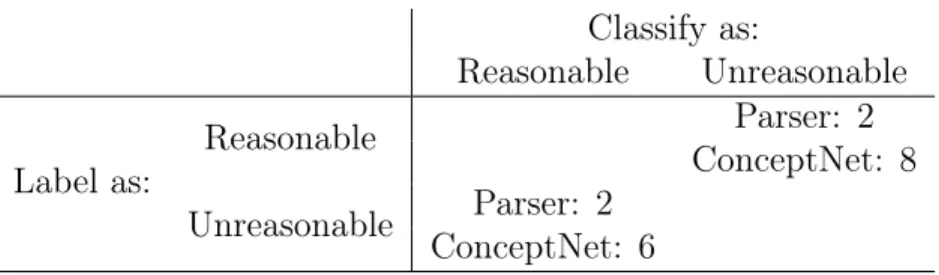
4.4 A analysis of the causes of the 18 misclassifications on the 100 test cases. 70
5.1 A raw data table of the LiDAR traces. The LiDAR unit starts at 0 azimuth degrees and emits 11 pulses at 0,-1, ...,-10 degrees elevation for every two azimuth degrees. . . 81
6.1 A table of the 15 distinct sequences that were tested on the RACE-CAR platform. The error logs had specified errors, which are deemed exceptions to the rule and so no new rules are made. Normal tests were explained to be reasonable, and so no new rules are made. Repeated errors are explained and so new rules are made, as expected. . . 106 7.1 A comparison of the ADE results on different synthesizer constraints.
The “no synthesizer” option signifies that all subsystem errors are re-ported. The “single subystem” option means that one subsystem is arbitrarily chosen to always be given preference. The “safety” con-straint is our default, where “threatening” objects are given a higher priority (to be classified as erroneous.) . . . 134 7.2 A comparison of the ADE system on regular and scrambled outputs.
The regular output is a summary supporting that the judgement or action is reasonable. The scrambled output (where a different label than the true label is used) shows that the architecture can correctly identify judgements or actions that are incorrect. . . 135 8.1 The classifications of explanation methods by the focus of the
expla-nation. . . 160 8.2 Strengths, benefits, and challenges of current DNN XAI systems . . . 165 C.1 A full, simulated Lidar trace. . . 201 C.2 A raw data table of a subset of the NuScenes LiDAR traces. . . 209
Chapter 1
Introduction
Complex machines, like all things, are imperfect. Testing and proving properties can harden these systems, but they are inadequate–it is impossible to test all failure modes. Consider a human crossing the street. It is considered “safe”, if you look both ways and do not detect an oncoming vehicle. But this protocol does not include the 6.25 × 10⁻⁷ chance of being struck by a local meteorite, asteroid, or comet impact1.
Instead of building provable test cases, my research is a complementary approach: I work on the methodologies and underlying technologies of monitoring architectures that can mitigate underlying system failures.
Society has built reasonably stable structures to minimize the occurrence and the consequences of bad human behavior. One such mechanism is a human organization: where each kind of work that is to be done is given to a committee of personnel who work together on said task. Another mechanism is the legal system. It enforces the minimal norms of the society, subject to a set of rules. The legal system in-vestigates reports of bad behavior after-the-fact, or ex post facto, and takes action to mitigate and to prevent the recurrence of that behavior through an investigation. This investigation is dependent on evidence: stories recounting the bad behavior and explanations from the alleged bad actor. Currently, complex machines do not have the ability to provide this sort of evidence (without substantial effort).
1In 2014, Professor Stephen A. Nelson calculated the lifetime odds of dying from a local
mete-orite, asteroid, or comet impact as 1 in 1,600,000: http://www.tulane.edu/~sanelson/Natural_ Disasters/impacts.htm
For complex machines to be robustly intelligent, they must keep internal reports of their behavior. I decompose a complex machine into an organization of subsystems working towards a common goal: an architecture, similar to human committees. The architecture is able to detect and reconcile local failures (within a committee), as well as inconsistencies amongst subsystems using explanations as a technical language. An explanation synthesizer produces an argument tree, which can in turn produce counterfactual explanations for an adversarial proceeding. The synthesizer depends on the underlying subsystem’s ability to tell its own coherent story about the reasons for its decisions or actions.
Some subsystems are so opaque (e.g., deep neural networks) that there may be no way to explain the subsystem’s behavior. Perception is an example. In self-driving cars, there may be a vision system interpreting images from an optical camera. Com-puter vision systems are susceptible to be fooled [170] and lack commonsense2. If a
vision system reports that it observes a mailbox walking across the street [79], that is clearly not possible. If it observes an elephant in the sky, that does not make sense. Labeling the same object as three very different things at the same time (e.g., a ve-hicle, an unknown object, a bicycle) is unreasonable3; that is a confused judgement
that should be discounted. To combat these types of nonsensical judgements, I devel-oped a reasonableness monitor [73], which supplements opaque decision making with rules, an ontology, and commonsense knowledge. With the addition of a reasoner, the reasonableness monitor produces a judgement of reasonableness and an explanation supporting that judgement. I present the technical details of this local commonsense sanity check in Chapter 4. I extended the end-to-end reasonableness monitor into an adaptable framework [78] that can impose sanity checks on all subsystems of a complex machine. This includes sensory LiDAR4, after applying a sensor interpreter,
which I present in Chapter 5.
2The “AI” in a self-driving vehicle mistakes woman on bus for jay-walking: https://slashdot.
org/story/18/11/26/0527259
3This labeling scenario actually happened in the Uber self-driving car accident in 2016 [180]. 4LiDAR is the commonly used acronym for Light Detection and Ranging. It is a sensor that uses
light from a pulsed laser to measure distance from the source point. The aggregated detections from several light pulses form a point cloud.
Complex machines also lack internal communication. When the underlying parts disagree, they cannot justify their behavior. In the Uber self-driving vehicle acci-dent5, an unresolved disagreement among parts lead to a pedestrian fatality [180].
In summary, the vision system perceived an oscillating label where the pedestrian was located, although the LiDAR system detected a moving object in that region. The mechanism for combining this information chose to ignore the object. Instead, I created a system-wide explanatory monitoring architecture, Anomaly Detection Through Explanations (ADE). The architecture consists of local reasonableness mon-itors around subsystems, constructed into a system hierarchy, similar to how human organizations are structured. An explanation synthesizer reconciles disagreements. In the Uber example, the synthesizer is able to validate the vision system’s detection of an object, while discounting the oscillating labels of that object, because they are inconsistent. The synthesizer constructs a reason why, by examining the explanations from the underlying subsystems that support the judgement. The ADE architecture is presented in Chapter 7.
Explainability under uncertainty, which can learn from explained failures in dy-namic situations, is an unexplored area. Explanatory artificial intelligence (XAI) has become a popular research agenda under the DARPA XAI program [88] and the EU’s GDPR on the “right to explanation” [84]. Although, it is not without criticism [193]: explanatory systems are all explaining different processes, lacking common evaluation metrics [76] and intervention mechanisms. Instead, the majority of explanatory tools are after-the-fact analysis tools, like the model-based, qualitative reasoning expla-nation generation method presented in Chapter 3. This approach is similar to the sensor-data interpreter in Chapter 5, in which raw sensor data is translated into a (mostly symbolic) list of descriptions.
I contribute a common language for reconciling system-wide failures. The pieces of a complex machine report their state at various levels of detail: the vision sub-system reports high-level labels, and the sensors output low-level log traces. By
5Uber self-driving car ignores objects:
https://www.theinformation.com/articles/ uber-finds-deadly-accident-likely-caused-by-software-set-to-ignore-objects-on-road
producing explanations of their behavior, the subsystems are able to speak the same language, argue amongst themselves, and use these explanations to support or chal-lenge high-level decisions. These monitoring pieces may have different conclusions; they may directly conflict and contradict each other. But since the monitors are con-stantly inspecting the behavior of their neighboring subsystems (and themselves), the explanations are dynamic. They can be augmented, changed, and challenged with alternative context, more evidence, and in different scenarios. For example, with various weather sensor information, the LiDAR monitor’s explanations can become stronger or weaker, since LiDAR is unreliable in rain, fog, or snow6. A formerly
strong LiDAR monitor explanation can be weakened by this information, encourag-ing the other sensors and subsystems to reevaluate their explanations. A series of test scenarios demonstrating this kind of dynamic behavior are in Section 7.5.
Some of the most compelling applications of this work include people: shared autonomy, social structures, government structures, and others, which are elaborated in Chapter 8. But whether humans are involved is irrelevant. My methodologies monitor every subsystems’ behavior, even if one or more of the subsystems is a human! I argue that the novel use of explanations is for the machine itself, which is a novel perspective compared to previous work [88]. My thesis enables complex ma-chines to reason about new scenarios, even if they have not seen that circumstance before. The current successes of autonomous vehicles are completely dependent on their ability to learn through (previously observed) experiences [243]. Instead, I model an autonomous vehicle as committees of introspective subsystems working together towards a common goal. This results in a self-explaining architecture, where au-tonomous vehicles can reason and explain the ever-growing, long tail of failures in real-world environments7.
6LiDAR is unreliable in certain weather conditions: https://www.draper.com/news-releases/
new-lidar-detector-enables-self-driving-cars-see-sun-rain-fog-and-snow
7Errors and failures are different kinds of bugs. The Hacker’s Dictionary defines a “bug” as “an
unwanted and unintended property of a program or piece of hardware, especially one that causes it to malfunction.” An error is a technical property. Most errors are harmless, such as an “undesirable” search query results, or a typo. A failure is an error with consequences. A failure occurs when there is a difference from the expected result. In self-driving cars, failures can be fatal. I work on explaining system-wide failures and detecting local errors.
1.1
Definitions
My dissertation contributes a local error detection monitor, and a system-wide failure detection architecture. The output of the monitor is a justification of unreasonable-ness, and the output of the architecture is an explanation. I define the following key terms to be consistent with the IEEE software engineering literature [100], using the running example of an off-by-one error8.
1. An error produces an incorrect internal state [100]. For example, an off-by-one error that changes a location outside of memory, where no one cares about that location, is just an error. I detect and justify local subsystem errors.
2. A failure is an “external, incorrect behavior with respect to the expected behav-ior (observed)” [100]. A failure has consequences. Consider an off-by-one error that clobbers a location whose value is essential to a safety-critical process–that is a failure. I detect and explain system-wide failures.
My thesis contributes methods that explain themselves and justify their behavior. 1. A justification is a description of whether something is right or reasonable (or
not). Reasonableness monitors (in Chapter 4) provide justifications supporting an unreasonable or reasonable judgement of an intended subsystem behavior. 2. An explanation is a justification that also describes the causes, context, and/or
consequences of an error, failure, or stable system state. An explanation answers “why questions” (see Section 8.1.1).
1.2
Thesis Contributions
I use symbolic internal subsystem representations, or explanations, to enable complex machines to introspect, reason, and reconcile their own failures. I contribute to
8An off-by-one error (OBOE, OBO, OB1 and OBOB) is a logic error in computer programming.
It typically occurs when an iterative loop iterates one too many or one too few times. It can also occur due to an incorrect inequality symbol (< instead of ≤ or > instead of ≥ and vice versa), or due to array indexing, in which the programmer mistakes that an array starts at 0 instead of 1 (and vice versa).
three technical aspects of an introspective system: local sanity checks, system-wide communication, and explanation feedback. While my dissertation focuses on the domain of self-driving cars, the methodologies are applicable to any complex machine that is composed of multiple parts.
1.2.1
Local Sanity Checks
Complex machines can fail in two distinct ways. One type of failure could be localized to a specific subsystem. Most local failures are due to flaws that a human would never make. In order to provide the individual subsystems of this complex machines with a last-pass “reasonableness” check, I developed a commonsense monitoring system: reasonableness monitors. Reasonableness monitors process the output of a (possibly opaque) subsystem and use a set of rules, ontology and commonsense knowledge leading to a judgement and justification of reasonableness.
1.2.2
System-wide Communication
The second type of complex machine failure is due to flawed communication amongst subsystems. There is limited internal communication in complex machines: the un-derlying subsystems perform tasks at different levels of abstraction, therefore report-ing their decisions, states, and world views in different forms of communication. To provide a common language for subsystem communication, I implemented a system architecture: Anomaly Detection Through Explanations (ADE), that can reconcile subsystem inconsistencies in a common explanation language. A series of test simu-lations show the accuracy and performance of this architecture based on simulated, anomalous driving scenarios.
1.2.3
Explanation Feedback
Explanations should make complex machines work better. I show how explanations can be fed back into a monitoring architecture to improve decision making with a “rule learning” prototype method. Test simulations on a real robot, in Section 6.3.2,
show that explanations can be used to explore new environments and learn reasonable behaviors.
1.3
Thesis Overview
Chapter 2 positions this thesis in the context of related research in the methodologies and underlying technologies related to anomaly detection, knowledge representation, explanation9, and introspection.
• Chapter 3 describes an ex post facto model-based reasoning methodology to explain and summarize vehicle logs post accident.
• Chapter 4 introduces reasonableness monitors: a local sanity check that sup-plements decisions with commonsense reasoning and rules.
• Chapter 5 describes a sensor interpreter to produce qualitative descriptions from LiDAR traces.
• Chapter 6 introduces an algorithm for incorporating feedback into an explana-tory monitor.
• Chapter 7 describes Anomaly Detection through Explanation (ADE): a system-wide architecture that can reconcile inconsistencies amongst subsystems. Chapter 8 reviews and defines the types of machine explanations that important to society. I also discuss the ethical implications of artificial intelligence, and argue that explanations can mitigate societal fears of intelligent machines. I conclude in Chapter 9 by reviewing the contributions of this dissertation, and proposing future research directions and applications.
9In Chapter 8, I exclusively review the eXplanatory artificial intelligence (XAI) literature,
Chapter 2
Background
“A lot can go wrong when we put blind faith in big data.”
– Cathy O’Neil
In this chapter, I provide a literature review of relevant work in anomaly detection, diagnostics, knowledge representation and reasoning, and multi-agent systems. I also review previous work on integrating perception and reasoning, which is a motivating application of my thesis work.
In subsequent chapters, I review the specific components of self-driving vehicles. I review research ideas from the philosophy literature in Chapter 8.
2.1
Anomaly Detection
Anomaly detection is a data mining process that finds rare or mysterious instances. It is used to identify fraud [143], intrusion [130], and event detection in sensor net-works [4]. In machine learning, when there is a large amount of training data available, these methods are either “supervised” (the training data has labels of anomalous or non-anomalous) or “unsupervised” (the training data does not have labels). The ma-jority of machine learning methods for anomaly detection are unsupervised, so that methods look for instances outside of the distribution and/or trends in the train-ing data. The most popular and successful of these unsupervised methods include
density-based techniques that detect outliers by clustering together similar points. This includes k-nearest neighbor [118, 139, 10], local methods [28, 202, 45], cluster-analysis detection [94, 34] and isolation forests [141, 142].
Similar approaches have been proposed for high-dimensional data [260], where there are so many dimensions of the data, that it may be unscalable to cluster (or group) similar data points together. When the data is too large or high-dimensional to process at once, some methods project the data onto a subspace [121, 108], or use tensor processing techniques [59], or interpret correlations [123]. Anomaly data may also be available as a graph, which leads to a multitude of graph-based techniques [5]. Other approaches detect anomalies by creating scores or formulas that can point to “atypical” data points or events. One score is an “interestingness” score [71], which is regardless of the kind of patterns being mined. More precise logic-based techniques can find anomalies that do not satisfy some predicate for typical behavior. In real-world environments (driving, robotics, network intrusion, etc.) the exact claims may not be precise. Therefore less precise, approximate reasoning like fuzzy logic [36] allows inference on less well-defined topics.
And if there is a multitude of data, processing power, and models available, en-semble techniques combine multiple models for better anomaly detection results [258, 259]. This includes feature bagging [131, 171] to find the features most correlated to fraud, or score normalization [122, 201].
2.1.1
Diagnostics
In model-based reasoning, anomaly detection is referred to as diagnostics. In diagnos-tics, it is assumed that there is little or no training data, and so finding errors aligns with detecting “symptoms” that align with an expert model. This is performed with either consistency-based diagnosis [188, 52] that finds diagnoses that are consistent with symptoms. Or detecting novel faults by suspending constraints [48, 70], which makes no presumption about faulty subsystem behavior.
2.1.2
Monitoring
In diagnostics, monitoring is used around plans (or goal states) and components to anticipate failures. In a multi-step execution plan, causal-link monitoring consistently checks rules and preconditions once the desired output is established for each step, where these causal links can be qualitative [51] and input back into qualitative reason-ing systems. If the monitorreason-ing system is examinreason-ing actions, then action monitorreason-ing can verify preconditions right before specific actions are executed, this is typically done in RosPlan [35].
Once a symptom is detected, a system may want to repair itself. These types of self-configuring [236] systems have a flexible representation that needs to uphold some consistent design choices and principles. A self-configuring system may focus on reconfiguring components modes [235], or have a meta-process that selects between program choices [114] .
2.2
Knowledge Representation and Reasoning
A goal of my work is to create self-explaining mechanisms that are flexible and adapt-able. This relies on using flexible representations of data, inspired by frame-based representation, a formal ontology to reason about high-level concepts, and various reasoning approaches that cater to multiple types of data. My research is focused on representations that cater to uncertainty.
2.2.1
Frame-based Representations
Frames [157] are a typically symbolic representation that enable a system to reason easily. Frames were derived from semantic networks [183], as a way to represent memories and knowledge, especially for language. This extended into representing language as these sorts of trans-frames or scripts [199], which reduced search space and memory. This type of representation relies on a structure in subsumption hierarchies like IsA [27] or a structured ontology.
2.2.2
Ontology
An ontology an organization of a concept (or domain) into relations: how differ-ent concepts are related to the target concept. An ontology is a specification of a shared conceptualization. Domain ontologies are specific to an application or domain, whereas “upper” ontologies are domain-independent, more prevalent for the seman-tic web [22] including the Web Ontology Language (OWL) [13], Friend of a Friend (FOAF) [29], and Yago [216]. Some upper ontologies are the basis for commonsense knowledge bases [57, 155].
2.2.3
Commonsense Knowledge and Reasoning
Commonsense knowledge is difficult to define. In the simplest terms, common-sense knowledge consists of facts about the everyday world that are self-evident; for example “lemons are yellow” or “animals can move.” Commonsense knowledge bases [135, 212, 62] provide these sorts of intuitive statements. Whereas common-sense reasoning models the human process of using these statements to solve problems, like the Winograd Schema challenge [137]. Other more formal approaches [163] use “event calculus” to reduce commonsense reasoning to first-order logic approaches.
2.2.4
Reasoning
In addition to commonsense reasoning, other types of classical reasoning approaches cater well to finding anomalies. Hypothetical reasoning [98] is an extension of abduc-tive reasoning [175], in which a hypothetical is deemed plausible by verifying each of its logical consequences. Another approach to reasoning about uncertainties is to look at analogies [72]: an inductive reasoning process that examines similar concepts to understand new concepts. If we consider that humans understand new circumstances by examining stories, then story-understanding [240] can be applied to understand new scenarios in complex machines.
2.2.5
Cognitive Architectures
The types of mechanisms that I present in this thesis are complex cognitive architec-tures. Cognitive architectures, first coined by Allen Newell [167], aim to understand human intelligence by mimicking the human reasoning process in a computer model. An implementation of a cognitive architecture is SOAR [125], which is still prevalent today. Society of Mind [158] is a theoretical framework for a cognitive architecture, along with its successor, The Emotion Machine [160], which incorporates ideas from theory of mind.
2.2.6
Theory of Mind
Theory of mind, or using insights from one’s thought-processes to understand that of others is an important theory for anticipating behavior [7]. This is especially important to anticipate complex situations [117], which are prevalent in the self-driving vehicle domain.
2.3
Multi-agent Systems
Multi-agent systems [218] are a complex system, which are composed of multiple in-teractive agents. This is similar to my organizational approach of a complex system as being made of multiple subsystems that interact via explanations. Another vari-ant of multi-agent systems is modeling collective behavior [232], where the observed environment is used to construct rules for a decentralized system of robots.
2.4
Integrating Perception and Reasoning
The integration of perception, recognition, and higher reasoning capability is a hall-mark of human intelligence modeling–from Gestalt psychology [153] and early ma-chine vision systems [190, 228] to cutting-edge standardized models of human cogni-tion [124]. Human cognicogni-tion integrates percepcogni-tion and “pure” object recognicogni-tion with
reasoning and symbolic manipulation. Humans are able to process sensory inputs both “top-down” and “bottom-up”1
Some cognitive theories emphasize the influence of symbolic processes on per-ception. Scientific evidence supports the view that normal perceptual experiences may rely more on knowledge than modes of sensation [226]. Winston’s [239] “in-ner” language hypothesis says that humans construct complex symbolic descriptions of situations, knowledge, and events; enabling humans to understand the world and problem solve2. The development of reasonableness monitors is devoted to
integrat-ing subsystems that represent the “inner”, physical, non-lintegrat-inguistic representation and reasoning domains of mental models [103] and imagery [176] that are theorized to be distinct from humans’ “outer” language of familiar lexical items and linguistic forms.
1A top-down processing approaches starts from the general and moves to the specific. A
bottom-up processing approach starts from the specific and moves to the general.
2The strong story hypothesis inspired the idea of “story-enabled intelligence”: systems that can
Chapter 3
Ex post facto Explanations
“...an adequate account that tells us all we want to know about explanations in general must wait until prior problems have been solved.”
– Sylvain Bromberger in On What We Know We Don’t Know [30].
When autonomous systems malfunction, different stakeholders require a diagnosis of the failures that led to the malfunction. For example, when autonomous vehicles get into fatal accidents, as in the Uber self-driving car accident1, it is important to
diagnose why the malfunction occurred quickly and precisely. When an accident hap-pens in a car that is co-driven by a person and a machine, police officials, insurance companies, and the people who are harmed will want to know who or what is ac-countable for the accident. In this chapter, I present a methodology to analyze and understand vehicle logs after-the-fact.
I present two model-based reasoning systems, which are initialized with measured data from a simulation environment. The qualitative mechanical model diagnoses spe-cific mechanical component failures. The semi-qualitative physics model diagnoses unusual physical forces on the vehicle, which can lead to erratic driving behavior. The models are able to abstract information from data to produce concise and under-standable explanations of vehicle actions–a summary that is simple enough for users
1A self-driving Uber test vehicle struck and killed a pedestrian in March 2018 [151]. For more
cases, refer to this dynamic list of self-driving vehicle fatalities: https://en.wikipedia.org/wiki/ List_of_self-driving_car_fatalities
to understand. This chapter was previously published as a conference proceeding [75].
3.1
Introduction
Modern automobiles are highly sophisticated, complex, and interconnected electro-mechanical systems. However, the existing tools for signaling errors are imprecise. For example, the “check engine” light indicates the plausible existence of problems without providing any justification.
As society moves towards semi-autonomous and, ultimately, fully autonomous ve-hicles, there is a need for vehicles to be capable of producing explanations of their behavior and internal state. These explanations will help in performing maintenance, analyzing driver behavior, and determining accountability for problematic actions. With the addition of sensors and software, pinpointing problems–even simple ones like low tire pressure, becomes difficult; due to the increased range of potential causes. In semi-autonomous driving, understanding the relative contributions of humans and/or mechanisms to an unwanted event, like a car accident, will be important for failure analysis and determination of accountability. Creating the ability for an autonomous agent to provide a coherent explanation of its own behavior is an essential prereq-uisite to building the necessary trust and confidence in such agents. If autonomous agents cannot reason about their decisions, then they will not be able to correct themselves, especially when things go wrong. This chapter explores the development of a methodology for developing ex post facto, i.e., after-the-fact, explanations from vehicle logs.
3.1.1
Definition of Vehicle Specific Components
When I refer to “vehicle” logs, I am referring to a Controller Area Network (CAN bus) log. This internal network of the vehicle is decentralized: it allows Electronic Control Units (ECUs), the embedded controller of one or more of the electrical systems or subsystems in a vehicle, and devices to communicate their state amongst each other without a host computer. These communications are recorded on a CAN bus log,
which is mimicked in the simulated CAN bus log. For each ECU component, a “snapshot” is recorded at each time stamp. This includes the CAN bus code and “parameter information,” which varies between ECU components. For the braking ECU, it is binary: 0 (brakes not engaged) or 1 (brakes engaged). But for other ECUs, like drive mode or wheel speeds, the parameter information is a list. The difficulty is providing a common language to process these parameters into a meaningful, symbolic story.
Since the CAN bus logs record ECU data at various levels of detail, I processed and represented CAN bus data in terms of qualitative descriptions. These qualitative descriptions, e.g., inc (increasing) or dec (decreasing), are a description of the first derivative change. In Section 3.2.2, I define an extended definition of qualitative terms based on the qualitative algebras first proposed by Johan de Kleer [49]. I apply abduc-tive reasoning: I start from an observation or result to deduce the likely explanation for the observations, using a model of the vehicle system to find (mis)behaviors. My method provides understandable, symbolic, simulated vehicle log descriptions.
3.2
Method Overview
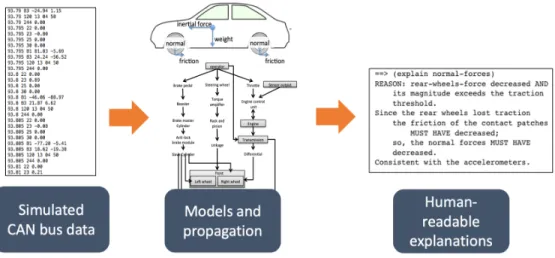
My system is a three-component process and methodology. The system is visualized in Figure 3-1.
1. Data processing produces “intervals of interest,” in Section 3.2.1.
2. Models describe the expected behavior of the underlying vehicle system, in Sec-tion 3.2.3. The models are initialized with “intervals of interest.”
3. Reasoning explains an “interval of interest” by running the models, and exam-ining the outputs and dependencies in Section 3.2.7.
I applied this methodology to a simulated vehicle. I show a series of test simula-tions that show the ability of the methodology to explain skids in Section 3.3. In the next sections, I review the technical specifications and artifacts.
Figure 3-1: Ex post facto explanation generation process
3.2.1
Data Generation and Analysis
My method relies on collecting data from a plausible vehicle simulation. My col-laborators and I developed a basic vehicle simulation using the Unity game engine [75]. The simulated vehicle has physical properties like tire friction and basic vehicle internals, at a level of fidelity sufficient to test my analysis pipeline.
Data Log Generation
The vehicle simulation, in response to user control of a simulated vehicle, produces data traces corresponding to quantities that are tracked by commonly installed vehicle sensors communicating on a typical vehicle CAN bus, like accelerometer data, wheel rotation rates, and driver input state. To generate the necessary data corresponding to an accident scenario, I built a model highway interchange in the simulation, and then drove the simulated vehicle in a variety of accident regimes. A mock up of this highway interchange is in Figure 3-2.
Figure 3-2 shows a car entering an oversteering skid on a freeway off-ramp. A skid occurs when the vehicle tires lose traction on the road surface. An oversteering skid occurs when the rear wheels of the vehicle lose traction but the front wheels do not. An oversteering skid can occur when brakes are applied during an otherwise controlled turn while the vehicle is moving at high velocity resulting in loss of friction
Figure 3-2: A difficult driving scenario inspired by the off-ramp of Route 95 in Mas-sachusetts. The yellow star signifies the starting point, and blue arrows show the vehicle’s ideal trajectory.
56.105 22 1.34 56.105 23 1.34 56.105 25 1.07 56.105 30 0.00 56.105 B1 9799.55 9848.86 56.105 B3 9848.39 9897.63 56.105 120 13 04 50 56.105 244 0.29 56.105 GroundTruthXYZ 4.37 5.05 45.25
Figure 3-3: A sample CAN bus data record. Each line has a time stamp, CAN bus code, and parameter information. The mappings for the CAN bus codes are in Appendix B-1.
on the rear wheels and in lateral motion of the rear of the vehicle. I performed 4 simulation runs to replicate the described event, gathering test traces to use for the developed analysis pipeline.
Data Log Format
The vehicle log data mimics a typical vehicle CAN bus format. There is a time stamp, a CAN bus code (corresponding to a vehicle specific module), and parameter information (which varies in length and format, depending on the CAN bus code). In the simulation, a CAN bus snapshot, with the 9 different CAN bus readings, is produced every .005 seconds2. I represent each CAN bus snapshot as a log-snapshot.
The CAN bus code mappings are in Appendix B-1. A sample of a CAN bus record is in Figure 3-3.
Log and Event Analysis
Each log-snapshot is indexed by the corresponding time. I filtered these log-snapshots into “intervals of interest” using edge detection and interval analysis. In pre-processing, the data is smoothed with an average pass filter.
Edge detection identifies specific intervals where edge events occurred. The edges are represented as rules: when the brakes were applied, or when the car accelerated.
2The simulation environment will generate up to 13 CAN bus codes when it is in “autonomous”
(define (isBraking? snapshot)
(eqv? (log-snapshot-brake snapshot) 0)) (define (isAccelerating? snapshot)
(eqv? (log-snapshot-accel snapshot) 'inc))
Listing 1: Braking and accelerating rules for edge detection. Note that braking is indicated by a 0 reading. The inc reading indicates that the reading has increased between the the last snapshot and the current snapshot.
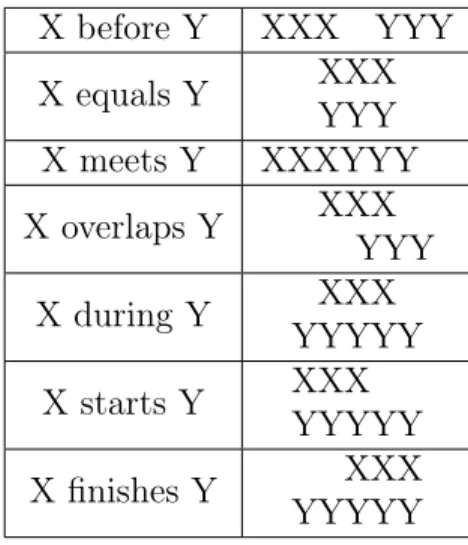
X before Y XXX YYY X equals Y XXXYYY X meets Y XXXYYY X overlaps Y XXXYYY X during Y YYYYYXXX X starts Y XXXYYYYY X finishes Y YYYYYXXX
Table 3.1: The complete set of the possible relationships among time intervals, as determined by James F. Allen [6].
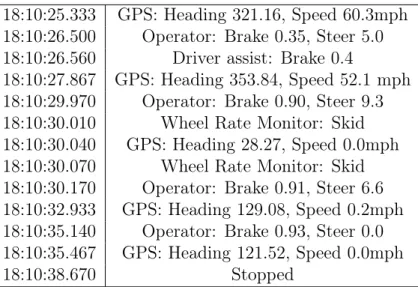
These specific edge examples are in Listing 1, and a comprehensive list of edge rules are in Appendix B-2. I filtered the data to find intervals that adhere to these edge detection rules over successive log-snapshots. This results in braking intervals, accelerating intervals, right turning intervals, etc. I filter the edge event intervals that satisfy the temporal relationship description of particular events. For example, once I have braking intervals, I want to find the intervals within that where the vehicle is turning, or where the vehicle came to a complete stop. I represented these events as a combination of intervals using Allen’s Interval Algebra [6] shown in Table 3.1 to find intervals that work together to make an “interval of interest.” An example is in Table 3.2. I use these intervals of interest as input to the models, which form a story of what happened during a particular time span.
18:10:25.333 GPS: Heading 321.16, Speed 60.3mph 18:10:26.500 Operator: Brake 0.35, Steer 5.0 18:10:26.560 Driver assist: Brake 0.4
18:10:27.867 GPS: Heading 353.84, Speed 52.1 mph 18:10:29.970 Operator: Brake 0.90, Steer 9.3 18:10:30.010 Wheel Rate Monitor: Skid 18:10:30.040 GPS: Heading 28.27, Speed 0.0mph 18:10:30.070 Wheel Rate Monitor: Skid 18:10:30.170 Operator: Brake 0.91, Steer 6.6 18:10:32.933 GPS: Heading 129.08, Speed 0.2mph 18:10:35.140 Operator: Brake 0.93, Steer 0.0 18:10:35.467 GPS: Heading 121.52, Speed 0.0mph 18:10:38.670 Stopped
Table 3.2: Summary of the “intervals of interest” accumulated during an over-steering skid.
3.2.2
Qualitative Algebras
I define a set of qualitative algebras3 to explain my vehicle scenarios. My first and
most used algebra, the qualitative increment, was first defined in de Kleer’s PhD the-sis [49]. However, in my vehicle models, I also needed qualitative actions: tightening and loosening, and descriptions of vector forces on the vehicles’ wheels. Therefore, I developed a set of four qualitative algebras to represent the descriptions of me-chanical components and force vectors: qualitative increment, action, direction, and magnitude. The algebras are described in Appendix A.1.
3.2.3
Models
I constructed two models, which combined with generated data, provide human-readable explanations of vehicle behavior. The fully qualitative mechanical model has implicit rules that describe the relationships among the mechanical components of the vehicle. For example, when the tire brake pads are engaged, what other mechanical components are affected? The code for these constraints is shown in Listing 2, which
3A qualitative algebra is a description of change with algebraic properties like addition,
subtrac-tion, multiplicasubtrac-tion, etc. It is usually used to represent continuous quantities of the world, such as space, time, and quantity with little “precise” information. For example, representing time with events: event a occurred “before” event b, event b occurred “after” event a, etc. These types of representations can support reasoning, even without precise details.
shows the causal properties of tire component of mechanical model. Consider that pressure is the pressure of air in the tire. The following are facts:
1. With low air tire pressure (or decreasing pressure), the axle is closer to the road: and the radius of rotation is reduced, causing the rotation rate to increase.
2. This was inspired by the idea that some cars have systems that warn you when your tire pressure is low. This works by measuring the rotation rate of the tires.
3. With under-pressured tires, the speedometer will display a value greater than your actual speed.
And these facts are expressed qualitatively in Listing 2, so that tire pressure is the inverse of the qualitative value of the rotation rate. This builds on other “common sense” facts: when the tire brake pads are engaged, the wheel rotation rate is certainly decreasing. However, if the wheel rotation rate is decreasing, that does not necessarily imply that the tire brake pads were engaged. The vehicle could be going uphill, or the vehicle could slowing down due to the force of friction on the tires.
To provide detailed explanations of why a particular event occurred, I developed a semi-quantitative physics-based model which quantitatively calculates forces on the vehicles wheels and combines that information with measured data to provide qualitative explanations. Both models are written in MIT/GNU Scheme and rely on the existing propagator system, described in Section 3.2.4.
3.2.4
Vehicle Modeling with the Propagator System
The Art of the Propagator System is a qualitative reasoning system that maintains dependencies that can be used to construct an explanation of how a command to the effectors or an intermediate value was determined. Part of those dependencies are causal chains that come from the expectations determined by the model, and some will be constraints coming from recorded data. The propagator system [184] can merge measurements with deductive reasoning and track dependencies. Propagators
(define (tire-object diameter-input pressure #!optional given-name) (physob (list diameter-input)
(lambda ()
(let-cells (rotation friction (diameter diameter-input)) (copier pressure friction)
(inverter pressure rotation) (define (insides-name message)
(case message ((diameter) diameter) ((pressure) pressure) ((rotation) rotation) ((friction) friction) (else #f))) insides-name)) (if (default-object? given-name)
`(,type ,(map name diameter-input))
given-name)))
Listing 2: Propagator code that shows the causal properties of a tire object. The tire pressure is the inverse of the qualitative value of the rotation rate.
implement a way to build distributed, concurrent computational models intercon-nected by shared cells. Each propagator continuously examines its neighbor cells adding information to some, based on deductions it can make from the information in others.
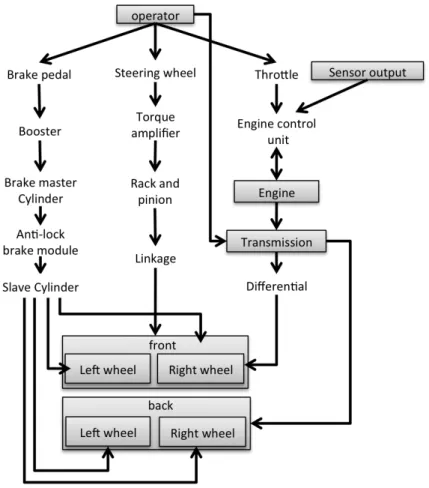
Consider, for example, the block diagram of the throttle control system in Figure 3-4. A qualitative model of this system can be made from this diagram. Each wire can be modeled by a propagator cell that holds information about the signals on that line. Each block in the diagram can be modeled by a propagator that constrains information contained in the cells that model the wires incident on it. Although the diagram indicates that information flows in specific directions, propagators can make deductions about inputs from information about outputs as well as in the indicated direction.
In any particular situation the models and the data will converge to some ap-proximate agreement if the models are good enough. There will be many points of agreement where the data will be what is expected and there may be points of
dis-Figure 3-4: A diagram of the mechanical model that describes the interactions be-tween the vehicle’s mechanical parts.
agreement. Points of disagreement indicate inadequacies of the models or failures of some part of the real mechanism to do what is expected of it.
3.2.5
Qualitative Mechanical Model
The qualitative mechanical model describes the interactions among the vehicle’s me-chanical parts. The meme-chanical components are modeled from the diagrams and descriptions in an automotive handbook [187]. Currently, the mechanical model is relatively simple, only modeling the braking system, steering system, and engine as shown in Figure 3-4. The sensor output is not yet implemented in my system. While my model is a simplification of real-life behavior of a car, its lower complexity enables intuitive explanations, which users can understand. Therefore, the rules of the system
fric>on fric>on normal normal weight iner>al force iner>al force centrifugal force **In the frame of reference of the car** accelera>on fric>on fric>on fric>on fric>on accelera>on
Figure 3-5: The forces that are calculated and used in the semi-quantitative physics model. Shown from the lateral and top-down view.
are intuitive, and the system does not require complex equation.
The mechanical model is initialized with a specific time interval, where each data value (e.g., brake pad pressure change, steering change, etc.) is a qualitative incre-ment, representing the qualitative change during that time span. The model is then run by propagating the data-initialized qualitative values through the system. Spe-cific model values can be queried using explain-readable and inquire-readable, described further in Section 3.2.7.
3.2.6
Semi-quantitative Physics Model
The physics model calculates forces on the vehicle’s wheels, and then constructs causal chains; some coming from expectations determined by the model, and some coming from recorded data. Unlike the mechanical model, which is initialized by recorded data, and then queried for values and explanations, the physics model is initialized by the log data, but also uses that log data values to provide evidence in its deductions. The forces that are calculated and then explained are shown in Figure 3-5. Recall, this model is a simplification, so that I can use rules of naive physics [92], without solving complex equations.
The models are used at the same time. Therefore, the physics model is especially important when the vehicle’s actions are unexpected and not interesting from the mechanical model standpoint. For example, if a skid occurs, the mechanical model will only be able to describe the wheel rotation rates in terms of qualitative increments, which does not provide the explanation for a skid. Instead, using the physics model, a skid can be identified by the rear or front wheels losing traction. The wheels lose traction by a decrease in normal force.
3.2.7
Reasoning
My system outputs readable explanations from the dependency tracking elements of the propagator system. Most of these explanations are rule-based: outputting a more readable version of an explain command, which is implemented in the propa-gator system. The propapropa-gator has two explanatory functions: inquire and explain. The inquire command displays the immediate values of the inquired cell, and the explain command recursively displays every dependency in that cell’s inquiry in the system. I implemented two other explanatory functions, inquire-readable and explain-readable, which display the dependencies tracked through the system in more readable language. For example, the inquire and explain display the cell’s de-pendent functions and values without explaining them, whereas inquire-readable and explain-readable explicitly cite the reasons, inputs, outputs, premises, and displays the cell value in readable form.
It is important to note the distinction between deductions and expectations. In my work, I deduce based on a casual chain of expectations. My assumptions are certain; I expect the mechanical devices within the car to act a certain way, and at the same time, I can expect the physics of the vehicle to act a certain way.
3.3
Experiment Results
The experiments displayed in this section, although not all inclusive, highlight the more “interesting” events that my system can detect and explain.
3.3.1
Examples from the Mechanical Model
The mechanical model propagates observed data through the different mechanical subsystems of the vehicle. The model is initialized by the observed data, and then those values are propagated through the system appropriately. Consequently, the user is able to query specific components of the system, and a readable explanation can be displayed through the appropriate command.
I provide two examples below from the same interval in a normal driving scenario where the vehicle is braking. During a braking interval, I expect that the anti-lock brakes are engaged (so that the hydraulic brake pressure is increasing and the wheel rotation rates are decreasing). In the first call to inquire-readable, I check the hydraulics on the antilock-brakes are increasing. The model also finds the premises, or root causes for this change: there is a braking change in that interval (from the method brake-change-from-initialized-interval)). In the second call, I examine the same interval and find that the wheel rates (specifically the left-front wheel) is decreas-ing. Further, the model is able to pinpoint why this change happened; by pointing to the specific interval event change: wheel-change-from-initialized-interval.
>> (inquire-readable
(hydraulic antilock-brakes))
(hydraulic antilock-brakes) has the value increasing change
Reason: function (+)
inputs: front-brakes-pressure
(booster antilock-brakes)
outputs: (hydraulic antilock-brakes)
Premises:
(brake-change-from-initialized-interval)
>> (inquire-readable left-front-wheel)
decreasing change Premises:
(wheel-change-from-initialized-interval)
From the model, I am able to query different internal mechanical devices, like the hydraulics, and I can also query the data directly, like the left-front-wheel rotation rate. Notice that the left-front-wheel has no inputs because it is a data input. The initialization, which I named to be wheel-change-from-initialized-interval, is the premise which tells the left-front-wheel to be exactly the value decreasing change. While this model is useful for debugging mechanical systems, it requires physics knowledge to be able to model complex vehicle behavior like skids.
3.3.2
Examples from the Physics Model
The physics model propagates the underlying forces on the wheel of an average front-wheel drive sedan. The model is initialized by the acceleration forces (both lateral and longitudinal) and calculates what is the appropriate magnitude of forces on the car’s wheels. The first example is of skid behavior. In this scenario, B.Z. Yuan and I simulated an oversteering skid [75], where I expect that the rear wheels of the vehicle lose traction but the front wheels do not.
(explain-readable-forces normal-forces)
REASON: rear-wheels-force decreased AND its magnitude exceeds the traction
threshold.
Since the rear wheels lost traction the friction of the contact patches MUST HAVE decreased;
so, the normal forces MUST HAVE decreased.
Consistent with the accelerometers.
The left front normal force decreased.
The right front normal force increased.
The left back normal force decreased.
The right back normal force decreased.
The above explanation was automatically generated by explaining the normal forces during an oversteering skid interval. The more detailed explanations are generated by aggregating quantities and qualitative reasons that are set after running the physics model.
(explain-readable-forces normal-forces)
REASON: right-wheels-force increased AND its magnitude is within traction threshold.
Since the right wheels are gaining traction
the friction of the contact patches MUST HAVE increased.
so the normal forces MUST HAVE increased
So the car is turning left safely.
Consistent with the steering and accelerometers.
QUALITATIVE TIRE SUMMARY:
The left front normal force decreased.
The right front normal force increased.
The left back normal force decreased.
The right back normal force increased.
The above explanation was automatically generated by explaining the normal forces during a left turn.