Supporting Information
Assessing size-dependent cytotoxicity of boron nitride nanotubes using a novel
cardiomyocyte AFM assay
Jerry Augustine†ab, Timothy Cheung†ab, Valerie Giesa, Jennifer Boughtonab, Maohui Chena, Zygmunt J. Jakubeka, Steven
Walkerc, Yadienka Martinez-Rubic, Benoit Simardc, Shan Zouad*
a.Metrology Research Centre, National Research Council Canada, 100 Sussex Drive, Ottawa, Ontario K1A 0R6, Canada, b.Department of Chemistry and Chemical Biology, McMaster University, 1280 Main St. W., Hamilton, Ontario L8S 4L8, Canada
c.Security and Disruptive Technologies Research Centre, National Research Council Canada, 100 Sussex Drive, Ottawa, Ontario K1A 0R6, Canada d.Department of Chemistry, Carleton University, 1125 Colonel By Drive, Ottawa, Ontario K1S 5B6
†These authors contributed equally
*Corresponding author: E-mail: shan.zou@nrc-cnrc.gc.ca.
Cardiomyocyte Videos
Video VS1: A representative small cluster of cardiomyocytes that has received no treatment. This cluster exhibits a healthy appearance, being both flat and transparent. It also beats regularly with a relatively consistent amplitude.
Video VS2: A representative cardiomyocyte after 24 h exposure to 50 μg/mL BNNT-1 in 0.001 wt% PEI. This cell has an unhealthy appearance, being shriveled, not see through and raised. A slow, irregular beating pattern can also be observed. The AFM tip and associated laser can be seen on the left side of the video.
BNNT cytotoxicity studies
Cytotoxicity of BNNTs is a point of contention in the literature, with many groups reporting conflicting results from each other. One of the main problems is a lack of thorough characterization of the material tested, making it difficult to determine whether factors such as size, coating and/or purity affect cytotoxicity. This illustrates the need for systematic studies and thorough characterization in order to determine the
cytotoxicity of BNNTs.
Electronic Supplementary Material (ESI) for Nanoscale Advances.
This journal is © The Royal Society of Chemistry 2019
Table S1: Cytotoxicity of BNNTs on cultured cells and animals reported in the literature Physical
Coating NanotubeLength Toxicity Assay Cell Line MaximumIncubation
Time
Toxicity* (µg/mL) Ref.
Poly-ethylene
imine Not specified Trypan Blue,MTT SH-SY5Y 3 days Nontoxic up to 5 μg/mL (1) Pristine and
glyco-dendrimer coated
Length of up
to 10 μm Trypan Blue, Annexin V-FITC, PI
HEK 293,
CHO 4 days Nontoxic
*tested 0-100 µg/mL
(2)
Poly-L-lysine ~200 nm Trypan Blue, MTT, LIVE/DEAD® and Annexin V-FITC
C2C12 3 days Low toxicity < 10 μg/mL *tested 0-15 μg/mL (1) Glycol-chitosan ~200-600 nm MTT, WST-1, DNA Quantification (PicoGreen), LIVE/DEAD®, Apoptosis and ROS Detection
SH-SY5Y 2 days Nontoxic < 100 μg/mL
*tested 0-100 μg/mL (3) Pristine (Tween®80 as dispersing agent) ~10 μm MTT, Fluorometric DNA Assay (FMCA) A549, 3T3-L1, RAW 264.7 and HEK293
5 days Cell dependent toxicity *tested 0-20 μg/mL (4) 3- aminopropyl-triethoxysilane (APTES)
Not specified LIVE/DEAD®, WST-1, DNA Quantification
NIH-3T3 3 days Low toxicity < 100 μg/mL *tested 0-100 μg/mL
(5)
Transferrin Not specified WST-1, Amido Black
HUVECs 1 day Low toxicity < 100 μg/ mL *tested 0-100 μg/mL
(6)
Glycol-chitosan ~1 µm Amido Black, Trypan Blue HUVECs 3 days Low toxicity < 50 μg/mL *tested 0-100 μg/mL (7) Pristine (gum-arabic as a dispersing agent) ~1.5 µm WST-1, LIVE/DEAD®, Amido Black, ROS Detection, Annexin V-FITC/PI SH-SY5Y,
HUVECs 3 days Non-toxic <= 20 μg/mL *tested 0-100 μg/mL
(8)
Glycol -
chitosan 200 nm – 1 μm MTT, Neutral Red Uptake NIH-3T3, A549 2 days Cell dependent toxicity *tested 0-125 μg/mL
(9) Polydopamine
and Pristine N/A, mentioned aggregation of 4-6 μm bundles LIVE/DEAD®, Alamar Blue, DNA quantification (PicoGreen)
HOBs 3 days Nontoxic
*tested 0-30 μg/mL (10) Pectin ~1 μm (from size distribution WST-1, DNA quantification, ROS, Annexin
Cor.At Cardiomyocyte Culture and Data Analysis Additional information
Cor.At iPSCs were thawed and plated onto sterile glass 35 × 10 mm dishes (Electron Microscopy Sciences, Hatfield, PA, USA). Fibronectin bovine solution (F1141, Sigma-Aldrich, USA) was diluted to 10 μg/mL using 1X PBS and 40 μL was used to coat the centre of each dish for at least 3 hours in an incubator at 37°C. Cor.At cells (nCardia, Germany) were thawed from liquid nitrogen, the freezing medium was removed and the cells resuspended using Cor.At Complete Culture Medium (nCardia, Germany) to a concentration of 4.0x10⁵
cells/mL. Fibronectin was aspirated from the dishes and 50 μL cell solution was seeded onto each dish. Cells were allowed to seed in an incubator at 37°C with 5% CO2 and 95% relative humidity overnight. After
seeding, dead cells were washed away using 1X PBS and cells were maintained in 1.5 mL medium per dish, exchanging medium every 2 - 3 days for up to 14 days. Spontaneous beating was observed as soon as 1 day after seeding. Cells were maintained in the dish and AFM measurements were taken directly in the dish using the JPK software’s Real Time Scan function.
During AFM measurements, the cells were maintained at (36 to 37) °C using a Peltier heating/cooling device, measured periodically using a thermocouple thermometer. When a desired cell was found using the
inverted optical microscope, the glass surface was approached. The tip was then retracted 30 μm, then lowered onto the desired cells in steps of 2 μm until beating was observed on the real time scan, at which point the tip was lowered 0.5 μm at a time to achieve a satisfactory measured amplitude (usually between 0.2 and 0.6 V). The tip was kept on the cell with no external force for one to two minutes while a time trace is being recorded. All measurements were taken within 45 minutes of removing the dish from the incubator. Beat intervals were defined as the time between consecutive peaks in the AFM trace, and were extracted by Igor Pro 6.36 (Wavemetrics, USA) using in-house code. When irregular beating patterns were measured, some peaks would occasionally not be detected by the code, leading to abnormally long beat intervals; these intervals were manually removed from the data set before analysis. Average beat frequency and standard deviation were calculated in Microsoft Excel (Microsoft, USA). In the subjective categorization of cell health, a healthy appearance was defined as having a flat, transparent morphology. A healthy beating pattern was defined as having a relative standard deviation of beat frequency of less than 15%, while also having a consistent amplitude. In general, 5 - 10 cells per dish were measured for a total of 15-40 cells per treatment.
Cell Viability Measurement Protocol
The WST-8 and MTS assays were performed in clear, 96-well, flat bottom plates. Cells were seeded to a density of (0.7-2.5 × 10⁴) cells/well, depending on the cell line. Cells were treated with 0 to 50 µg/mL of the
PEI-coated BNNT-1 solution, where 0 μg/mL represents a control of 0.001% PEI. For each concentration tested, a cell free control was prepared to account for the optical density of the material at the wavelengths being studied. To minimize the impact of the different rates of evaporation of the interior and exterior wells on the plate, the outer wells were not used to collect data points. After incubating the plates for 24 h in a humidified incubator at 37°C with 5% CO2 and 95% relative humidity, 10 μL of WST-8 reagent or 20 μL MTS
reagent (as provided by the manufacturer) was added to all wells. Following a further 4 h incubation period with the reagent, the plates were cooled to room temperature before measuring the optical density at 450 and 490 nm for WST-8 and MTS respectively using a FLUOstar Omega microplate reader (BMG Labtech, Canada). At least 2 plates with 6 wells each per concentration were tested for each material and cell line. To determine the percent viability of the cells, Equation S1 was used:
𝐸𝑞𝑢𝑎𝑡𝑖𝑜𝑛 𝑆1:% 𝑉𝑖𝑎𝑏𝑖𝑙𝑖𝑡𝑦 =𝑂𝐷𝑠𝑎𝑚𝑝𝑙𝑒(𝑛)‒ 𝑂𝐷𝑠𝑎𝑚𝑝𝑙𝑒 𝑏𝑙𝑎𝑛𝑘 (𝑛) 𝑂𝐷𝑐𝑜𝑛𝑡𝑟𝑜𝑙‒ 𝑂𝐷𝑐𝑜𝑛𝑡𝑟𝑜𝑙 𝑏𝑙𝑎𝑛𝑘
where ODsample(n) is the optical density of the wells containing cells exposed to BNNT-1 at a concentration of n
µg/mL, ODsample blank(n) is the optical density of the cell-free control with the same BNNT-1 concentration,
ODcontrol is the optical density of the sample containing the wells with cells exposed to just 0.001 wt% PEI, and
ODcontrol blank is the cell free control also containing just 0.001 wt% PEI.
The MTT assay was performed in a similar manner with the following modifications. After 24 h incubation with the nanomaterial, 10 μL of 10 mg/mL MTT solution in 1X PBS was added to all wells. After 4 h incubation, 80 µL cell media was removed from all wells and replaced with 100 µL DMSO to dissolve insoluble purple formazan crystals. The crystals were allowed to dissolve for 30 min at room temperature before reading the optical density at 540 nm. Viability was calculated using Equation S1.
PEI Toxicity
HepG2 cells were used to determine what concentration of branched 750K MW PEI would have a minimal impact on cell viability. Cells were exposed to 0, 0.001, 0.0015, 0.0025, and 0.005 wt% PEI for 24 h in a 37°C humidified 5% CO2 incubator. Cell viability was measured via the WST-8 assay, using the same protocol
previously described. The viabilities were calculated using Equation S1, with all viabilities relative to a Milli-Q water control. It was found that at a concentration of 0.001 wt%, the toxicity of PEI was negligible (Viability = 93%). Because this concentration did not affect cell viability, a concentration 10 fold higher was chosen to disperse BNNT-1 (when the dispersion is added to cell media, it undergoes a 10-fold dilution).
Figure S1: Cytotoxicity of 750K MW branched PEI on the HepG2 cell line using WST-8 assay.Cells were exposed to 0, 0.001, 0.0015, 0.0025, and 0.005 wt% PEI for 24 h in a 37°C humidified 5% CO2 incubator.
Afterwards, 10 μL of WST-8 was added to each well and the cells were incubated for up to 4 h before cooling to room temperature and reading optical density at 450 nm. Each data point represents the average of 2 trials, each containing 6 wells ± standard error. Cell viabilities are relative to a Milli-Q water control.
Effect of bath sonication time on BNNT-1 size
BNNT-1 was dispersed in 0.01 wt% PEI by bath sonication for 15 min at 45°C. Shorter sonication times were unable to break up all visible particles in the dispersion. The effect of longer sonication times on the size of BNNT-1 was also examined. When a 15 min bath sonication was used, the Z-average was 252.9 nm and the PDI was 0.248. For a 40 min bath sonication, the Z-average was 232.6 nm with a PDI of 0.218. The small decrease of 20.3 nm in the Z-average may indicate a decrease in the tube size. It could also be due to additional debundling of tubes or breaking up aggregates. To reduce the possibility of physically processing the tubes, only the shortest time capable of producing a homogenous dispersion was chosen for the current study.
BNNT-1 stability measurements via Turbiscan™ LAB Stability Analyzer
Turbiscan is a powerful technique commonly used to measure the stability of concentrated suspensions.(12) Turbiscan operates on the basis of multiple light scattering. A reading head composed of a near infrared light source and two detectors moves up and down a cell containing the solution at 40 µm intervals. The light source emits photons into the sample, which are scattered many times by the suspended particles. One detector
measures the transmittance through the sample while a second detector measures the amount of light that is backscattered by the sample at 135°. This angle was chosen to minimize the impact of photons being measured for transmittance. If a sample is stable, there should be minimal changes in these values over a 24 h time period. If, however, there is a significant change in the transmittance and backscattering profiles, information on the migration of the particles in solution can be obtained. For example, if there are significant local changes in the spectra at specific heights in the sample, this would be an indication of sedimentation or creaming, since the sample is no longer homogenous and the scattering of light is unequal at different heights. If the profiles have a consistent change across all heights of the sample, this typically indicates coalescence and flocculation, since the sample is still fairly homogeneous but the number of particles available to scatter the light decreases.(12)
Stability of PEI-Coated BNNT-1 in Cell Culture Media
In order to analyze the stability of suspensions used for cytotoxicity studies, a sample of 50 µg/mL PEI-coated BNNT-1 was prepared in phenol red-free DMEM supplemented with 9% FBS and 1X Penicillin-Streptomycin. Unlike Milli-Q water, cell culture media has many biological components, such as charged proteins and salts, which may influence the stability of the dispersion. Lower stability could falsely result in a lower measured toxicity due to reduced interaction of the material with the cells. The transmission of the sample was measured using the same protocol previously described. Due to the lower concentration of BNNT-1 in the suspension, the transmittance values obtained at heights between 1960 to 18920 µm were averaged and converted into absorbance values using Equation S2 to better monitor changes in the stability of the suspension. This height range was chosen as it excluded the meniscus and flat glass bottom of the vial. Backscattering was not analyzed since at a lower concentration, most of the backscattering will be due to the glass vial itself as opposed to the suspended particles. Since there was almost no change in the
absorbance value, it was concluded that the PEI-coated BNNT-1 was sufficiently stable in cell culture media to be used in cytotoxicity studies.
𝐸𝑞𝑢𝑎𝑡𝑖𝑜𝑛 𝑆2: 𝑅𝑒𝑙𝑎𝑡𝑖𝑣𝑒 𝐴𝑏𝑠𝑜𝑟𝑏𝑎𝑛𝑐𝑒 (𝑎.𝑢.)𝑡 = 𝑛 =2 ‒ 𝐿𝑜𝑔(% 𝑇𝑟𝑎𝑛𝑠𝑚𝑖𝑡𝑡𝑎𝑛𝑐𝑒𝑡 = 𝑛) 2 ‒ 𝐿𝑜𝑔(% 𝑇𝑟𝑎𝑛𝑠𝑚𝑖𝑡𝑡𝑎𝑛𝑐𝑒𝑡 = 0)
Figure S2: Stability of BNNT-1 dispersion in phenol red-free DMEM with 9% FBS and 1X
Penicillin-Streptomycin. The original 500 µg/mL BNNT-1 dispersion was diluted to 50 µg/mL using phenol red-free DMEM with 9% FBS and 1X Penicillin-Streptomycin for a total volume of 10 mL. The dispersion was briefly sonicated for 1 minute to homogenize the solution. The dispersion was equilibrated at 37°C for 30 min before being transferred to the Turbiscan™ LAB Stability Analyzer. The dispersion was then maintained at 37°C and scanned periodically over the span of 24 h to mimic conditions used for toxicity measurements. Transmission and backscattering profiles were obtained at 40 µm intervals along the vessel height during this time period. The data was taken from the average transmittance values from the vial height range of 1.96 to 18.92 mm and normalized relative to the absorbance at t = 0.
Length and height measurement protocol of BNNT-1 tubes
A brief purification procedure was used to remove impurities and improve image quality before imaging. Approximately 100 mg pristine BNNT-1 was washed multiple times with organic solvent before redispersing in 0.01 wt% PEI as described in the Experimental section of the main text. The PEI-coated BNNT-1 tubes were diluted from their original 0.5 mg/mL suspension to 0.2 mg/mL. They were then centrifuged for 1 hour at 1500 x g to remove any undispersed impurities. This speed was not observed to have any impact on tube morphology. Afterwards, 75 µL of the supernatant was spin-coated onto a freshly cleaved, 1 x 1 cm square mica substrate. The samples were spun at 500 rpm for 15 seconds followed by 2000 rpm for 1 minute.
The JPK instrument system was enclosed in an in-house fabricated acoustic isolation box and seated on a Micro 60 active vibration isolation table (Halcyonics/Accurion GmbH, Goettingen, Germany). AFM images were recorded in ambient using an intermittent contact mode with silicon probes (HQ:XSC11/AL BS, MicroMasch; typical radius 8 nm, 42 N/m spring constant, with a resonance
frequency of (300 to 350) kHz. For AFM imaging using MultiMode with QNM mode, the peak force with which a tip taps the sample surface was always kept at the lowest stable imaging level of around 400-500 pN. Silicon nitride ScanAsyst-Air AFM probes (Bruker AFM Probes, Camarillo, CA, USA) were used in all peak force feedback measurements. Their manufacturer-specified typical tip diameter and spring constants are 2 nm and 0.4 N/m, respectively.
Multiple 8 x 8 µm scale AFM images were collected and analysed from three independently prepared samples to yield approximately 300 individual tubes per sample. Images were processed using Gwyddion 2.51 (Czech Metrology Institute, Czech Republic) and DNA Trace software (LPMV, Switzerland). Images were flattened using a third-order polynomial fit. BNNT-1 length and height were measured using DNA Trace and Gwyddion software respectively. Only tubes between 1 - 7 nm tall were analysed as these heights were assumed to be the height of individual nanotubes. In addition, tubes that touched the edge of the image or were obscured by imaging artifacts were excluded from the analysis. The length was defined as the value obtained from a trace of the entire tube morphology using DNA Trace (Fig. S3A). Height was defined as the value of the vertical dimension over the background in Gwyddion. Multiple cross-sectional profiles were added onto the individual BNNT-1 tubes (Fig. S3B) to ensure that height was uniform across the tube. The height was then measured from the baseline to the peak of the profile (Fig. S3C).
Figure S3: Systematic AFM characterization of BNNT-1 tubes. A) Trace of entire tube created using DNA
Trace software to measure BNNT-1 length. B) Multiple perpendicular cross-sections were measured using Gwyddion software to ensure that BNNT-1 height was uniform across the length of the tube. C) Sample height profile generated from a BNNT-1 cross section. Height was measured from the baseline to the peak of
Representative AFM images and distributions of three independently prepared BNNT-1 samples
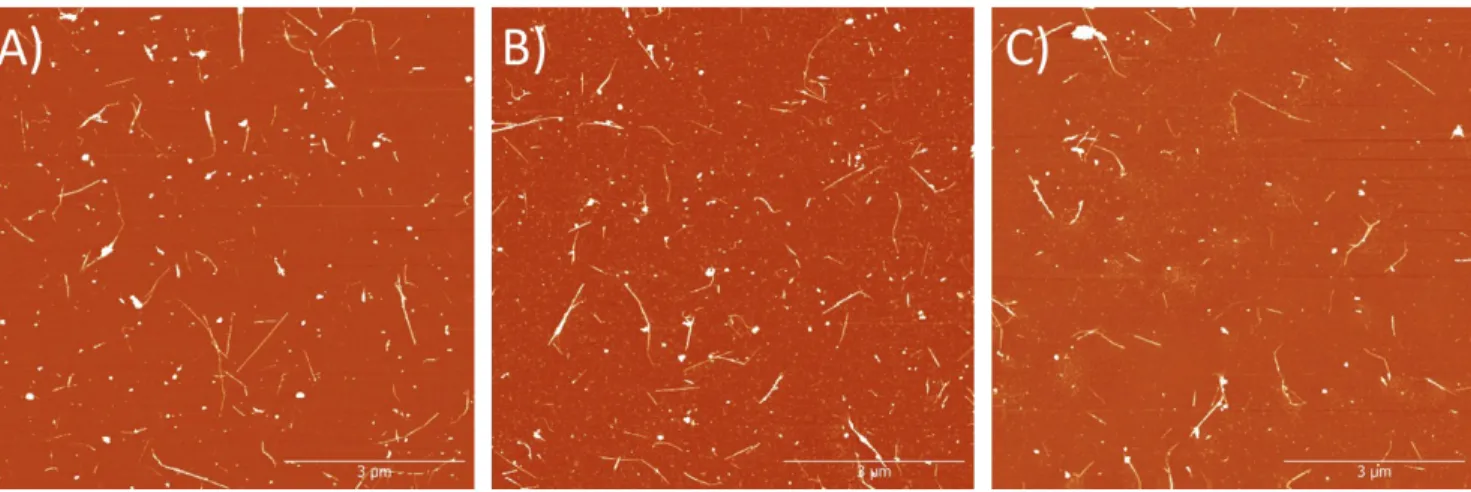
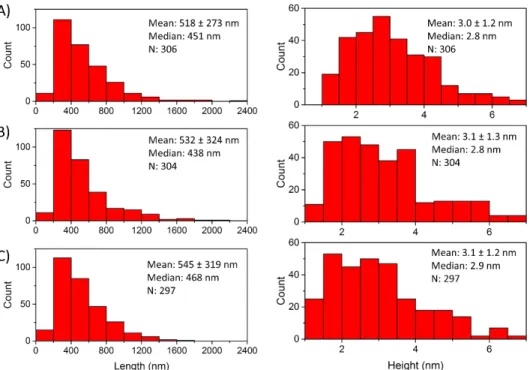
A systematic characterization was performed on approximately 300 tubes from 3 independently prepared BNNT-1 samples. The BNNT-1 samples were purified to improve imaging quality. Three independent samples were chosen to ensure reproducibility in the preparation of the PEI-coated BNNT-1 dispersions and to eliminate the possibility of sample bias (Fig. S4). Histograms of the lengths and heights were compiled for each of these samples (Fig. S5).
Figure S4: Representative AFM images from 3 independent samples of the purified PEI-coated BNNT-1 tubes.
A), B), and C) represent sample 1, 2, and 3 respectively. All samples were diluted to 0.2 mg/mL before spin coating onto a freshly cleaved mica substrate. Images were processed using Gwyddion software. All images are taken on an 8 x 8 µm scale and have a Z-scale of 15 nm.
Figure S5: Length and height distributions for the three independently prepared BNNT-1 samples. A), B), and
C) represent samples 1, 2, and 3 respectively.
Manipulation of BNNT-1 length via high energy probe sonication
BNNT-1 was probe sonicated at 10 W for different amounts of time, imparting varying amounts of energy to the sample. The samples were diluted to 2 μg/mL using Milli-Q water and evaluated by DLS (Table S2). When Z-average is plotted against sonication energy, an exponential shape can be observed (Fig. S6A). An exponential fit was applied using Origin’s Exponential fitting, and a relationship of 𝑑 = 189 + 57.5𝑒‒ 0.207𝐸 was calculated (R2 = 0.906), where d is the hydrodynamic diameter measured by DLS in nm and E is the
sonication energy in MJ/g. The length and height of s-BNNT-1 were measured by AFM, as shown in Fig. S6B. Length distributions with different sonication time were plotted in Fig. S6C.
Table S2: Summary of Z-average diameter of 2 μg/mL dispersions of BNNT-1 measured by DLS after probe
sonication with varying energies. Each Z-average is presented as the average of two samples ± standard error of the mean, each sample having been measured 5 times unless otherwise stated.
Figure S6: (A) Z-average diameter of BNNT-1 as a function of sonication energy. 0.5 mg/mL BNNT-1
dispersions were sonicated at 10 W for varying amounts of time. After diluting to 2 μg/mL, the equivalent sphere hydrodynamic diameter (Z-average) was measured by DLS. Each data point represents the average of 5 DLS measurements on a single sample ± one standard deviation. (B) 2D kernel density plot of s-BNNT-1 length and height measured using AFM height images. (C) Length distributions of BNNT-1 measured using AFM before sonication, at 14.4 MJ/g (1 h) and at 28.8 MJ/g (2 h) sonication energy.
A different PEI polymer with smaller molecular weight (25k) was tested. The dispersion was less stable than the 750k PEI modified BNNT-1, but showed similar length distributions (Fig. S7A and S7B). The length distributions of sonicated 1/25k PEI (14.4 MJ/g for 1 h) were comparable with the sonicated s-BNNT-1/750k PEI (Fig. S7C and S7D).
Sonication Energy (MJ/g) Z-average (nm) PDI
0 252.9 ± 3.9 0.248 ± 0.025 1.2 221.5 ± 7.6 0.234 ± 0.032 2.4 213.7 ± 7.0 0.261 ± 0.049 4.8 211.2 ± 3.1 0.268 ± 0.038 7.2 197.0 ± 3.6 0.260 ± 0.030 10.8 (n=1) 199.2 ± 5.6 0.288 ± 0.040 12.0 (n=1) 193.7 ± 0.8 0.236 ± 0.037 14.4 191.9 ± 5.2 0.228 ± 0.022 21.6 191.9 ± 3.7 0.263 ± 0.059 28.8 185.7 ± 1.8 0.258 ± 0.047
Figure S7: AFM height images and corresponding BNNT length distributions of (A) BNNT-1/750k PEI (B)
BNNT-1/25k PEI, (C) sonicated s-BNNT-1/750k PEI and (D) s-BNNT-1 25k PEI. Image sizes are 10 µm × 10 µm and Z-ranges are 20 nm for all images.
Suitability of MTT, WST-8 and MTS assays for BNNT-1 cytotoxicity testing
When three metabolic assays were used to assess the cytotoxicity of BNNT-1 on HepG2 cells, the WST-8 and MTS assays produced similar results while the MTT assay resulted in a significantly lower cell viability results at all concentrations (Fig. S8). This was attributed to insoluble MTT-formazan crystals being adsorbed to BNNT-1, resulting in their removal when the cell medium was changed and/or preventing them from fully solubilizing. Because of this interference, the MTT assay was not selected for use in further cytotoxicity tests. Although the MTS and WST-8 assay produced similar results, it was ultimately decided that the WST-8 assay would be used for all future cytotoxicity tests, due to its ease of use, high sensitivity and
Figure S8: An evaluation of the suitability of the MTT, WST-8, and MTS assays for testing the cytotoxicity of
BNNT-1. Three metabolic viability assays were used to test the viability of HepG2 cells when exposed to varying concentrations of BNNT-1 for 24+4 h. Each data point represents the average of 2 trials, each containing 6 wells ± standard error. Cell viabilities are relative to a 0.001 wt% PEI control (0 μg/mL BNNT).
Toxicity of 0.001% PEI on Cor.At cardiomyocytes
Figure S9: Toxicity of 0.001 wt% PEI on Cor.At cardiomyocytes. Cor.At cardiomyocytes were exposed to
0.001 wt% PEI (750k MW) for 24 h before measuring beating pattern using AFM. A) Cardiomyocytes were sorted into 3 categories of health based on visual appearance and beating pattern (see Results and Discussion). B) The standard deviation of beat frequency for each individual cell was plotted in a box and whisker plot, where the box represents the inter-quartile range. No treatment: n = 43; 0.001 wt% PEI: n = 37.
Cor.At cardiomyocytes were exposed to 0.001 wt% PEI for 24 h before measuring beating frequency using AFM. When compared to the control cells, the 0.001 wt% PEI treated cells dropped in Category 1 cells by 15
percentage points and all remaining cells were classified as Category 2 (Fig S9A). In addition, there were no significant changes with the standard deviation measure of beat irregularity between the two treatments (Fig. S9B). While PEI at this concentration had some cytotoxic effects as seen by the categorization of cells, it was decided that this amount of cytotoxicity was acceptable to continue with the BNNT cytotoxicity studies.
Beat frequency of individual cardiomyocytes
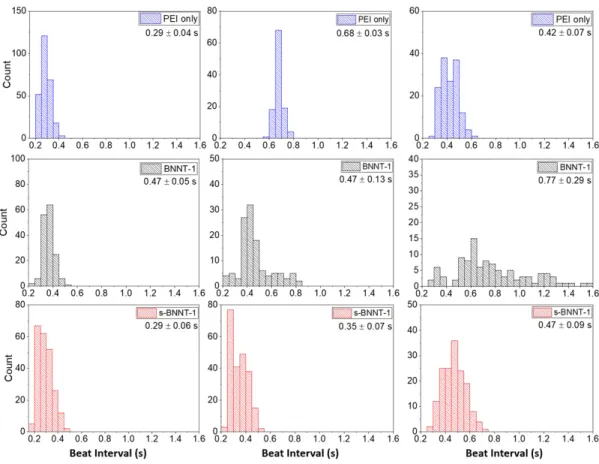
Figure S10: Multiple representative beating distributions of Cor.At cardiomyocytes after exposure different
materials. After 24 h exposure to 0.001 wt% 750k PEI (top row), 50 μg/mL BNNT-1/750k PEI (middle row), or 50 μg/mL s-BNNT-1/750k PEI (bottom row), beating pattern was measured by AFM and the time between each beat was extracted. The average beat interval ± one standard deviation is listed on the top-right of each distribution.
Figure S11: Standard deviations in beat frequency for individual cells treated with varying concentrations of
BNNTs and varying exposure times. A) Cells were exposed to 50 μg/mL BNNT-1 or s-BNNT-1 before measuring their beating patterns by AFM after 15 min, 2 h or 24 h. B) Cells were exposed to 5, 20, or 50 μg/mL BNNT-1 or s-BNNT-1 for 24 h before measuring beating patterns by AFM.
Figure S12: Beat intervals (A) and corresponding standard deviations (B) for individual cells treated with
BNNT-1 modified with 750k PEI and 25k PEI, with or without sonication.
Multiple representative beat distributions for individual after exposure to 50 μg/mL BNNT-1 or s-BNNT-1 for 24 h are displayed in Figs. S10 to S12. Fig. S10 showed beating interval distributions of multiple individual cardiomyocytes with different labeled treatments. In addition, standard deviations of beat frequency were plotted out in box plots as described in the Results section of the main text (Fig. 6) for each treatment tested
(Fig. S11). Cardiomyocytes treated with BNNT-1 had a greater propensity to have a wide distribution of beat intervals when compared to s-BNNT-1 and the PEI control (Fig. 7). When treated with 50 μg/mL BNNTs for differing time periods, 5% of cells treated with BNNT-1 had this wide distribution after 2 h and did 15% after 24 h (Fig. S11A). s-BNNT-1 treated cells never exhibited this wide distribution (Fig. S11A). It is evident that exposure time greatly affects the beating pattern, as seen in Fig. S11A, as significant outliers only appeared after 2 h BNNT-1 exposure, and a greater number after 24 h BNNT-1 exposure. None of these outliers appeared in the s-BNNT-1 treatments, indicating that BNNT-1 was more likely to affect beating pattern. This trend can also be seen when comparing different concentrations after 24 h exposure, though the effect is not as pronounced (Fig. S11B). Across all concentrations, BNNT-1 treated cells tended to have higher standard deviations than s-BNNT-1 cells, though this effect is most noticeable at 50 μg/mL. No significant difference of beating patterns was observed for 25k and 750k PEI modifications (Fig. S12) at different treatment conditions, respectively.
References
S1. Ciofani G, Raffa V, Menciassi A, Cuschieri A. Cytocompatibility, interactions, and uptake of
polyethyleneimine-coated boron nitride nanotubes by living cells: Confirmation of their potential for biomedical applications. Biotechnology and bioengineering. 2008;101(4):850-8.
S2. Chen X, Wu P, Rousseas M, Okawa D, Gartner Z, Zettl A, et al. Boron nitride nanotubes are noncytotoxic and can be functionalized for interaction with proteins and cells. Journal of the American Chemical Society. 2009;131(3):890-1.
S3. Ciofani G, Danti S, D’Alessandro D, Moscato S, Menciassi A. Assessing cytotoxicity of boron nitride nanotubes: interference with the MTT assay. Biochemical and biophysical research communications. 2010;394(2):405-11.
S4. Horvath L, Magrez A, Golberg D, Zhi C, Bando Y, Smajda R, et al. In vitro investigation of the cellular toxicity of boron nitride nanotubes. ACS nano. 2011;5(5):3800-10.
S5. Ciofani G, Genchi GG, Liakos I, Athanassiou A, Dinucci D, Chiellini F, et al. A simple approach to covalent functionalization of boron nitride nanotubes. Journal of colloid and interface science. 2012;374(1):308-14.
S6. Ciofani G, Del Turco S, Genchi GG, D’alessandro D, Basta G, Mattoli V. Transferrin-conjugated boron nitride nanotubes: protein grafting, characterization, and interaction with human endothelial cells. International journal of pharmaceutics. 2012;436(1-2):444-53.
S7. Del Turco S, Ciofani G, Cappello V, Gemmi M, Cervelli T, Saponaro C, et al. Cytocompatibility evaluation of glycol-chitosan coated boron nitride nanotubes in human endothelial cells. Colloids and Surfaces B: Biointerfaces. 2013;111:142-9.
S8. Ciofani G, Del Turco S, Rocca A, De Vito G, Cappello V, Yamaguchi M, et al. Cytocompatibility evaluation of gum Arabic-coated ultra-pure boron nitride nanotubes on human cells. Nanomedicine.
2014;9(6):773-88.
S9. Ferreira T, Hollanda L, Lancellotti M, de Sousa EB. Boron nitride nanotubes chemically functionalized with glycol chitosan for gene transfection in eukaryotic cell lines. Journal of Biomedical Materials
S10. Fernandez-Yague MA, Larrañaga A, Gladkovskaya O, Stanley A, Tadayyon G, Guo Y, et al. Effects of polydopamine functionalization on boron nitride nanotube dispersion and cytocompatibility. Bioconjugate chemistry. 2015;26(10):2025-37.
S11. Rocca A, Marino A, Del Turco S, Cappello V, Parlanti P, Pellegrino M, et al. Pectin-coated boron nitride nanotubes: In vitro cyto-/immune-compatibility on RAW 264.7 macrophages. Biochimica et Biophysica Acta (BBA)-General Subjects. 2016;1860(4):775-84.
S12. Mengual O, Meunier G, Cayré I, Puech K, Snabre P. TURBISCAN MA 2000: multiple light scattering measurement for concentrated emulsion and suspension instability analysis. Talanta. 1999;50(2):445-56.