MIT Sloan School of Management
MIT Sloan School Working Paper 4756-09
Approach and Preliminary Results for Early Growth Technology Analysis
© Blaine Ziegler, Ayse Kaya Firat, Stuart Madnick, Wei Lee Woon, Steven Camina, Clare Li, Erik Fogg
Blaine Ziegler, Ayse Kaya Firat, Stuart Madnick, Wei Lee Woon, Steven Camina, Clare Li, Erik Fogg
All rights reserved. Short sections of text, not to exceed two paragraphs, may be quoted without
explicit permission, provided that full credit including © notice is given to the source.
This paper also can be downloaded without charge from the
Social Science Research Network Electronic Paper Collection:
Approach and Preliminary Results for
Early Growth Technology Analysis
Blaine Ziegler
Ayse Kaya Firat
Stuart Madnick
Wei Lee Woon
Steven Camina
Clare Li
Erik Fogg
Working Paper CISL# 2009-09
September 2009
Composite Information Systems Laboratory (CISL)
Sloan School of Management, Room E53-320
Massachusetts Institute of Technology
Cambridge, MA 02142
Approach and Preliminary Results for
Early Growth Technology Analysis
Blaine Ziegler
Ayse Kaya Firat
Stuart Madnick
Wei Lee Woon
Steven Camina
Clare Li
Erik Fogg
15 September 2009
ABSTRACT
Even experts cannot be fully aware of all the promising developments in broad and
complex fields of technology, such as renewable energy. Fortunately, there exist many diverse
sources of information that report new technological developments, such as journal publications,
news stories, and blogs. However, the volume of data contained in these sources is enormous; it
would be difficult for a human to read and digest all of this information – especially in a timely
manner.
This paper describes a novel application of technology mining techniques to these diverse
information sources to study, visualize, and identify the evolution of promising new technologies
– a challenge we call “early growth technology analysis”. For the work reported herein, we use
as inputs information about millions of published documents contained in sources such as
SCIRCUS, Inspec, and Compendex.
We accomplish this analysis through the use of bibliometric analysis, consisting of three
key steps:
1. Extract related keywords (from keywords in articles)
2. Determine the annual occurrence frequencies of these keywords
3. Identify those exhibiting rapid growth, particularly if starting from a low base
To provide a focus for the experiments and subsequent discussions, a pilot study was
conducted in the area of “renewable energy,” though the techniques and methods developed are
neutral to the domain of study. Preliminary results and conclusions from the case study are
presented and are discussed in the context of the effectiveness of the proposed methodology.
1.
Introduction to the concept of Early Growth Technology Analysis
The goal of this project is to identify, using automated processes, potentially important technologies that have yet to become mainstream, referred to in this paper as “early growth” technologies. One way to view the growth of such technologies is in the form of plot of a technology’s “prevalence” over time. We are interested in those technologies that are in the early, low-prevalence tail of such a plot as depicted in Figure 1. This “early” phase is characterized by low prevalence, but a high rate of growth, such that the first and second derivatives of prevalence are both positive.
Figure 1. Prevalence of Early Stage Growth over Time
An immediate issue is the definition of “prevalence,” and more importantly, how to measure it. As publications in the academic literature are the primary channel for the dissemination of research results and ideas, we utilize the occurrence frequency of related keywords in these publications as an indicator of a prevalence of a technology over time. This approach falls under the broader category of “bibliometric analysis” [Kostoff et al, 2001][Losiewicz et al, 2000], a term used to describe techniques which are based on the statistics of text documents or publications, rather than the actual contents of these documents.
The analysis of technological trends and developments using such approaches has been attempted in a number of previous publications [Bengisu and Nekhili, 2006][Small, 06]. In fact, bibliometric techniques have already been used to analyze the renewable energy and other closely related domains [Vidican et al, 2008],[Kajikawa et al, 2008],[Woon et al, 2009], so its effectiveness in similar applications is already well established. Nevertheless, extracting information from large data sets, and converting this into actionable knowledge remains a challenging problem that is far from a comprehensive solution. The approach presented in this paper addresses a number of shortcomings in conventional approaches, such as the inability to identify promising growth areas (addressed with the early growth metrics, described in section 2.3), as well as effective procedures for extracting relevant terms from publication databases (addressed with the eigenvector centrality and “back-pointing” techniques, which is discussed in section 4).
Finally, while the proposed techniques are intended to be neutral to the domain of analysis, a suitable example is still required on which to conduct our experiments and to anchor our discussions. To address this need, a pilot study was conducted in the field of renewable energy, which offers a rich and
challenging problem domain on which our methods can be aptly tested. Besides high-profile topics like solar cells and nuclear energy, renewable energy related research is also being conducted in fields like molecular genetics and nanotechnology.
2.
Basic Methodology
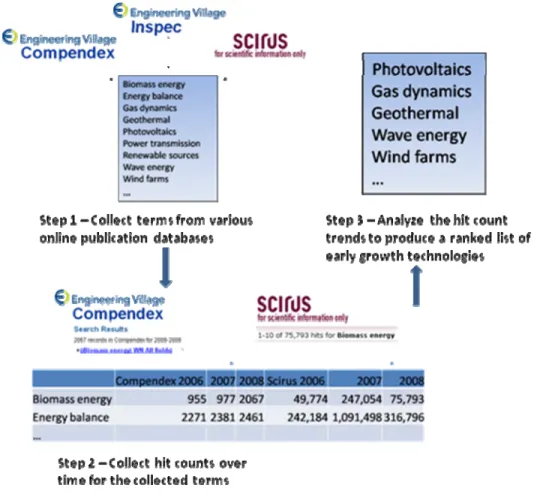
Our approach consists of three main steps. First, we collect and store large numbers of related terms. Next, we record the changes over time of term occurrence frequencies or “hit counts” by querying online publication databases for each of the collected terms. Third, by analyzing the growth pattern of these hit counts, we produce a list of technologies that appear to be in the early stages of growth. For future work, we plan to perform a second pass on this list with more rigorous, computationally intensive analysis to further reduce our list to a smaller number of important terms. Figure 2 below gives a high-level representation of the methodology and these three steps.
Figure 2. Three steps used in Methodology 2.1 Step 1 - Collection of relevant terms
To begin the search for these early growth technologies, we construct a long list of terms related to our topic of interest, renewable energy. At this stage, the focus is on gathering a large collection of topically relevant terms rather than on screening these terms for their growth potential. For the purpose of initial experimentation, we choose to use a few thousand terms.
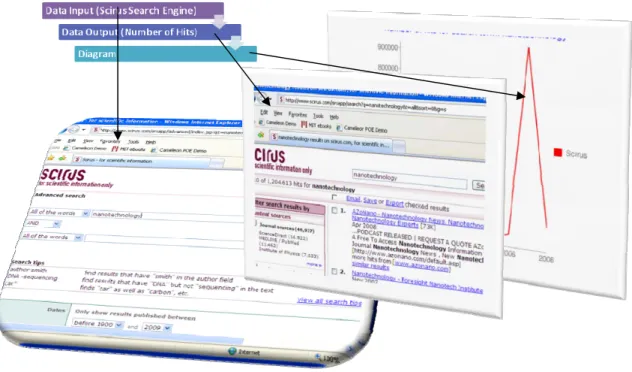
The key sources that we use are online publication databases (see Appendix 1 for descriptions and discussions on some of these sources). Examples include Compendex, Inspec, Scirus, and Google Scholar. It is important to note that these are web-based services, and as such we do not have direct access to the contents of these databases. Instead, our approach has been designed to utilize the results of two commonly supported search operations: “what papers do you know off which are related to topic X”, and “how many papers related to topic X were published in year Y”.
Figure 3. Illustration of Retrieving “hit count” from Scirus
As indicated previously, the aim is to construct this list of terms using completely automated processes. Specifically, we have developed a suite of software tools that can access these online databases to identify and extract relevant terms. The specific procedure for this automated term collection varies depending on the database being used; the collection procedures for three particularly useful sources - Compendex, Inspec and Scirus1 - are presented in this paper as an example of how this extraction process may be efficiently automated. Customization of the software for alternative sources of keywords is left as a topic for future work.
2.1.1 Term collection using Compendex and Inspec
Compendex and Inspec both fall under the umbrella website Engineering Village. We can use them to collect terms in the following way:
1. The Engineering Village search engine is queried to obtain articles about the topic of interest. A list of these articles are returned sorted by order of relevance (the precise definition of “relevance” is not provided but an informal survey of a the query results indicates that the sorting appears to match intuitive notions of relevance.)
2. For each article identified, a link is provided to its abstract along with a list of related keywords.
3. These keywords were provided by the respective authors and come in two varieties, namely controlled and uncontrolled. Controlled keywords were selected from a list of pre-defined terms determined by Engineering Village. Uncontrolled keywords, on the other hand, are entered by the author and are not restricted to the pre-defined list. We currently do not place different values on either set of keywords; instead, the controlled and uncontrolled terms are combined into a single list.
To use Compendex or Inspec to collect keywords, our system first queries the database for the topic, “renewable energy,” visits the abstracts of the most relevant articles, and collects all the keywords listed with each of these abstracts, removing duplicate terms. In keeping with the stated goal of collecting a few thousand terms, currently the 70 most relevant articles are used (the number of articles is a tunable parameter.) When using 70 articles, Compendex returns approximately 1,600 unique terms, while Inspec returns about 1,400.
2.1.2 Term collection using Scirus
Scirus is the third data source that is used for the purpose of collecting terms. Due to the nature of Scirus, the collection method is entirely different from that which used for Compendex and Inspec. Scirus does not provide keywords associated with the articles it returns. Instead, it provides a “Refine your search” feature for a given query, which displays a list of 80 related terms; as shown in Figure 4. In some cases, especially where the query is for a very peculiar keyword, the list may contain fewer than 80 terms. However, the list never contains more than 80 terms. Broadly, these terms appear to be sorted in the order of decreasing relevance or generality.
Figure 4. Example of “Refine your search” results provided by Scirus
We can extract these terms in an automated way using our software, but 80 terms is far short of our desired number of terms. To use Scirus to collect more terms, we go through several steps as follows.
1. We perform follow-up searches on some or all of the returned terms, and extract the terms related to those follow-up terms.
2. This process forms a tree of terms with “renewable energy” at the root, its related terms at the second level, and so on. If all 80 returned terms were expanded, the tree would grow in width very quickly before getting very deep.
3. Since our goal is to discover terms that are highly specific and not necessarily well-known, we would like our term tree to be deeper than it is wide. The depth/width tradeoff is left as an adjustable
parameter in our software. We specify this parameter as a list whose length is the number of levels in the tree, and whose elements represent the branching factor at each particular level of the tree. So for example, if our list were [20, 10, 5], we would expand the 20 most relevant terms at the first level in our search, the 10 most relevant terms to each term in the second level of our search, and the 5 most relevant terms in the third level of our search. We are currently using the pattern [15, 5], which, after removing duplicates, returns approximately 3,000 terms. We have used this pattern because it seems to provide a good balance between relevance and specificity, while also returning approximately the number of terms we are looking for. We have also experimented with three-level patterns, but have found that terms at the third level are often irrelevant. Section 4.1 of this report describes a proposed solution to this issue.
4. Note: Even when a term is not expanded for a follow-up search, it is still added to the list of terms being collected. So in our example, each of the 15 follow-up terms at the first level
returns not 5, but 80 terms of its own, all of which are added to the list. However, only the top 5 of these terms are further expanded to return 80 of their own.
Finally, we merge the terms collected from Compendex, Inspec, and Scirus into one list. After removing duplicates, our 1,600 Compendex terms, 1,400 Inspec terms, and 3,000 Scirus terms become
approximately 5,600 terms in total. It is notable that the three databases give us only approximately 400 duplicates, compared to 5,600 unique terms. It is due to this uniqueness of the three databases that motivated us to collect and combine terms from all of them. An open area of investigation involves deciding on the relative value of each database and the best number of terms to collect from each database. A tradeoff must be managed between the need to collect as many useful terms as possible, and the need, as far as is possible, to avoid contaminating the term list with irrelevant terms.
2.2 Step 2 - Determination of growth trends
In this step, we determine the prevalence trends, over time, of each of the terms collected in the previous step. As explained in the Section 1, it was decided that the “hit count”, i.e. the number of relevant articles returned by a publication database when queried with the terms, would be used to represent the
prevalence of a technology.
To determine the trends in hit counts, searches are restricted to only count the articles published in a given year. This is then repeated for each year which we are interested in, resulting in a record of how the number of articles published about the given topic has changed over time.
2.2.1 Maintaining relevance
In determining the hit counts for a particular term, it is important that only relevant uses of the particular term are taken into consideration. One way of doing this is by constraining the basic search by appending a term which specifies the desired context. As an example, the term ‘corn’ is relevant to energy
technologies for its role in ethanol production. A Scirus search for ‘corn’ returns approximately 2.1 million hits. A search for ‘corn’ + ‘renewable energy,’ on the other hand, returns only about 90,000 hits. The discrepancy is largely due to the vast number of articles about corn that have nothing to do with energy. For our purposes, 90,000 is the more accurate count.
However, there are two potential downsides to requiring that the seed term be included in our queries. The first issue is that a term may represent an important component of the field, but is rarely mentioned in articles that also mention the seed term. Examples include technologies that have a wide range of
applications, each of which can be indirectly related to our seed term. Genetic engineering is an example when renewable energy is the seed. Genetic engineering is an important component of biofuel
development, so new genetic engineering research can indirectly affect the renewable energy field, often in ways which are unforeseen a priori. We would therefore be interested in articles about genetic engineering research even if they make no explicit mention of renewable energy. Only considering articles that contain both terms genetic engineering and renewable energy would result in a lower hit count, which understates the actual number of relevant articles.
There is a second downside to including the seed term in our query. In some cases, a term may appear in an article that is indeed related to the seed term, but that never explicitly mentions the seed term because it is implicit from the context. An article about windmills, for example, is clearly relevant to renewable energy, but may never actually use the expression renewable energy. We would like this article to be included in the publication count for windmills, but requiring renewable energy to be included in the search query would prevent that from happening.
IRequiring the seed term in our search queries prevents artificially high hit counts that result from articles that use a term in an irrelevant context (e.g. corn). Unfortunately, requiring the seed term can produce an artificially low hit count by not including relevant articles that discuss the term, without discussing applications (e.g. genetic engineering) or by not including articles that do not mention the seed term because its relevance is obvious from context (e.g. windmills).
So an open question being investigated is whether or not to require that ‘renewable energy’ be included in our hit count queries.
2.2.2 Use of multiple sources
Just as we can use one or more sources to produce the list of potentially interesting keywords, we can use one or more databases in determining the hit count trends of a topic. It is also important to note that the source(s) that we use for trend analysis need not be the same as those used to produce the list terms in the previous step. These are two independent processes; we can collect terms with whatever sources we choose, and we can analyze their prevalence trends using whatever sources we choose.
In deciding what databases to use for hit count trends, we need to consider the size and focus of the database, as well as the feasibility of using it for automated hit count collection. In general, the larger the database’s collection of articles on renewable energy, the more statistically significant the hit count trends will be. Regarding feasibility, the database must allow thousands of queries to be submitted in a relatively short span of time, and must display the resulting hit counts in a manner that is extractable with software. With these considerations in mind, we are currently using Compendex and Scirus to gather hit count, as they tend to give relatively large hit counts even for obscure energy-related terms. In contrast, it was decided that Inspec, the third database used in the term collection step, is too small of a database to be effective in this hit count collection step.
With both Compendex and Scirus, collecting hit counts for each term is a slow process. For example, finding hit counts for 5,000 terms over three years, which requires 15,000 queries to the
databases, takes about 5 hours to complete. However, these numbers tend to remain relatively unchanged from trial to trial. We therefore cache (store) the results from one trial in a local database for
instantaneous lookup later. This can prove useful if, for example, we choose to modify our trend analysis methods (section 2.3 of this report), and do not wish to spend time re-gathering terms and hit counts prior to the analysis.
Because we are most interested in modern, upcoming technologies, we have focused on the years 2006, 2007, and 2008. For future work, we might extend these dates further into the past to get a better picture of the longer-term trends of these technologies, and to perform retrospective analyses to test the efficacy of the system.
2.3 Step 3 - Identification of potentially interesting terms by rate of growth
Using the hit count trends recorded in the previous step, we now seek to choose from that large initial list a subset of terms that seem to fit the early growth description. There are several possible ways to identify an early growth technology in terms of its hit count trend. We choose to rank each term according to the ratio of its final to its initial hit count. The approximately 100 top-ranked terms will then be used in the final step of our methodology, which is to perform more in-depth analysis on those terms. With this ranking method, we choose to ignore intermediate year (i.e., 2007) hit counts. In future developments, we
may use that information in our trend analysis as well2. The use of intermediate years’ hit counts may be particularly important if we use a longer timeline than 2006-2008.
By ranking terms according to the ratio of final hit count to initial hit count, terms with low initial hit counts will be strongly favored. For example, a term whose hit counts increased from 1 to 3 will be ranked higher than a term whose hit counts increased from 100,000 to 200,000 over the same time period. This is in line with our interest in identifying technologies that are not yet well-known, but are on the steepest part of their growth curve.
One problem encountered was what to do when the initial hit count is zero, which would result in division-by-zero errors. There are a few possible workarounds to this problem. One possibility is to replace the zero with the lowest nonzero hit count acquired in subsequent years. If the hit count remains zero until the final year, then we accept that its ratio is infinite, and rank it against other infinite-ratio terms based solely on the final year’s hit count. A second possibility is to define zero as some small number, say 0.1. The choice of this number is unfortunately somewhat arbitrary, but the smaller it is defined to be, the higher the ranking zero-hit count terms will receive. We are currently using the second method, but exploring various options is an important topic of upcoming work.
We have experimented with a method in which we first calculate the average hit count across all terms for 2006 and 2008. Then we look for terms whose 2006 hit count is much smaller than the 2006 average and whose 2008 hit count is much higher than the 2008 average. We have called this method “total growth” analysis (as opposed to “early growth.”) While this method is interesting and potentially informative, it is heavily biased against very small hit counts (that is, it emphasizes large growth over small size), which undermines the search for the “early growth” that we seek. Another seemingly viable possibility for identifying interesting terms would be to rank them according to the slope of their growth, i.e. the change in hit counts divided by the change in time. Since all terms have the same time range, this reduces to ranking them with respect to absolute changes in hit counts which again, favors terms whose hit counts were large to begin with.
There may be other metrics besides those described above that could produce the desired results. For example, the use of intermediate years in our analysis will give us a more granular and accurate
assessment of changes in growth. Defining precisely what is meant by “early growth” is an important part of this ongoing research.
2.4 Implementation of Initial Software and Performance Characteristics
The initial implementation of the our method is in the Python programming language. It contains three modules, each corresponding to one of the three steps of our methodology: term collection, hit count collection, and trend analysis.
1. The term collection module takes three parameters as input: a list of seed terms (which is often just a single term), the number of articles from which to collect terms in Compendex and Inspec, and the breadth/depth pattern to use for hierarchically collecting terms from Scirus. The software outputs the collected terms to a text file.
2. The hit count collection module takes as input the term file generated in the previous step, as well as a list of publication databases and the range of years from which to collect hit counts. The output of
2
In particular, we will use the second derivative of prevalence as a weighted measurement to determine, in part, the “growth.”
this module is a local database which contains, for each term, the hit counts for each year and for each publication database used.
3. The final module performs the hit count trend analysis to identify the early-growth terms, taking as input the local database produced in the previous step. The trend analysis is performed for each database used and outputs a list of the best early-growth candidate terms, sorted by decreasing ratio of final hit count to initial hit count.
The first module runs in time proportional to the number of terms we are collecting. For example, it takes approximately 5 minutes to collect 5,000 terms on a typical modern computer with a broadband Internet connection. The largest source of variance in the runtime of this module is the speed of the connection used by the online databases being queried. Heavy traffic or slow local connections significantly increase the module's run time.
The second step runs in time proportional to the product of the number of terms being analyzed, the number of years over which to collect hit counts, and the number of online databases from which to collect this information. But again, the speed of the connection with the online databases is a key factor in the runtime of this module. Under typical conditions, if for each of 5,000 terms we wish to collect three years’ worth of hit counts from two different publication databases, runtimes reach approximately five hours. The reason for the large increase in the time needed to complete the first step is that for each term we must visit and scan six HTML pages to collect that term’s hit counts. In contrast, in the term collection step, a scan of a single HTML page gives us many terms.
The third module runs in time proportional to the number of terms being analyzed. But as it does not involve accessing information on the web, analyzing 5,000 terms takes less than a second.
Thus, the bottleneck in our software is clearly the second step. We have performed some optimizations to make it more efficient, such as scanning only the section of a search results page that we know to contains the hit count, but this step is inherently time consuming.
3. Preliminary Results
Preliminary results for these first three steps are shown here.
1. As described above, we used Compendex, Inspec, and Scirus to gather approximately 5,600 terms
on renewable energy.
2. Next, we used both Compendex and Scirus to identify hit count trends on each of the terms, appending each query with ‘renewable energy’ to keep the hit counts in the proper context.
3. Finally, for both our Compendex hit counts and Scirus hit counts, we ranked the terms according to the ratio of their 2008 hit count to their 2006 hit count.
The top 20 terms for both Compendex growth and Scirus growth are shown below. Top Compendex growth:
energy, engineering, technology, wind, fuel, time, development, efficiency, cells, experimental, policy, oil, industry, economic, concentration (process), electric power systems, speed, economics, emission, wind energy
Top Scirus growth:
biopower, concentrating solar power (csp), genome sequence, biochemical pathways, equitable distribution, sustainable resources, homer, food prices, wind power prediction, plant sciences, small
hydroelectric plants, sustainable communities, assortment, wind load, fischer-tropsch diesel, graph theory, mesoscale model, electric loads, european union energy policy, investment strategy
The results show many promising terms though some less suitable ones were also produced. For example, ‘biopower,’ ‘concentrating solar power (csp),’ ‘biochemical pathways,’ and ‘fischer-tropsch diesel’ may be the kind of early growth technologies we are looking for. However, terms such as ‘energy,’
‘engineering,’ and ‘technology’ are far too general, while terms such as ‘time’ and ‘homer’ are largely irrelevant.
We will continue to revise our term collection process, as well as our term ranking process, to ultimately increase the proportion of quality terms identified with our methods.
4.
Improvements to original Methodology
The methodology described above provided some interesting results and indicated that this approach was promising, but it also highlighted a number of problem areas. This led to several improvements to our original methodology, which will now be described.
4.1 Filtering Scirus terms for relevance
As described in section 2.1.2 of this paper, a Scirus search for a given seed term will only return at most 80 related terms. This requires us to perform follow-up searches on the returned terms, and proceed in a hierarchical manner. (In contrast, when we use Compendex or Inspec to gather terms, a search for a single seed term can provide as many related terms as we would like, so no follow-up searches are needed.) A downside to using Scirus to collect terms in this hierarchical manner is that as the depth of the term tree grows, the terms we find can quickly become very general and irrelevant to our goal. For example, if we search for ‘renewable energy,’ three of the 80 terms that come back are ‘stand-alone,’ ‘harnessing,’ and ‘national security.’ If we deepen our tree by extending these terms, grossly irrelevant terms are returned. A sampling of the terms returned from ‘stand-alone’ includes ‘command line,’ ‘adjustable,’ ‘decision-making,’ ‘high availability,’ and ‘default value.’ The results from ‘harnessing’ include ‘humans,’
‘animals,’ ‘publishing group,’ and ‘right arrow.’ And the results from ‘national security’ include ‘freedom of information,’ ‘law school,’ ‘facial recognition,’ and ‘donate.’
Even if we extend some of the more relevant terms returned from a ‘renewable energy’ search, we still find several irrelevant terms at the next level in the hierarchy. For example, ‘energy systems’ is a good, relevant term returned from ‘renewable energy.’ But extending this further, we get results that include ‘sealed,’ ‘fiscal year,’ ‘non-stop,’ and ‘proton.’ And clearly, if we were to extend these terms to the next level after that, we would continue to be out of the realm of renewable energy entirely.
This results in a conflict. We do want to gather terms that are specific and not immediately obvious given the seed term ‘renewable energy.’However, looking only two or three levels deep into the Scirus term hierarchy, we find that the majority of terms are entirely irrelevant to our original topic. We propose to combat this issue by collecting terms deep in the hierarchy, but then screening them for relevance. We can test for relevance by seeing if the term in question points back to our seed term or to some term close to it in the hierarchy. In other words, for a term in question, we can look at the 80 terms returned from Scirus when searching for that term. If one of those returned terms is ‘renewable energy’ (or possibly some term that itself points to ‘renewable energy’), then we can deem the term relevant. Further, if the term were found several levels down from our seed term, but then points back up to it, we can presume that it is both relevant and specific, which is exactly the class of term that we are looking for.
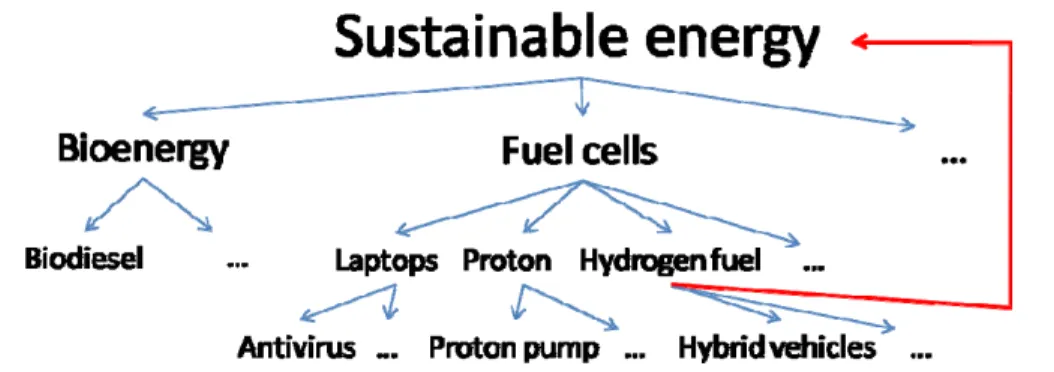
As an example, if we use ‘sustainable energy’ as our seed term, ‘fuel cells’ is among the terms returned at the first level of the hierarchy. When a search on ‘fuel cells’ is performed, some useful terms such as ‘hydrogen fuel’ are returned, as are terms such as 'laptop' and 'proton'. ‘Hydrogen fuel’ can be identified as relevant because Scirus lists ‘sustainable energy’ as one of the terms that it in turn points to. In
contrast, ‘laptops’ and ‘proton’ do not point back to ‘sustainable energy’ and are hence excluded from the subsequent analysis.
Figure 5 illustrates this process. It shows a representation of the Scirus term hierarchy with ‘Sustainable energy’ at the root. ‘Hydrogen fuel’ links back up the hierarchy to ‘Sustainable energy,’ so we declare it to be relevant. Note that in reality this network is highly interconnected; this simple representation ignores many links. In fact, ‘Bioenergy’ and ‘Fuel cells’, terms that we find at the second level of the hierarchy, both point back to ‘Sustainable energy,’ but the arrows are not included in the diagram for simplicity. These two terms, due to their hierarchical proximity to the seed term, do not require testing by return link. ‘Hydrogen fuel’ on the other hand, the illustrative term in this example, points back to ‘Sustainable energy’ and is at the third level, so it is both relevant and specific.
Figure 5. Representation of Scirus term hierarchy with ‘Sustainable energy’ at the root. Here we present results derived from this method of relevance filtering. We collected terms that were found in the first three levels of the term hierarchy from the seed term ‘renewable energy’, and that also pointed back to ‘renewable energy.’ In other words, for each term collected, ‘renewable energy’ was listed among the 80 terms Scirus listed as relevant to that term. We then gathered hit counts over time for each of these terms, and applied our trend analysis to identify the top early growth candidates. The top 20 terms are listed here, in ranked order according to growth of Scirus hit counts:
pakistan, solar water, wind turbines, turkey, renewable energies, hydropower, stromerzeugung, mppt, solar thermal, solar water heating systems, photovoltaic systems, linear test bed, biodiesel production, ocean wave power, renewable, energy technologies, turbines, hydroelectric energy, electrification, megawatts
It can be seen that these terms are more relevant to the topic of renewable energy than are the terms found in our previous results. We can make further improvements if we relax the requirement that any term in our list points directly back to ‘renewable energy.’ In the results presented below, we instead allow any term that points back to either ‘renewable energy,’ ‘sustainable energy,’ or ‘alternative energy.’
Following this adjustment, the top 20 terms in Scirus growth are:
electric cars, hydrogen vehicles, solar house, pakistan, gas engine, solar water, climate policy, solar energy systems, wind energy, tidal power, offshore drilling, renewables, solar energy applications, turbine noise, global warming, solar power, solar electricity, nanotechnology, alternative fuels, alternative energy
In this list, we observe positive results. Many of the terms listed, including the top-ranked ‘electric cars’ and ‘hydrogen vehicles,’ describe energy-related technologies that are growing in popularity. In addition, we see some terms which describe energy issues rather than technologies, such as ‘climate policy,’ ‘offshore drilling,’ and ‘global warming.’ And while terms such as these are not precisely what we are looking for, they do represent current events which are becoming more important issues over time. The primary problem with the terms on this list is that they tend to be quite general. For example, while electric cars are indeed quickly growing in popularity, we would like this list to contain specific technologies behind electric car design.
4.2 Filtering Scirus terms using eigenvector centrality metric
The approach described in the previous section is relatively straightforward. But filtering for relevance can be made more robust with a more complex approach. For example, as we have seen, requiring a term to point directly back to the single seed term may be too restrictive a requirement. Instead, it may be enough to point to a term that is close to our seed, or to another term that has already been declared relevant. This intuition, where relevance is a quality that is derived from association with other relevant nodes, motivates the approach that will be described next.
In the previous section, we discussed a tree-like structure of terms identified by Scirus. Searching for a particular term in Scirus results in 80 new terms being identified, so each term may be considered as a node in a tree with 80 outgoing directed edges.
This tree-like, hierarchical view was useful for the relevance checking described in the previous section, but a more accurate view is not of a tree, but of a densely connected network of terms (the difference being that a tree is by definition acyclic and has exactly one parent node for each non-root node). As an example of the structure of a Scirus term network, consider the small set of terms [‘renewable energy’, ‘renewable energy technologies’, ‘wind power’, and ‘geothermal’]. A search for ‘renewable energy’ returns each of the other three as related terms, so we represent this in our network with edges pointing from ‘renewable energy’ to each of the other three terms. A search for ‘renewable energy technologies’ returns both ‘wind power’ and ‘geothermal,’ so we add such edges to our network. A ‘Wind power’ search returns ‘renewable energy technologies’ and ‘geothermal,’ so again we add the appropriate edges. Finally, a search for ‘geothermal’ does not return any of the other three terms, so ‘geothermal’ has no outgoing edges in our network. This network contains many cycles (e.g. ‘wind power’ -> ‘renewable energy technologies’ -> ‘wind power’), and has many nodes with more than one parent node (e.g. ‘geothermal’ is linked to by all three other terms), so it has a network or web-like structure rather than a tree structure.
As a measure of importance or relevance, we can then calculate the so-called eigenvector centrality of each node in the network. This is defined such that the centrality of any node X is equal to the sum of the centralities of the nodes with edges pointing to X, divided by a constant. Intuitively, if X has many incoming edges, and particularly if those edges originate from nodes with large centralities, then X will also have a large value of centrality.
In order to use the eigenvector centrality metric for the purpose of relevance checking, we first create a representation of the underlying term network induced by the Scirus “related searches” feature. As has been described previously, this network is created by first querying Scirus with the seed term, in this case ‘renewable energy,’ and exploring Scirus’s underlying term network in a breadth-first manner, storing the nodes and edges we discover in a local database to be used for the eigenvector centrality analysis. We continue expanding and storing these nodes until the resulting network is large enough to avoid missing many important terms. As implied by its name, the eigenvector centrality values for each node are then
found by calculating the first eigenvector of the network's connection matrix, where eigenvector coefficients corresponding to the network nodes yield the centrality measures.
It is important to note that the eigenvector centrality metric does not explicitly test a given term for relevance with the seed term. It merely tests the term’s centrality, i.e. importance, with respect to a network centered on the seed term. The intuition behind the use of this metric is that terms that are relevant to the seed term will be more closely associated to other terms in this network, and conversely, terms that are irrelevant to the seed term will only be sparsely connected with the network as a whole. As an example, we collected 1,000 terms from Scirus centered on the term ‘geothermal’ (i.e., we explored Scirus’s underlying term network in a breadth-first manner, starting at ‘geothermal,’ until we had
collected 1,000 terms.) We then calculated the eigenvector centrality of each term and ranked them in decreasing order of centrality. The top 20 most central terms, in ranked order, are:
geothermal development, geothermal energy, geothermal resources, geothermal, geothermal power, geothermal fields, geothermal reservoir, geothermal system, geothermal sources, geothermal district heating, geothermal fluids, geothermics, geothermal water, geothermal steam, geothermal field, geothermal fluid, geothermal systems, geothermal wells, geothermal areas, kizildere
The 20 least central terms, again in decreasing order of centrality, are:
labor force, wavelet, veto power, heart rate, nucleic acid, cardiovascular diseases, sequence analysis, consumer behaviour, interpretation of results, financial services, green tea, court of appeal, gathering information, risk factors, cylindrical, animals, mental health, brittle-ductile transition, owner-occupied housing, cognition
The results are quite convincing and demonstrate the effectiveness of eigenvector centrality as a metric for relevance. The first 20 terms are very closely related to ‘geothermal’ (‘Kizildere’, the 20th term, is a geothermal power plant.) It is interesting to note that ‘geothermal’ itself is only the 4th most central term, but considering that the network contains 1,000 terms, it might be more of a surprise if it were ranked first. The 20 least central terms are either completely irrelevant (‘cardiovascular diseases,’ ‘green tea’) or are partially relevant but in an entirely incidental way (‘labor force,’ ‘gathering information’).
Although eigenvector centrality appears to be a good metric for term relevance, the highest-ranked terms are still too general. We would like to see specific technologies important to geothermal development, but instead what we see tend to be very broad areas of interest within the field. It seems that eigenvector centrality has its place in the term filtering process, but should perhaps be used in conjunction with some other filtering method that first removes these overly general, high-level terms.
5.
Early Growth Technology Analysis Tool
As was described above, we have developed a software tool for identifying early growth emerging technologies by going through the steps of: (1) collect a large number of terms related to the field we are interested in, (2) record the change over time of hit counts from online publication databases for each of our collected terms, (3) use these hit count trends to reduce the size of our list to a shorter list of
potentially interesting technologies. Although effective in producing the results described above, this software was not designed to be especially “user friendly.” As a result, we have created the Early Growth Technology Analysis Tool with desktop and web versions to perform those steps automatically. Here we will briefly explain it.
5.1 Introduction
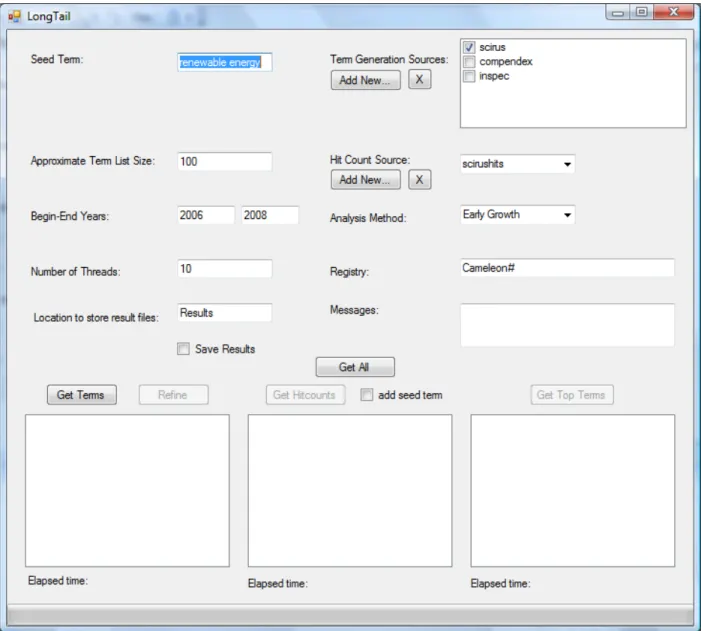
The Early Growth Analysis (EGA) tool collects the required inputs from the user through a visual interface, extracts data from web sites on the fly, performs an analysis on the collected data, and displays the results. The user can interact with the tool either through web-based (Figure 6) or desktop application interfaces (Figure 10.)
Figure 6. EGA tool web version
The user enters a seed term, selects one or more term generation sources, a desired term list size parameter, and hits the “Get Terms” button, upon which related terms collected from the specified sources are shown in the term list box (Step 1, Figure 7).
Figure 7: Data to run the first step (term collection) of EGA is entered
When the user selects a single hit count source, specifies an interval in years, and hits the “Get Hitcounts” button, the hit count of each term from the term list box and for each year that falls in the time interval are displayed inside the hit counts box. The maximum number of threads limits the number of outgoing
parallel connections, and the registry field allows spec files from external sources to be used.(Step 2, Figure 8).
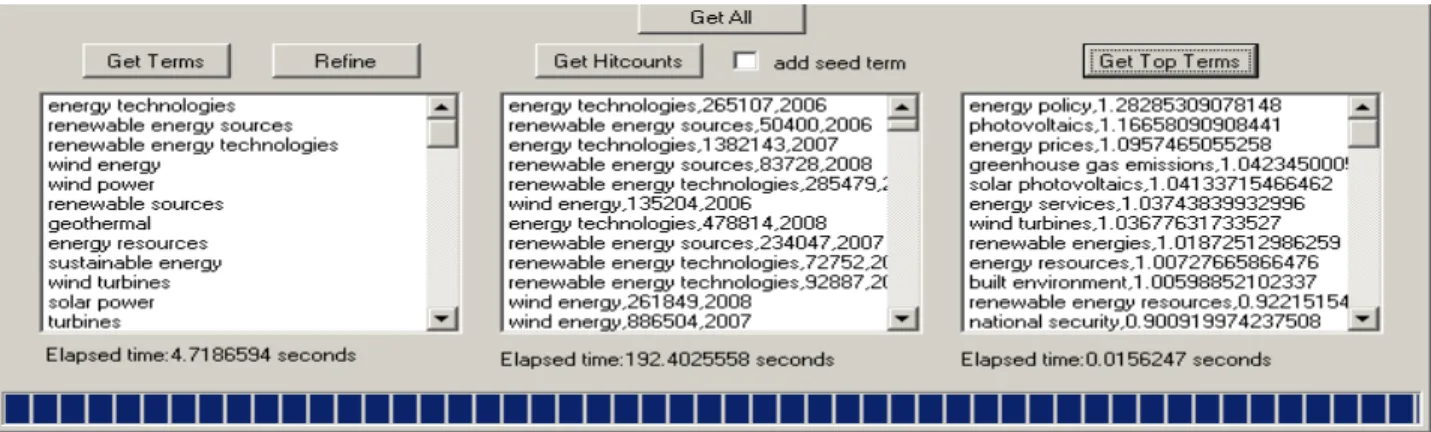
Figure 8: Data to run the second and third step (hit counts and ranking) of EGA is entered Finally, by hitting the “Get Top Terms” button, terms are listed in the top terms box in descending order of importance defined by the analysis method.
In addition, the user can add new sources, save results, refine the results in the term box by keeping only those that “point back” to the original seed term. Also, there is the option of appending the seed term itself to the automatically generated queries. Finally, all the above steps can be executed sequentially and automatically by clicking the “Get All” button. (Figure 9)
Figure 9: Collected terms, hit counts and top terms will be show in the term list, hit count and top term text boxes.
The desktop version is almost identical to the web version in terms of the interface. A notable difference is that it includes a progress bar at the bottom, displaying the progress as the tool runs. Also the registry can be either a local or web directory while the results are stored locally.
Although the interfaces of the web and desktop versions are nearly identical, the applications have different uses. The web-based interface can be accessed from anywhere over an Internet connection. The desktop application, however, offers more control on the resource use and can be run in a non-shared medium.
Figure 10. EGA tool desktop version
In the rest of this section we describe the architecture of the system and provide installation and implementation details. The interested reader may find the details about the code in Appendix 2.
5.2 System Design
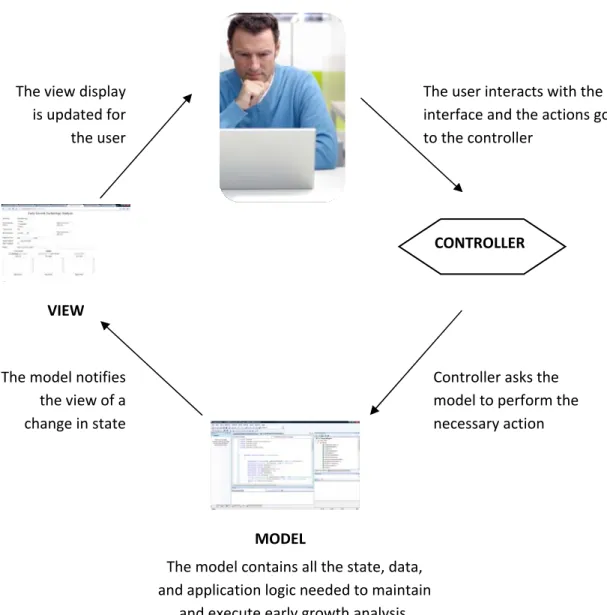
We used the Model-View-Controller (MVC) design pattern3 in developing the EGA tool. MVC decouples the user interface (view) from the core code (model) by minimizing the dependencies between them using a controller. This process is illustrated in Figure 11 below. Using an MVC design pattern allows us to easily implement different interfaces without touching the model; thus preventing maintenance nightmares along the way.
3 In software engineering, a design pattern is a general reusable solution to a commonly occurring problem
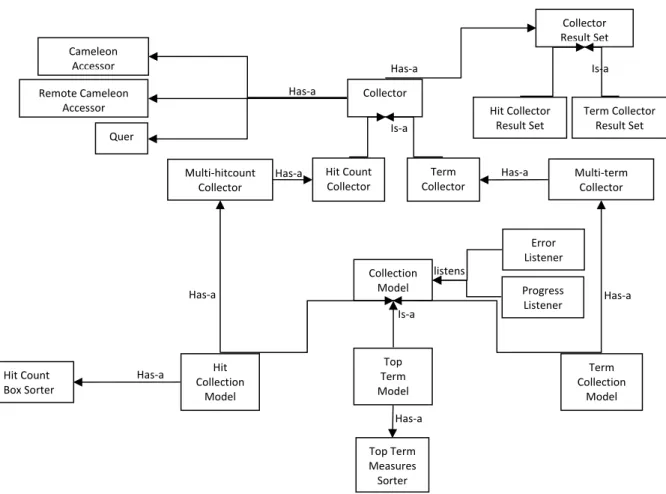
In both systems the model part of the code is identical and organized as shown in Figure 12. We used several sub design patterns within the MVC such as the observer pattern that allows subscribed listeners to be notified of errors and progress updates.
The user interacts with the interface and the actions go to the controller CONTROLLER MODEL Controller asks the model to perform the necessary action VIEW The view display is updated for the user The model notifies the view of a change in state The model contains all the state, data, and application logic needed to maintain and execute early growth analysis. Figure 11. The MVC design pattern –
Both the Controller and the View consists of one class, which are different for the desktop and web applications.
5.3 Implementation
Both applications were implemented in C# using the freely available Visual Studio Express (C# and Web) integrated development environment (IDE). The system runs in the ASP .Net 3.5 framework. The
applications also run under Unix environments with the help of Mono project. We will discuss below some of the implementation issues.
Local vs Remote Cameleon Access: Cameleon is a web extraction tool we utilize in our applications. Currently, we use a Cameleon instance running locally (as a dll) to access remote sources, except in the cases of sources that can only be accessed through MIT. For those sources our applications use the Cameleon server that is running on interchange.mit.edu.
Concurrency in Web Source Access: Originally both POE (parallel version of Cameleon) and Cameleon were used to access the web sources. However, because of the unreliability of POE and the desire to hide implementation details from the user, we currently use only Cameleon with a default thread size of 10, though this can be changed from the interface.
Hit Count Collector Term Collector Collector Has‐a Is‐a Remote Cameleon Accessor Cameleon Accessor Multi‐hitcount Collector Multi‐term Collector Collection Model Term Collection Model Hit Collection Model Is‐a Error Listener Progress Listener Quer Hit Count Box Sorter Top Term Measures Sorter Top Term Model Has‐a Has‐a Has‐a Collector Result Set Hit Collector Result Set Term Collector Result Set Is‐a listens Has‐a Has‐a Has‐a Has‐a
Figure 12. The Model Classes The Model currently consists of 19 classes.
Formulas for Top Term Calculation: We currently use the following formulas for the calculation of top term ranks.
Early Growth = Log(hits in End Year) / Log(hits in Beginning Year)
Total Growth = (hits in End Year – hits in Beginning Year)/hits in Beginning Year)
Progress Bar in Web Application: Although we have a progress bar in the desktop application, we do not have an equivalent one in the web application. Because of the difficulty of asynchronous web
programming, using a progress bar is not very straightforward. We found one potential solution through the implementation of a web service that will read progress from a text file in the server, but we are still trying to find a way to call that web service asynchronously while waiting the server to respond. Adding New Sources: New sources can be added by uploading spec files to the registry directory. This can be done locally in the desktop application, or remotely for the desktop application. The specFiles.txt and specFilesHit.txt files (found under the registry directory in the desktop application, and the root folder in the web application) keep track of existing spec files in the system. When the user adds new sources through the interfaces these files are updated. Note, however, that in the desktop application we rely on the user putting the appropriate files in the registry directory after doing the add operation.
5.3.1 Installation instructions Instructions for setting up the Desktop Application
1. Download the zip file from http://www.aykutfirat.com/LongTailDeskTopApp.zip
2. Unzip the files
3. Go to \LongTailApp\bin\Debug directory
4. Click on LongTailApp.exe (note that if file extensions are hidden in your folder you should see that this file has Application extension, and has 40KB size. Do not mix it with the similarly named XML configuration and Application Manifest files)
5. The default registry directory is \LongTailApp\bin\Debug\Cameleon#
6. The default Results directory where the result files are stored is LongTailApp\bin\Debug\Results Instructions for setting up the Web Application
1. Download the zip file from http://www.aykutfirat.com/LongTailWebProject.zip
2. Unzip the files
REFERENCES
[Firat et al, 2005] Aykut Firat, Stuart Madnick, Nor Adnan Yahaya, Choo Wai Kuan, and Stéphane Bressan, “Information Aggregation using the Caméléon# Web Wrapper,” Proceedings of the 6th International Conference on Electronic Commerce and Web Technologies (EC-Web 2005),” Copenhagen, Denmark, August 23 - August 26, 2005, also published in Springer Lecture Notes in Computer Science (LNCS) 3590, K. Bauknecht et al (Eds.), pp.76-86, Springer-Verlag Berlin, 2005 [SWP # 4562-05, CISL 2005-06]
[Bengisu and Nekhili, 2006] Bengisu, M. and Nekhili, R. (2006). Forecasting emerging technologies with the aid of science and technology databases. Technological Forecasting and Social Change,
73(7):835–844.
[Kajikawa et al.,2008] Kajikawa, Y., Yoshikawa, J., Takeda, Y., and Matsushima, K. (2008) Tracking emerging technologies in energy research: Toward a roadmap for sustainable energy. Technological Forecasting and Social Change, 75(6):771-782
[Kostoff et al, 2001] Kostoff, R.N., Toothman D.R., Eberhart H.J. and Humenik J.A. (2001). Text mining using database tomography and bibliometrics: A review. Technological Forecasting and Social Change, 68:223–253.
[Losiewicz et al., 2000] Losiewicz, P., Oard, D., and Kostoff, R. (2000). Textual data mining to support science and technology management. Journal of Intelligent Information Systems, 15(2):99–119. [Small, 2006] Small, H. (2006). Tracking and predicting growth areas in science. Scientometrics,
68(3):595–610[Vidican et al, 2008] “Measuring innovation using bibliometric techniques: The Case of Solar Photovoltaic Industry" G. Vidican, W.L. Woon and S.E. Madnick, (2009) Proc. Advancing the Study of Innovation and Globalization in Organizations (ASIGO).
[Woon et al, 2009] “Bibliometric analysis of distributed generation”, W.L. Woon, H. Zeineldin and S.E. Madnick (2009), MIT Sloan Research Paper No. 4730-09. http://ssrn.com/abstract=1373889
Appendix 1: Information about Data Source
INTRODUCTION
Generating the most relevant related keywords for a given 'term' is an important preliminary step. The relevance of the terms collected is highly correlated with the quality of the database from which the data is gathered. This appendix describes several databases from which to collect terms from for the purposes of early growth and taxonomy generation. This memo analyzes these sources individually and gives recommendations.4
The sources analyzed in this paper are Compendex, CSA Ilumina, ENGnetBASE, Google, Google Scholar, Inspec, Science Direct, SciFinder, Scirus, Scopus, Springerlink, Web of Science, and Wilson Web.
1. DESCRIPTION OF SOURCES Compendex
Scope of coverage: Compendex contains a compilation of comprehensive engineering literature
databases available for engineers. It currently has 11.3 million records, with over 650,000 new ones added annually, across 190 engineering disciplines gathered from 1970 to the present. 98% of the top 50 U.S. engineering schools currently subscribe to Compendex. New information is gathered weekly from engineering conferences, journals and trade magazines from over 55 countries. Every entry is indexed according to the Engineering Index Thesaurus and indexed according to the precise engineering discipline.
Compendex covers topics from several engineering disciplines, including: Chemical Engineering (15% of Compendex content)
Civil Engineering (15% of Compendex content): Bioengineering, Building Materials Properties, Construction Materials, Geology, Ocean and Underwater Technology, Pollution and Wastes, Sanitary Engineering, Transportation, Water and Waterworks.
Mining Engineering (12% of Compendex content): Fuel Technology, Metal Groups, Metallurgical Engineering, Petroleum Engineering
Mechanical Engineering (12% of Compendex content):Aerospace, Automotive, Fluid Flow, Heat and Thermodynamics, Materials Handling, Naval Architecture and Marine, Nuclear Technology, Plant and Power, Railroad
Electrical Engineering (35% of Compendex content): Computers and Data Processing, Control Engineering, Electronics and Communication, Light and Optical Technology, Sound and Acoustical Technology, Electricity and Magnetism, Electric Components and Equipment, Electronic and Thermionic Materials, Electronic Components and Tubes
General Engineering (12% of Compendex content)5 Keyword/indexing system:
o Controlled terms: keywords related to the article coming from a list of controlled vocabulary composed of agreed-upon technical terms made by the compilers of the database.
• Uncontrolled terms: uncontrolled vocabulary indexing containing terms not in the controlled vocabulary list
Search Customization Options:
• Document type: journal articles, conference articles/proceedings, monograph chapters/reviews,
4 Information contained in this memo builds on a preceding analysis conducted by Clare Li and the source
analysis google doc found in http://spreadsheets.google.com/ccc?key=rCwjpOIS9D6kv8jw5w_oVug
report chapters/reviews, and dissertations.
• Treatment type: application, biographical, economic, experimental, general review, historical, literature review, management aspects, numerical, or theoretical
• Language • Publication Year
CSA Ilumina Scope of coverage:
CSA Ilumina covers topics on Physical Sciences and Engineering, Life Sciences, Health Sciences and Humanities from books and scholarly journals. It provides access to over 100 databases published by CSA and its publishing partners.
Keyword/indexing system:
Author's Keywords and Publisher's Index Search Customization Options:
• Database • Subject Area • Data Range
ENGnetBASE
Scope of coverage: ENGnetBase contains engineering topics using book sources only Keyword/indexing system:
None
Search Customization Options: None
Scope of coverage: Google covers all topics from news, articles, blogs, papers, journals, and every kind of website.
Keyword/indexing system: Google full-text algorithm
The ‘keywords’ are in the form of 'related searches' terms produced by google after the user searches for a specific term. Currently we do not know exactly how these 'related terms' are generated.
Search Customization Options: Language
Google Scholar
Scope of coverage: Google Scholar provides peer-reviewed papers, theses, books, abstracts and articles, from academic publishers, professional societies, preprint repositories, universities and other scholarly organizations. Note however that Google Scholar is specifically focused on scholarly documents, and everything covered by Google Scholar is also covered by Google.
Keyword/indexing system: Google full-text algorithm Search Customization Options:
• Publication Field • Date of Publication • Subject Area
Inspec
Scope of coverage:
Inspec is an abstracting and indexing database for physics, electrical engineering, electronics and computer science information. Updated weekly, it currently has 11 million specially-selected records gathered from 1969 to the present that are precise, targeted and relevant, with over 600,000 new records added annually. Inspec is used by scientists, engineers, librarians, patents specialists, academia and researchers all over the world. Content is available for:
Physics (47% of Inspec content)
Electronics & Electrical Engineering (26% of Inspec content) Computing & Control (20% of Inspec content)
Manufacturing & Production Engineering (5% of Inspec content)
Information Technology, Networking and Security (2% of Inspec content)6 Keyword/indexing system:
o Controlled terms: keywords related to the article coming from a list of controlled vocabulary composed of agreed-upon technical terms made by the compilers of the database.
o Uncontrolled terms: uncontrolled vocabulary indexing containing terms not in the controlled vocabulary list
Search Customization Options:
• Document type: journal articles, conference articles/proceedings, monograph chapters/reviews, report chapters/reviews, and dissertations.
• Treatment type: application, biographical, economic, experimental, general review, historical, literature review, management aspects, numerical, or theoretical
• Language • Publication Year
Science Direct
Scope of coverage: Science Direct contains over 25% of the world's science, technology, and medicine full-text and bibliographic book and journal information. Information in Science Direct comes from: o Journals: Over 2,500 authoritative titles and more than nine million full-text articles are available dating back as far as 1823.
o Online Books: Over 10,500 books - including backfiles - in the following categories: eBooks, Major Reference Works, Book Series and Handbooks. 7
Keyword/indexing system: Author's Keywords and Publisher's Index Search Customization Options:
• Subject • Date Published SciFinder Scope of coverage: 6 Source: http://www.ei.org/inspec_inspecarchive 7 Source: http://www.info.sciencedirect.com/content/
SciFinder contains chemistry-realated topics and is only for chemists. SciFinder includes journal and patent information from 10,000 currently published journals and patents from more than 59 patent authorities, containing important scientific discoveries from the present to the mid-1800s.
Keyword/indexing system: None Search Customization Options: None Scirus
Scope of coverage: Scirus contains scientific topics found in web sites, news, journals, web articles and academic papers. It searches over 485 million science-specific web pages, filtering out non-scientific sites, and finds peer-reviewed articles such as pdf and postscript files. Scirus searches the most
comprehensive combination of web information, preprint servers, digital archives, repositories and patent and journal databases.
Scirus currently covers over web pages including156 million .edu sites, 54 million .org sites, 9 million .ac.uk sites, 52 million .com sites, 36 million .gov sites, and over 143 million other relevant STM and University sites from around the world.
Scirus also indexes these sources (the numbers are approximate): 447,000 articles from American Physical Society
536,000 e-prints from ArXiv.org
42,000 full-text articles from BioMed Central 19,000 documents from Caltech Coda
3,300 e-prints from Cogprints
81,800 full-text articles from Crystallography Journals Online 24,000 documents from CURATOR
2.1 million documents from Digital Archives 24,000 documents from DiVa
98,500 full-text articles from Project Euclid
3,200 documents from HKUST Institutional Repository 56,000 documents from The University of Hong Kong 12,700 full-text documents available from IISc
11,000 full-text documents available from Humboldt Universität 284,000 full-text articles from Institute of Physics Publishing 23.1 million patent data from LexisNexis
16,000 full-text articles from Maney Publishing 40,000 full-text documents from MD Consult
585,000 full-text documents from Nature Publishing Group 18.1 million Medline citations via PubMed
72,000 documents from MIT OpenCourseWare 24,700 technical reports from NASA
792,000 full-text theses and dissertations via NDLTD 8,900 documents from Organic Eprints
1,690 documents from PsyDok
1.5 million articles from PubMed Central 738,000 documents from RePEc
63,000 full-text articles from Royal Society Publishing 619,000 full-text articles from SAGE Publications 8.0 million full-text articles from ScienceDirect 463,000 full-text journal articles from Scitation
9,100 articles from SIAM
16,600 documents from University of Toronto T-Space 21,800 full-text documents from WaY8
Keyword/indexing system:
‘Keywords’ can be seen in the ‘refine your search’ box in the lower left side of the website. Scirus uses an automated extraction algorithm to calculate ranking by relevance. This ranking is determined by two basic values:
• Words - the location and frequency of a search term within a result account for one half of the algorithm. This is known as static ranking.
• Links - the number of links to a page account for the second half of the algorithm - the more often a page is referred to by other pages, the higher it is ranked. This is known as dynamic ranking. Overall ranking is the weighted sum of the static and dynamic rank values. Scirus does not use metatags, as these are subject to ranking-tweaking by users.
Search Customization Options:
• Information Types: abstracts, articles, books, company homepages, conferences, patents, preprints, scientist homepages, theses/dissertations
• Content Sources • Subject Areas
Scopus
Scope of coverage:
Scopus covers articles from web sites, news, journals, web articles and academic papers including nearly 18,000 titles from more than 5,000 international publishers, covering 16,500 peer-reviewed journals (including more than 1,200 Open Access journals), 600 trade publications, 350 book series, and extensive conference coverage (3.6 million conference papers). It contains has 38 million records, of which 19 million include references going back to 1996 (78% include references), and 9 million pre-1996 records go back as far as 1823. Scopus also covers 435 million quality web sources, including 23 million patents. Web sources are searched via Scirus, and include author homepages, university sites and resources such as the preprint servers CogPrints and ArXiv.org, and OAI compliant resources. Scopus contains broad coverage of Scientific, Technical, Medical and Social Sciences, and Literature (including Arts &
Humanities), with more than half of Scopus content originating from Europe, Latin America and the Asia Pacific region. It contains over 4,300 Life Sciences titles, over 6,800 Health Sciences titles, over 7,200 Physical Sciences titles, and over 5,300 Social Sciences titles.9
Keyword/indexing system: Automated extraction and author assignment Search Customization Options:
• Date Published • Subject Area • Authors
• Title, Abstract, Keywords • Affiliation
• Language
• ISSN / CODEN / DOI
8 Source: http://www.scirus.com/srsapp/aboutus/ 9 Source: http://info.scopus.com/detail/what/
• References • Conference
Springerlink Scope of coverage:
Springerlink covers topics in Architecture, Life Science, Behavior Science, Business/Econ, Chemistry/Materials, Computer Science, Environmental Science, Engineering, Humanities, Social Science, Law, Math/Statistics, Medicine, Physics, Astronomy, Applied Computing from journals, books, reference works, protocols, academic publications. It contains over 1,750 peer reviewed journals and 27,000 eBooks online. 3,500 eBooks, eReference Works and eBook Series titles are scheduled to be added each year.10
Keyword/indexing system: Keywords pulled from publishers; some articles have none. Search uses frequency analysis as well as keywords.
Search Customization Options: • Title
• Author • Editor
• ISSN / ISBN / DOI • Date of Publication
Web of Science
Scope of coverage: Web of Science has authoritative, multidisciplinary content that covers over 10,000 of the highest impact journals worldwide, including Open Access journals and over 110,000 conference proceedings. Topics in agriculture, biological sciences, engineering, medical and life sciences, physical and chemical sciences, anthropology, law, library sciences, architecture, dance, music, film, and theater with coverage available to 1900. Contains articles, proceedings, papers, reviews, editorials, news. Web of Science offers access to six comprehensive citation databases:
Science Citation Index Expanded: Over 7,100 major journals across 150 disciplines, to 1900. Social Sciences Citation Index: Over 2,474 journals across 50 social science disciplines, as well
as 3,500 of the world's leading scientific and technical journals, to 1956.
Arts & Humanities Citation Index: Over 1,395 arts and humanities journals, as well as selected items from over 6,000 scientific and social sciences journals.
Conference Proceedings Citation Index: Over 110,000 journals and book-based proceedings in two editions: Science and Social Science and Humanities, across 256 disciplines.
Index Chemicus: Over 2.6 million compounds, to 1993.
Current Chemical Reactions: Over one million reactions, to 1986, plus INPI archives from 1840 to 1985.11
Keyword/indexing system:
Author-Chosen keywords, and KeyWords plus ™ keywords
KeyWords Plus are words or phrases that frequently appear in the titles of an article's references, but do not necessarily appear in the title of the article itself. KeyWords Plus may
10 Source: http://www.springer.com/e‐content?SGWID=0‐113‐12‐286799‐0 11 Source:
http://thomsonreuters.com/products_services/science/science_products/scholarly_research_analysis/research_di scovery/web_of_science
be present for articles that have no author keywords, or may include important terms not listed among the title, abstract, or author keywords.12
Search Customization Options: • Topic • Title • Author • Publication Name • Year Published • Address
• Time past since publication
WilsonWeb
Scope of coverage: Wilson Web contains many databases on a wide range of subjects. Three significant ones are OmniFile Full Text Mega, Education Full Text, and Business Full Text. Other WilsonWeb databases include Applied Science and Technology Full Text, Biological & Agricultural Index Plus, Book Review Digest Plus, Book Review Digest Retrospective, Education Index Retrospective, Essay and General Literature, General Science Full Text, Humanities & Social Sciences Retrospective, Humanities Full Text; Index to Legal Periodicals and Books, Library Literature & Information Science Full Text, Readers Guide Full Text, Readers' Guide Retrospective, Short Story Index, and Social Sciences Full Text. Keyword/indexing system: None
Search Customization Options: Database
2. SAMPLE SEARCH RESULTS
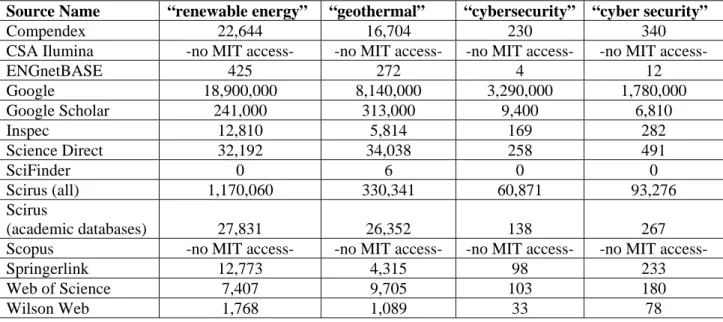
To illustrate the volume of items found in each source, we used the Scirus, Web of Science, Inspec, Compendex, Science Direct, Springerlink and Google Scholar databases, and searched for terms 'renewable energy', 'geothermal', 'cybersecurity', and 'cyber security'. The results are summarized below (accurate as of July 23, 2009)


![[PDF] Donner des cours d'informatique en ligne | Cours informatique](data:image/gif;base64,R0lGODlhAQABAIAAAP///wAAACH5BAEAAAAALAAAAAABAAEAAAICRAEAOw==)