Application of Artificial Intelligence Techniques for Root Cause Analysis of Customer Support Calls
by
Sailashri Parthasarathy
B.E. Electronics and Communication, Visveswaraiah Technological University, 2003 M.S. Computer Engineering, North Carolina State University, 2005
Submitted to the MIT Sloan School of Management and the Institute for Data, Systems, and Society in Partial Fulfillment of the Requirements for the Degrees of
Master of Business Administration and
Master of Science in Engineering Systems
In Conjunction with the Leaders for Global Operations Program at the MASSACHUSETTS INSTITUTE OF TECHNOLOGY
June 2017
© 2017 Sailashri Parthasarathy. All rights reserved.
The author hereby grants to MIT permission to reproduce and to distribute publicly paper and electronic copies of this thesis document in whole or in part in any medium now known or hereafter created.
Signature of Author:
MIT Sloan School of Management, MIT Institute for Data, Systems, and Society May 12, 2017 Certified by:
Tauhid Zaman, Thesis Supervisor KDD Career Development Professor in Communications and Technology Certified by:
Bruce Cameron, Thesis Supervisor Lecturer in System Design and Management
Accepted by:
John N. Tsitsiklis, Clarence J. Lebel Professor of Electrical Engineering Graduate Officer in Institute for Data, Systems, and Society Accepted by:
Maura Herson, Director of MIT Sloan MBA Program MIT Sloan School of Management
2
3
Application of Artificial Intelligence Techniques for Root Cause Analysis of Customer Support Calls
by
Sailashri Parthasarathy
Submitted to the MIT Sloan School of Management and the Institute for Data, Systems, and Society on May 12, 2017 in Partial Fulfillment of the Requirements for the Degrees of
Master of Business Administration and Master of Science in Engineering Systems
Abstract
Dell Technologies seeks to use the advancements in the field of artificial intelligence to improve its products and services. This thesis aims to implement artificial intelligence techniques in the context of Dell’s Client Solutions Division, specifically to analyze the root cause of customer calls so actions can be taken to remedy them. This improves the customer experience while reducing the volume of calls, and hence costs, to Dell.
This thesis evaluated the external vendor landscape for text analytics, developed an internal proof-of-concept model using open source algorithms, and explored other applications for artificial intelligence within Dell. The external technologies were not a good fit for this use-case at this time. The internal model achieved an accuracy of 72%, which was above the acceptable internal threshold of 65%, thus making it viable to replace manual analytics with an artificial intelligence model. Other applications were identified in the Client Solutions division as well as in the Support and Services, Supply Chain, and Sales and Marketing divisions.
Our recommendations include developing a production model from the internal proof-of-concept model, improving the quality of the call logs, and exploring the use of artificial intelligence across the business. Towards that end, the specific recommendations are: (i) to build division-based teams focused on deploying artificial intelligence technologies, (ii) to test speech analytics, and (iii) to develop a Dell-wide Center of Excellence. The division-based teams are estimated to incur an annual cost $1.5M per team while the Center of Excellence is estimated to cost $1.8M annually. Thesis Supervisor: Tauhid Zaman
Title: KDD Career Development Professor in Communications and Technology
Thesis Supervisor: Bruce Cameron
4
5
Acknowledgments
This work would not have been possible without the guidance, help, and support of many people. I would like to thank Dell Technologies for giving me the opportunity to pursue this research. It was a pleasure and a privilege to work with Neil Hand, Bert Hays, Richard Grabowski, Jeff Schmitt, Aditya Kulkarni, Leonard Lo, Todd Swierk, Vishal Pahwa, Alan Richey, and Jennifer Davis, whose support was instrumental to the completion of this project.
I would like to acknowledge David Neider, Pradeep Sakkaravarthi, and Stephanie Edwards for providing invaluable guidance, helping navigate the tools at Dell, and contributing their time and energy to the success of this project.
I would like to extend my gratitude to Neal Kohl for providing direction, critical insights, and opportunities to broaden my experience. He went above and beyond as a mentor by being invested not only in my immediate success, but also in my overall professional development.
I would like to thank my thesis advisors, Bruce Cameron and Tauhid Zaman, for their involvement over the course of this project. Their input was immensely helpful in refining the content of this research.
I would like to thank Massachusetts Institute of Technology for giving me the opportunity to be part of such an incredible program. I am grateful to the staff of the Leaders for Global Operations (LGO) program for their support over the two years.
Finally, I am eternally indebted to my family for the countless things they have done for me, and for always inspiring me to do my best.
6
7
Table of Contents
List of Figures 9 List of Tables 9 1 Introduction 11 1.1 Motivation ... 12 1.2 Problem Description ... 13 1.3 Thesis Goals ... 14 1.4 Thesis Overview ... 14 2 Background 15 2.1 Dell Technologies ... 15 2.2 Artificial Intelligence ... 152.3 Current Methodology for Root Cause Analysis ... 19
2.4 Financial Impact Analysis ... 22
3 External Vendor Selection 24
3.1 Criteria for Vendor Selection ... 25
3.1.1 Hard Constraints ... 25
3.1.2 Soft Constraints ... 25
3.2 Landscape for Text Analytics ... 26
3.3 Vendor Selection Process ... 28
3.3.1 Initial Information Collection ... 28
3.2 Product Demonstrations ... 31
3.3 Vendor Selection ... 34
3.4 Model Development Process ... 35
3.4.1 Input Dataset ... 35
3.4.2 Execution Phases ... 35
3.4.2 Model Development... 37
3.5 Model Development Results ... 38
8
4 Internal Model Development 39
4.1 Input Dataset ... 40
4.2 Model Development Process ... 41
4.2.1 Existing Model Overview ... 41
4.2.2 Model Configuration Parameters ... 46
4.2.3 Model Development... 47
4.2.4 Model Accuracy Threshold... 48
4.3 Initial Accuracy of Model ... 48
4.4 Model Refinement Process... 48
4.4.1 Uniform Use of Case ... 49
4.4.2 Manual Categorization Error ... 49
4.4.3 Match against All Manual Categories ... 49
4.4.4 Removal of Digits ... 50
4.5 Final Accuracy of the Model ... 51
4.6 Model Run Time ... 54
4.7 Insights from Internal Model Development ... 55
5 Recommendations 56
5.1 Develop a Production Model... 56
5.2 Improve the Quality of the Customer Support Logs ... 58
6 Broader Context for Artificial Intelligence 59
6.1 Applications for the Internal Model ... 59
6.2 Applications for Artificial Intelligence across Dell ... 60
6.3 Recommendation ... 61
7 Summary 63
7.1 Contributions ... 63
7.2 Recommendations ... 64
9
List of Figures
Figure 1: Investment in Artificial Intelligence Startups ... 19
Figure 2: Contact Reduction Process ... 21
Figure 3: Results of the Product Demonstrations ... 34
Figure 4: External Vendor Evaluation Process ... 34
Figure 5: Model Training and Model Testing Process ... 40
Figure 6: Steps to Parse Sentences into their Word Stems ... 45
Figure 7: Improvement of Accuracy with Each Model Refinement... 51
Figure 8: Precision and Recall for Each Call Category ... 52
List of Tables
Table 1: Initial Constraints for Vendor Evaluation ... 26Table 2: List of External Companies Considered ... 28
Table 3: Initial Evaluation of External Vendors ... 30
Table 4: Updated Constraints for Vendor Evaluation... 32
Table 5: Companies Selected for Product Demonstrations ... 33
Table 6: Specifications of Workstation... 54
Table 7: Sizing and Annual Costs for Division-based Teams ... 57
10
11
Chapter 1
Introduction
Dell Technologies is a privately owned multi-national company headquartered in Round Rock, Texas. Founded in 1984, the company specializes in building computer products and is a player in multiple segments including laptops, desktops, servers, storage, and networking. The company provides customer support and repair services for its products.
Dell Technologies (“Dell”) seeks to use the developments in artificial intelligence to improve its products and services. Artificial intelligence refers to a machine’s ability to learn and mimic human cognitive functions. While artificial intelligence has been an area of research for over 50 years, this field has reached a level of maturity that makes it possible to have wide-spread applications. These advancements have been facilitated by the breakthroughs in computing capabilities, the advancement of algorithms, and the widespread availability of data. One paradigm shifting application of artificial intelligence is worker augmentation where programs are used to perform repetitive work, so workers can shift their focus to more complex tasks. This thesis aims to implement artificial intelligence technologies in the context of Dell’s Client Solutions division. The Client Solutions division is responsible for personal computers, thin clients, workstations, monitors, and tablets.
12
1.1
Motivation
Customer support is a major priority for Dell. The company spends hundreds of millions of dollars each year providing support to customers who have purchased its products and solutions. Customer service caters to a range of support issues which include providing information, debugging issues, re-issuing failed components and so on. One channel that customer support is offered in is through the telephone. Customer support agents are distributed across the globe and provide multi-language support.
Customer support agents talk to customers and log the transcript of the conversation. Quality teams then analyze calls to discover the root cause of the call and take remedial actions for the product family based on those insights. Product family refers to a suite of products that have the same basic architecture but differ in how they are configured. For example, the Inspiron 7000 series could encompass four models with differing screen size, Central Processing Unit (CPU), memory size, and hard disk size. An example of remedial action that the quality team takes would be working with other relevant teams at Dell to push software updates to customers who have purchased a product from that product family. Another example would be to update documentation if customers are calling regarding how to install printers. These actions reduce the need for other customers to call in thus reducing the call volume, and hence costs, to Dell. Most of these analytics are currently done manually. There is therefore an opportunity to use the advancements in artificial intelligence to analyze customer calls.
13
1.2
Problem Description
Customer calls are classified into soft calls and hard calls. Soft calls refer to calls that relate to issues that can be resolved without a hardware dispatch (or component shipment). Examples of soft calls include driver updates through the internet, debugging of wireless connectivity issues, and updating product documentation. Hard calls, on the other hand, refer to calls where Dell dispatches hardware to remediate the issue. An example of a hard call would be an Operating System re-install where Dell dispatches a hard disk to a customer with an Operating System image on it. Soft calls are typically less expensive to Dell than hard calls because hard calls require sending hardware, software, or technicians to resolve the issue. There is a lot more information around hard calls when compared to soft calls. There is detailed information on the dispatched component, right from which exact component was dispatched to when the component was manufactured. While soft calls rely exclusively on call logs to determine the root cause, hard calls do not rely solely on call logs given the additional information that is available.
This thesis aims to evaluate artificial intelligence techniques for faster root cause analysis of calls in the specific context of soft calls. Soft calls would gain more from an artificial intelligence model, and hence were deemed to be a good opportunity to prove the benefits of such a model. The scope of this thesis was limited to first contact soft calls which refer to the first time a customer calls Dell and which do not result in a hardware dispatch.
14
1.3
Thesis Goals
This thesis seeks to implement artificial intelligence techniques for analyzing the root cause of first contact soft calls. There are three key goals:
a. To evaluate the external vendor landscape for text analytics to find suitable solutions. This will include assessing vendors for their product capabilities and evaluating whether their technology is a good fit for this use-case.
b. To develop a proof-of-concept model internal to Dell, using publicly available natural language processing and machine learning algorithms. This will include exploring options for model development and assessing whether the model can reach the desired accuracy. c. To explore other uses for this model within Dell and to explore other applications for
artificial intelligence across Dell.
1.4
Thesis Overview
The thesis is organized as follows. Chapter 2 provides a background on Dell, an overview of artificial intelligence technologies, the current state of root cause analysis, and the financial impact of developing an artificial intelligence model. Chapter 3 discusses the external vendor evaluation process, the criteria used for selecting vendors, the development of a proof-of-concept model, and the conclusions from this evaluation. Chapter 4 details the internal model development process, the model refinement process, and the insights from this development. Chapter 5 provides recommendations. Chapter 6 explores other areas at Dell that could benefit from this artificial intelligence model, and provides a broader context for artificial intelligence at Dell. Chapter 7 provides details the contributions and outlines the next steps.
15
Chapter 2
Background
2.1
Dell Technologies
Dell Technologies is the largest privately-controlled integrated technology company in the world. Dell’s revenue for Fiscal Year 2017 was $62B, and its workforce consisted of 145,000 employees [1]. The company’s products span a breadth of markets including laptops, desktops, tablets, workstations, gaming, thin clients, servers and storage, networking, monitors, printers, software, and accessories [2]. Dell also provides a variety of solutions and services in areas such as big data and analytics, cloud computing, data center and security. With the acquisition of EMC Corporation in 2016, Dell Technologies consists of Dell, Dell EMC, Pivotal, RSA, SecureWorks, Virtustream, and VMWare.
Customer support is a major priority of Dell. The company spends hundreds of millions of dollars annually on soft calls. While there has been a consistent downward trend in the number of soft calls, the costs associated with these calls remains significant. The company has therefore created a team to address the causes for soft calls and to reduce soft call volume.
2.2
Artificial Intelligence
Artificial intelligence is the field of computer science focused on designing intelligent computer systems which exhibit characteristics associated with human behavior – understanding, learning, reasoning, solving problems, and so on [3]. Broadly speaking, artificial intelligence refers to a
16
machine’s ability to learn and mimic cognitive functions. Artificial intelligence research is divided into subfields that are focused on developing specific tools to solve specific problems. The central themes of artificial intelligence research include subfields such as neural networks, computer vision, natural language processing, machine-learning, and deep learning among others [4].
Artificial intelligence has grown into an exciting area of scientific research with many practical applications. Three key factors have contributed to these developments: (i) a significant increase in computing speed, (ii) the development of powerful algorithms, and (iii) the availability of very large amounts of data. This thesis specifically focuses on two core technologies – natural language processing and machine learning.
Natural language processing is the subfield of computer science that is focused on using computational techniques to learn, understand, and produce human language content [5]. Natural language processing can have multiple purposes: to aid human-human communication such as speech-to-text converters, to aid human-machine conversation such as with conversational agents, or benefiting both humans and machines by analyzing the huge amounts of human language content that is available.
Natural language processing is a difficult task given the variability, ambiguity, and context-driven nature of human languages. For example, the word rose can refer to a type of flower or the action of a person standing up, based on whether the word is used as a noun or a verb. Beginning in the 1980s, researchers started building models over large quantities of data, and found that simple templates, such as Parts-of-Speech sequences, can often achieve notable results. The best performing techniques now use sophisticated machine learning algorithms and a rich understanding of linguistic structure. Several of these techniques are available as open-source
17
software packages that can be downloaded without any fee. Examples of open-source software include Stanford’s CoreNLP suite of tools [6] and the Apache OpenNLP toolkit [7].
Natural language processing is used in a variety of real-world applications such as mining social media for information, identifying sentiments towards products and services, and developing voice-activated personal assistants. A major limitation of this field today is the fact that most natural language processing resources are available for languages with widespread use such as English and Spanish. In contrast, regional languages such as Malay and Punjabi, have fewer resources available.
Machine learning refers to the machine’s ability to learn and mimic human cognitive functions. Over the last decade, the use of machine learning models has spread rapidly. Machine learning is used to identify objects in images, transcribe speech to text, and match products with user interests, among others [8].
There are two broad kinds of machine learning algorithms, unsupervised and supervised. In unsupervised machine learning, the objective is to uncover hidden regularities such as clusters, or to detect anomalies in the data [9]. No pre-categorized information is used. In supervised machine learning, there is a category or label associated with each example. The label is the answer to a question about that example. The task of the machine, therefore, is to learn the mapping from the example to the label [10]. Learning is not just a question of remembering but also of generalization of unseen cases. Supervised machine learning can further be divided in to sub-categories such as classification and regression. Classification refers to supervised machine learning where the label is discrete. An example of classification would be predicting whether a customer is a high-risk or a low-risk customer when issuing a loan. In a regression problem, the
18
label is a real-value. An example would be predicting housing prices given a neighborhood, year of construction, amenities, school ranking, and other relevant factors.
Conventional machine learning techniques have limited capabilities of processing data in its raw form. Constructing a machine learning system requires careful engineering design so raw data can be transformed into a suitable internal representation that the learning sub-system could then detect patterns in. Representation learning is a set of methods that allows a machine to process raw data and automatically discover the representations needed for learning [8]. Deep-learning refers to representation-learning methods with multiple levels of representation. These levels are obtained by composing simple modules that each transform the representation at one level (starting from the raw data) into a representation at a higher, slightly more abstract level. They key aspect of deep learning is that these transformed representations are not designed by humans, but are rather learned from data using a general-learning procedure.
Investments in artificial intelligence startups have been on a sharp rise. 2016 was a record year for startups globally. Disclosed funding for startups using artificial intelligence as a core part of their business increased from $589 million in 2012 to $5 billion in 2016 [11]. Deals reached a 5-year high, from 160 deals in 2012 to 658 deals in 2016. The increase in funding and in deals is as shown in Figure 1.
19
Figure 1: Investment in Artificial Intelligence Startups
Artificial intelligence is disrupting the way we do business, and is impacting industries across the board. It is already in use in products such as smart home devices, self-driving cars, spam filters, recommender systems, credit scoring, and fraud detection [12], and is expected to continue to integrate into our everyday life.
2.3
Current Methodology for Root Cause Analysis
Customers can reach Dell via multiple channels including call, email, chat, social media, and on-the-device software. Calls from customers, also known as inbound calls, form a large portion of customer contacts. The company has customer support agents across the world that interact with customers to assist them with their questions and concerns. Customer support agents are positioned to provide support in different regional languages and have varying degrees of expertise. Based on the complexity of the issue, a call could be routed through a hierarchy of agents
20
with increasing level of expertise. Customer support agents are also employed using an Outsourced Service Provider where the provider manages the day-to-day operations of the agents.
Given the complexity of the support agent network, it is difficult to maintain consistency in the call log written by the agents. Customer support agents manually write down the content of the call. While certain fields such as the product type, product generation, and geography are pre-defined data fields, the content of the call itself is unstructured text and is written by the agent. These logs are stored in a common database. Agents are given guidelines on what to include in the log, but these guidelines may vary between customer support centers.
The Software and Solutions Quality team (“quality team”) and the Quality Engineering Tools Team (“quality tools team”) work together to perform root cause analysis of customer calls. The quality team is a three person team with the mandate of reducing the number of contacts customers make with Dell thus improving the customer experience. The quality tools team is an eight person team responsible for building the reporting tools used by multiple teams, one of which is the quality team. This work was performed as part of the Product Strategy and Innovation team (“product strategy team”). The product strategy team is an eighteen person team focused on identifying and defining new markets and new product categories, and driving adoption of emerging technologies. The author of this thesis was part of the product strategy team. Two people from the quality team, one person from the quality tools team, and two people from the product strategy team were involved in this project. All three teams are part of the Client Solutions Division housed under the Product Group.
The quality team categorizes calls into their root causes. Call categories for a product line could include driver updates for touchpad, driver updates for wireless connectivity issues, missing documentation and so on. Once the root causes have been ascertained for a product line, the quality
21
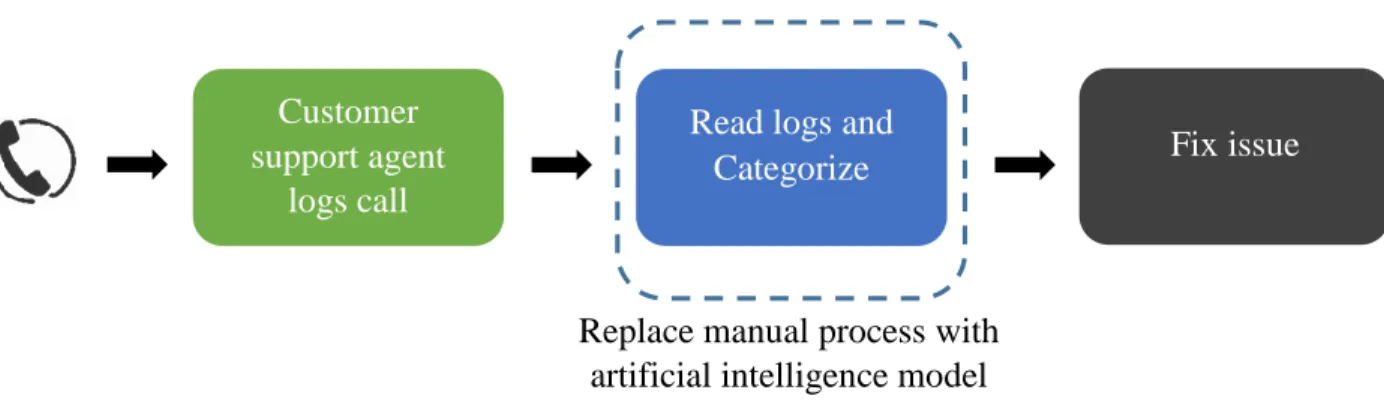
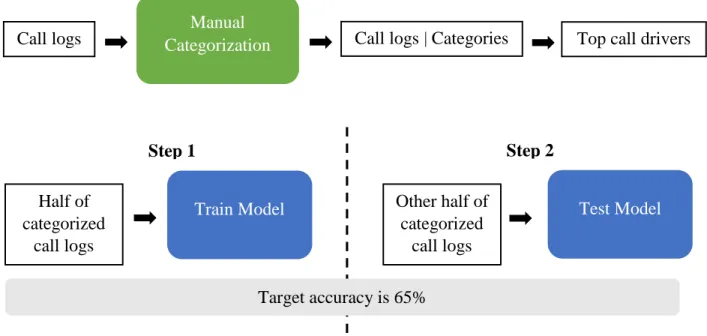
team prioritizes the categories, by the number of calls in each, to pick issues to remedy. These categories are also known as call drivers. Root cause analysis is performed both on a reactive and proactive basis. Reactive scenarios could include issues reported by large retail customers, escalations from Dell’s social media team, escalations from software teams, escalations from the technical support teams, and the like. The team routinely monitors the top call drivers to keep track of which issues customers call the most about. The team is also proactive about monitoring whether number of calls associated with a category is increasing or decreasing. Once the top call drivers are identified, the quality team interfaces with a variety of internal teams to implement solutions, so more customers in the future do not encounter the same problem. Solutions could include pushing relevant driver updates, updating documentation, or more elaborate measures such as re-designing the product. This improves the customer experience, because fewer customers face these issues, and reduces the cost of customer support to Dell. The contact reduction process for soft calls is as shown in Figure 2.
Figure 2: Contact Reduction Process
The Read logs and Categorize step is currently performed manually. Manual analytics is tedious and repetitive. Creating a list of the top call drivers for a couple hundred call logs can take up to four hours. This constrains the number of call logs that can be analyzed, given the set number
Replace manual process with artificial intelligence model
Customer support agent
logs call
Read logs and
Categorize Fix issue
22
of team members. In an ideal scenario, this analytics would be automated so the results of the Read
logs and Categorize step, or the top call drivers, would be available to the quality team.
Automating root cause analysis expands the scope of coverage by enabling a larger set of call logs to be analyzed in a given period of time.
The current methodology to categorize calls starts by gathering a certain timeframe of call logs from the call database. These could be calls from a certain year, month, or week. These logs are then analyzed in Excel using pre-set formulas to identify their root cause. These formulas look for specific words in the call log to determine their category. Examples of words being searched for include ‘wireless’, ‘driver’ etc. There are thirty call categories. The categories are updated by the quality team as and when they become aware of issues that are large enough to track and measure. The thirty categories are further divided into sub-categories, and span the entire Client Solutions business. Calls can be categorized into up to eleven categories based on their content. For example, a customer call regarding Microsoft Outlook password issues could be categorized as an Outlook issue as well as a password issue. This call would therefore have two categories associated with it. A call can have up to eleven categories associated with it. Each call is then assigned a final category by picking the first of the eleven categories by sequence. Because the final category is determined by ordering of which came first, and not by priority, the final category may not be the best fit in certain scenarios. This is an inherent drawback of the manual categorization process.
2.4
Financial Impact Analysis
Both call volume and call duration contribute to customer support costs. The quality team is focused on reducing the volume of first contact soft calls for two reasons: (i) call inbound is the
23
number one method by which customers contact Dell, and (ii) calls are the one of the most expensive channels for Dell. Channels such as chat, and email, are typically less expensive than calls. The initial contact, or the first time a customer calls, is critical because preventing that contact eliminates all further contacts for that issue. Reducing call duration is a new focus area at Dell but this is a difficult problem to solve given that the system that tracks call duration is not reliably tied to the database that maintains the call logs.
The pricing structure for call centers includes a variety of factors such as complexity of calls, call volume, skill level of agents, and geography. The total cost of customer support calls can be computed as follows:
Total cost of calls = Average call volume * Average call duration * Average cost/minute
Root cause analysis is focused on reducing the average call volume by eliminating the need for customers to call. Computing the average cost per call can provide an indicator of how much costs can be saved by eliminating one call. External call centers offer a pricing of $0.90 for inbound calls in the United States [13]. Assuming that a call lasts for 15 minutes, the average cost of a customer call is $14. Each call elimination results in a cost reduction of $14, in this example.
A different way to look at this would be to examine the decrease in profit for a product from each call a customer makes. Each call would reduce the profit margin by $14, in this example. The annual spend on first contact soft calls at Dell is tens of millions of dollars. The quality teams aim to reduce first contact soft calls by 10% over each fiscal year using the manual categorization process. The expected reduction from an artificial intelligence model is twice the current reduction, or 20% of the call volume. The combined cost reduction from an artificial intelligence model at scale is predicted to be $12M.
24
Chapter 3
External Vendor Selection
The external vendor landscape was explore to find an artificial intelligence based model for root cause analysis. Specifically, text analytics solutions were sought with the intent of finding companies that Dell could partner with. Text analytics refers to the process of finding insights from textual data. Gartner’s Market Guide for Text Analytics discusses the text analytics vendor landscape and outlines prominent vendors that focus on text analytics solutions [14]. Using this guide as well as by doing an online search, thirty one vendors were selected to understand their product capabilities and to evaluate their fit with Dell.
The goal of the selection process was to find companies to develop a production model for root cause analysis. The selection process involved four steps:
a. Multiple meetings would be held with the vendors to understand their offering.
b. Select vendors would be invited to demonstrate their product to the quality team, the quality tools team, and the product strategy team.
c. A decision would be made by the teams at Dell regarding whether or not to develop a proof-of-concept model with the vendor. The proof-of-concept would be a small scale demonstration of the solution on Dell’s data.
d. A decision would be made by the teams at Dell regarding whether or not to develop a production model. A production model would be a full scale model that would deployed at Dell.
25
3.1
Criteria for Vendor Selection
The criteria for selecting an external vendor evolved as the selection process progressed. Two kinds of constraints were defined to select vendors: hard constraints and soft constraints. Hard constraints referred to those capabilities without which the vendor would not be able to proceed to the next step in the evaluation process. Soft constraints referred to those capabilities that were sought in a vendor but lack of which did not remove the vendor from consideration.
3.1.1 Hard Constraints
There were two initial hard constraints when evaluating vendors. Not meeting any of the constraints removed the vendor from further evaluation. The hard constraints were as follows:
a. Onboarding process – The vendor’s process for creating custom solutions and for integrating new customers was an important consideration. A short and well-defined onboarding process was necessary.
b. Text analytics experience – Vendors were required to have prior experience in customer support text analytics. It was also important that the solution was not just a program that searched for words, but a machine learning based classification algorithm. Lastly, vendors with production deployment experience of their solutions were sought.
3.1.2 Soft Constraints
There were three soft constraints when evaluating vendors. Not meeting a constraint did not exclude the vendor from further evaluation. The soft constraints were as follows:
26
a. Languages – The proof-of-concept model was planned to be developed on call logs in English. The long-term goal was to perform root cause analysis in all languages in which customer support was offered by Dell.
b. Industry exposure – Exposure to the technology industry was an important factor. Vendors who had worked with customers in the hardware/software industry were considered to be a better fit.
c. Pricing - Vendors were evaluated for pricing for the proof-of-concept model, the full scale production deployment, and for ongoing maintenance. Companies that did not charge for development of a proof-of-concept model were preferred.
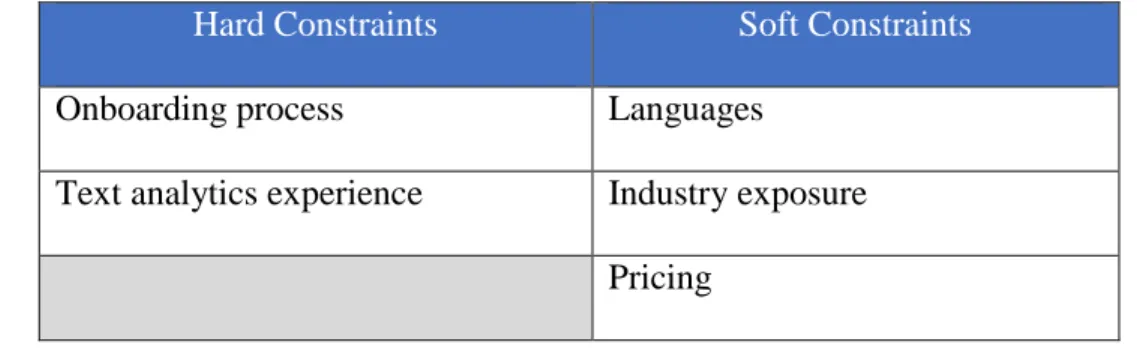
The initial constraints for vendor evaluation are as shown in Table 1.
Hard Constraints Soft Constraints
Onboarding process Languages
Text analytics experience Industry exposure Pricing
Table 1: Initial Constraints for Vendor Evaluation
3.2
Landscape for Text Analytics
Thirty one external vendors were contacted of which eight companies did not respond. Of the remaining twenty three companies, two offered an open source platform, while one other was discovered towards the end of the project. Hence, all three companies were excluded from further evaluation. The twenty vendors that were considered are as listed in Table 2.
27
S/N Company Product Head-Quarters Notable Customers
1 Angoss [15] Knowledge Enterprise
Ontario, Canada Comcast, T-Mobile, and Direct TV
2 Ascribe [16] Ascribe Intelligence Ohio, US Amazon, Career builder, and Nielsen 3 Basis Technology [17] Rosette Text Analytics Massachusetts, US
Amazon, Airbnb, and Adobe
4 Bitext [18] Text Categorization Madrid, Spain Intel, Salesforce, and Accenture
5 Clarabridge [19] CX Analytics Virginia, US Verizon, Walmart, and T-Mobile
6 Expert System [20]
Cogito Discover Modena, Italy Microsoft, Raytheon, and Shell
7 Genesys [21] Customer Engagement Solutions
California, US Emirates, PayPal, and ICICI bank
8 Inmoment [22] Analytics Overlay Utah, US NA* 9 Intrafind [23] iFinder5 Elastic Munich,
Germany
Audi, Bosch, and Avitea 10 Ultimate
Software [24]
UltiPro Florida, US Yamaha, The Container Store, and Kawasaki 11 Lexalytics [25] Salience 6 Massachusetts,
US
Oracle, HP, and UBS 12 Luminoso [26] Luminoso Analytics Massachusetts,
US
Staple, Sprint, and Microchip
13 MartizCX [27] Text Analytics Utah, US AT&T, HSBC, and GM 14 MeaningCloud
[28]
Text Classification New York, US Pfizer, ING Direct, and Telefonica
15 Narrative Science [29]
Quill Illinois, US USAA, Deloitte, and Credit Suisse
28
S/N Company Product Head-Quarters Notable Customers
16 Nice [30] Customer Engagement Analytics
Israel Farmers Insurance, TCF Bank, and Conduent 17 Stratifyd [31] Signals Platform North Carolina,
US
NA* 18 Verint [32] Verint Customer
Analytics
New York, US Carlson Craft Stationery 19 Yseop [33] Savvy Texas, US NA*
20 Quid [34] Quid Platform California, US Ebay, Pepsi, and Intel NA* is Not Available on company website
Table 2: List of External Companies Considered
3.3
Vendor Selection Process
External vendors were evaluated over a four step process. Each step is detailed in the following sections.
3.3.1 Initial Information Collection
Step 1 entailed meeting the vendors to gather information on their solution. The twenty vendors were evaluated against hard constraints and soft constraints. The vendor rating after these discussions is as outlined in Table 3. Company names have been anonymized and their listings have been re-ordered.
29
Y – Yes N – No
Blank – Information has not been gathered
S/N Company Hard Constraints Soft Constraints
Onboarding Process Text Analytics Experience Multiple Languages Industry Exposure Pricing Factors 1 A N 2 B N Y Y - Volume of data - Complexity of data 3 C Y 4 D Y Y 5 E Y Y - Volume of data 6 F Y 7 G N 8 H N N 9 I N Y Y 10 J N Y Y - Volume of data
11 K Y Y - Number of API calls
12 L Y Y - Proof-of-concept cost - Subscription-based - Consultation services 13 M Y Y Y - Number of licenses 14 N N - Subscription-based - Volume of data - Complexity of data 15 O N
30
S/N Company Hard Constraints Soft Constraints
Short Onboarding Text Analytics Experience Multiple Languages Industry Exposure Pricing Factors
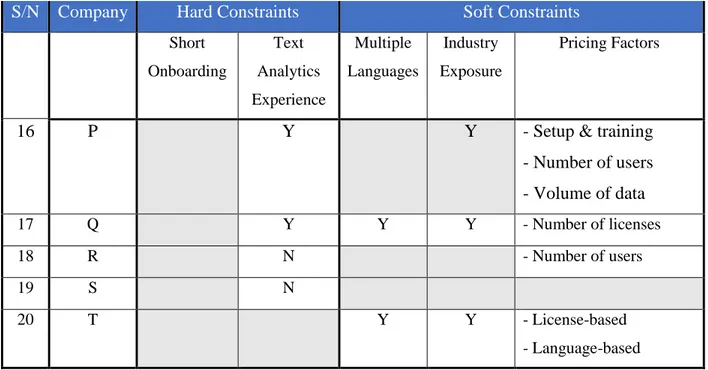
16 P Y Y - Setup & training
- Number of users - Volume of data 17 Q Y Y Y - Number of licenses 18 R N - Number of users 19 S N 20 T Y Y - License-based - Language-based
Table 3: Initial Evaluation of External Vendors
There were two key insights from the first step of the evaluation process:
a. Some vendors used artificial intelligence techniques for categorization while a few others used automated searching to classify text.
b. The pricing model varied significantly between companies. The different pricing models offered were as follows:
i. Data-based pricing – The volume of data being processed determined pricing. A
few companies charged based on the number of call logs, while a few others charged for the size of the call logs (in bytes). A few companies also offered scale based benefits with lower prices for larger volumes.
ii. License-based pricing – The number of licenses dictated the pricing. While some
companies offered a license per person, a few others offered bundles which included three licenses, five licenses, and so on.
31
iii. Time-based pricing – The solution was provided for a set number of days, beyond
which the agreement needed to be renewed.
iv. API-based pricing – Pricing was based on the number of application program
interface (API) calls made to the vendor’s software.
v. Mixed-pricing – There were two different models. In the first, pricing was divided
into three sub-components based on setup and training, number of users, and volume of data. In the second, the vendor charged a fixed software licensing fee that included a certain volume of data. Any data above the limit was charged an additional fee. Any additional languages were also charged a fee on top of the base price.
vi. Consultation services pricing – On-going support was charged a fee by certain
vendors.
3.2
Product Demonstrations
Based on whether or not vendors met the hard constraints of a short onboarding process and experience with artificial intelligence based text analytics solutions, vendors were moved to the second step of the evaluation process. A company that did not meet a hard constraint was excluded from further evaluation. Further, the company that charged a fee for a proof-of-concept model was reserved for later because all other companies offered to develop a proof-of-concept model for free. Of the twenty companies, nine were moved to Step 2.
In Step 2, vendors provided a product demonstration to the quality team, the quality tools team, and the product strategy team. Based on these demonstrations, the internal teams at Dell added two more hard constraints. The constraints were as follows:
32
- On-premise solution – With the large volume of call logs that needed to be processed, it was important for the vendor’s product to have on-premise solution. This would allow the software to be installed on a local server at Dell, instead of being hosted on the vendor’s server.
- Visualization tools – Tools were needed for visualizing the results and were considered to be an important aspect of the solution.
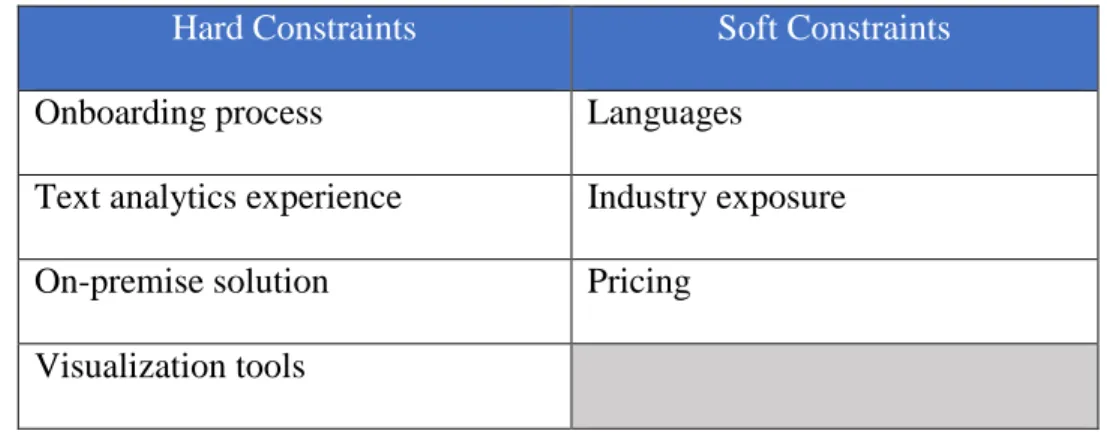
The updated constraints for vendor selection is as shown in Table 4.
Hard Constraints Soft Constraints
Onboarding process Languages
Text analytics experience Industry exposure On-premise solution Pricing
Visualization tools
Table 4: Updated Constraints for Vendor Evaluation
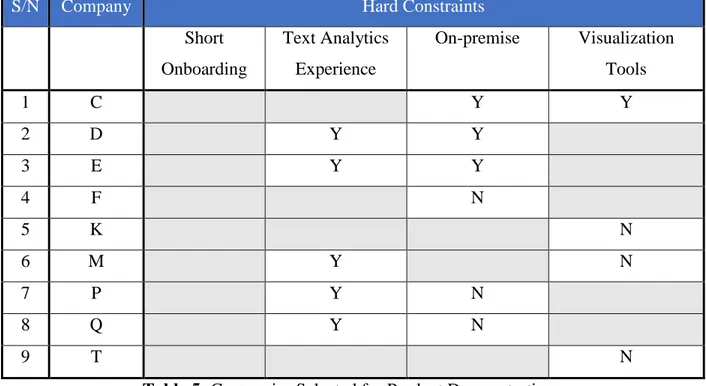
The vendor evaluations for those chosen for product demonstrations are as shown in Table 5.
The rating legend is as follows: Y – Yes
N – No
33
S/N Company Hard Constraints
Short Onboarding Text Analytics Experience On-premise Visualization Tools 1 C Y Y 2 D Y Y 3 E Y Y 4 F N 5 K N 6 M Y N 7 P Y N 8 Q Y N 9 T N
Table 5: Companies Selected for Product Demonstrations
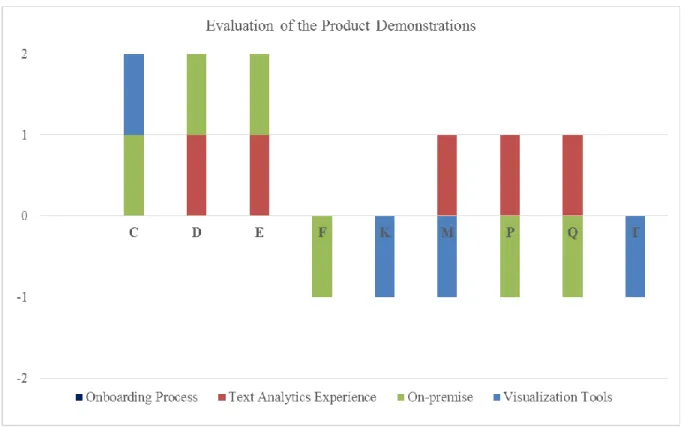
The graphical representation of the product demonstrations is as shown in Figure 3. Yes was denoted as a +1, No was denoted as -1, and blank was denoted as 0.
34
Figure 3: Results of the Product Demonstrations
3.3 Vendor Selection
With the addition of the two hard constraints, only three companies had the relevant capabilities needed to proceed to the next step of the evaluation process. Step 3 was intended to demonstrate the viability of the external solution on Dell data. Of the three companies, C, D, and E, two companies were discovered close to the end of the project, and were reserved for future work. Company D was selected for development of a proof-of-concept model. The external vendor evaluation process is as shown in Figure 4.
Figure 4: External Vendor Evaluation Process 31 companies
researched
20 companies
contacted 9 demos scheduled
1 company selected
35
3.4
Model Development Process
Company D was selected to develop a proof-of-concept model for root cause analysis using Dell’s call logs. Model development was a collaborative process between the quality team, the quality tools team, the product strategy team, and the team at company D.
3.4.1 Input Dataset
A dataset had to be chosen for the proof-of-concept model. Based on conversations with the quality team, the product line with the most number of contacts was selected. Within this product line, the quality team recommended providing a month of call logs based on their experience with past projects. A month of call logs was approximately 10,000 to 15,000 logs. Company D was therefore provided one month of call logs for the product line with the most number of customer contacts.
3.4.2 Execution Phases
The internal teams created well defined milestones for the development of the model in collaboration with Company D. The model development was broken into three phases with deliverables at the end of each phase. Each phase was expected to take no more than three weeks. The details of each phase are as follows:
- Phase 1: Call categorization without training on known categories – The intent of the first phase was to observe how well the solution categorized calls, with no information on
36
the categories used by Dell. The deliverable for this phase was a category (or label) for each call log.
- Phase 2: Call categorization with training on known categories – The intent of this phase was to train and test the solution on known categories. The categories were known because the results of the manual categorization process were available for these logs. The model would train on 50% of the call logs and be tested on the remaining 50% of the logs. The external solution’s results would be compared against the categories obtained from manual categorization. The manual categorization was assumed to be correct. Based on past experience, the quality team and quality tools team set the desired accuracy of the model to 65% on 100% of the call logs (or corpus). The model would need to meet this accuracy to be considered for production deployment.
- Phase 3: Call categorization with training on known categories and testing on new
data – The intent of this phase was to test the solution on call logs that had not been
categorized using manual categorization. The call logs that were being tested, therefore, did not have a label from the manual categorization process. This scenario accurately represented the use-case in which the model would be used over the long-term.
For each phase, a different month of call logs was used from Fiscal Year 2017. Fiscal Year at Dell starts in February and ends in January. The first month of call logs was used to categorize calls without any training, the second month of call logs was used to train and test the model, and the third month of call logs was used solely to test the model.
37 3.4.2 Model Development
Company D, the external vendor chosen for developing the proof-of-concept model, was provided the call logs from Dell. The initial results from Phase 1 showed that Company D’s solution was not only able to display call categories but also provide information on the sub-categories under each category. However, these results were displayed for the dataset as a whole and not for each call log. There was, therefore, no direct connection between the call log and the assigned category. This is a drawback because this relationship is used to trace the category to a call log if more context is needed around what the issue is. Without information on which call logs fall under which category, it would not be possible to trace the details of the call.
Company D started Phase 2 using a month of call logs, the categories for which were available through manual categorization. Half the call logs were used to train the model, while the other half were used to test the model. The results showed that the Company D’s solution could not train on Dell’s call categories. This could be because the solution was searching for specific words in the call log and using the results of the search to assign a category. Because the solution probably did not use the training data set, and instead generated its own categories, the categories generated by the model were fundamentally different from the ones generated by Dell. Further, because the categories were different, it was not possible to compare the results from the external model with that from manual categorization. With extensive customization, it may have been possible to align categories. This would however have required a significant investment of resources and time from the internal teams at Dell. The effort was therefore stopped here, and did not proceed to Phase 3.
38 3.5 Model Development Results
The results of the proof-of-concept model showed that Company D was not able to align call categories with that of the manual categorization process. The internal teams, therefore, decided not to proceed to Step 4, which would have involve development of a production model for internal deployment. No companies were selected for development of a production model.
3.6 Insights from External Vendor Evaluation
Many external companies specialize in developing solutions for text analytics in the customer support space. While some companies use artificial intelligence based techniques, a few others use search algorithms to identify call categories. Some solutions were capable of detecting categories but were not able to link the category to the call log. Some other vendors required extensive customization which needed a large commitment from internal teams in terms of resources and time.
Based on the results from the vendor evaluation, it was concluded that external vendor technologies do not meet the needs of Dell for this specific use-case at this time. New features or technologies could change this landscape in the future.
39
Chapter 4
Internal Model Development
An internal model was explored to perform root cause analysis using artificial intelligence techniques. The intent behind developing a model internal to Dell was to evaluate whether it would be possible to use Open Source algorithms to perform root cause analysis. The internal model development and the external vendor evaluation happened concurrently. The internal model would be compared against the models available from external vendors to make a recommendation on which model to use for a full scale production deployment.
Predicting the root cause of a call is a classification problem under supervised machine learning. Root cause analysis involves two main steps. First, the text needs to be parsed to pick up words of interest while ignoring irrelevant words. Second, a prediction model needs to be employed to categorize or tag a call using the call log. For the first step, a natural language processing model will be used to understand words, identify the stem of the word, remove words that are not relevant, and to form a collection of words. For the second step, a machine learning model will be employed on this collection of words to predict what the call category is. Specifically, the machine learning model will train on a subset of call logs for which the categories are already known from manual categorization. These logs are also referred as the labeled training logs. The trained model will then be tested against the remaining subset of logs to predict their call category. These prediction will be compared against the results from the manual categorization to evaluate how good the model is. Based on their past experience, the quality team and the quality
40
tools team set the desired accuracy of the model to 65% on 100% of the call logs (or corpus). The model training and testing process is as shown in Figure 5.
4.1
Input Dataset
The first step in building an internal model was selecting a product line from the several product lines at Dell. After examining the number of contacts, the product line with the most number of customer contacts was chosen. Within this product line, a decision had to be made on how many call logs would be use for model training and testing. Based on past experience, the quality team recommended a month of call logs which was approximately 10,000 to 15,000 logs. The manual categorization only tagged a subset of these phone calls. Call logs with no manual categorization were eliminated, thus reducing the number of call logs to approximately 9000 logs. The database with the customer support agent notes was queried, and the results were obtained in Excel format.
Call logs
Manual
Categorization Call logs | Categories Top call drivers
Train Model Other half of
categorized call logs Half of categorized call logs Test Model Step 1 Step 2 Target accuracy is 65%
41
4.2
Model Development Process
Existing models at Dell were examined to see if any could be used as a baseline for this project. Building on top an existing model would provide two benefits: (i) this project would be integrated into other work at Dell thus making the model more accessible to teams in the company, and (ii) this would reduce the need to build a model from scratch and hence reduce repetitive work.
The quality tools team had developed a natural language processing and machine learning model a few years ago. This model was intended to be a proof-of-concept model to analyze hard calls and was not in use anymore. Because many parts of this model could be leveraged for this project, this model was deemed to be a good fit and was used as a starting point.
4.2.1 Existing Model Overview
The quality tools team was seeking a solution that included a natural language processing library as well as a machine learning library when they were exploring possible options for analyzing hard calls. In addition, the team had three main criteria for choosing a platform for their model:
a. The platform had to be an actively managed open-source project. This would avoid the need to license software.
b. The platform would need to integrate with the existing tools at Dell.
c. The platform had to offer good performance given the volume of call logs that need to be processed.
42
a. Waikato Environment for Knowledge Analysis (WEKA) – WEKA provides a collection of machine learning libraries for data mining tasks [35]. This platform was well established, provided several options for model building, and had a robust implementation of machine learning algorithms. The software, however, was difficult to port, lacked easy integration, and did not hold up well on large data sets.
b. Natural Language Toolkit (NLTK) – NLTK provides a platform for building programs to work with human language data [36]. This platform is actively developed, provides a rich natural language processing library, and has a relatively simple application program interface. The software, however, lacked easy integration with internal tools, did not provide good performance, and did not provide support beyond simple classification algorithms.
c. Unstructured Information Management Applications (UIMA) – UIMA provides a platform for analyzing unstructured content such as text, audio, and video [37]. This platform has a well-defined architecture, can be used for managing all unstructured data, and supports multiple components for classification. The software, however, has a large overhead for setup, does not provide good visibility into internal functionality, and would pose hardware requirements given its sheer size.
d. Stanford CoreNLP – CoreNLP provides a set of natural language processing tools [6]. This platform supports a standalone server model, provides multi-language support, and offers good performance. The software, however, requires the GNU General Purpose License (GNU GPL) which is restrictive and has implications for commercial use.
e. Apache OpenNLP – OpenNLP provides a machine learning based toolkit for processing natural language text [7]. This platform provides robust libraries for natural language
43
processing and machine learning, offers a rich set of features, and is available under the Apache license. The software, however, didn’t offer the best performance in some cases. Based on the five libraries that were examined, Stanford CoreNLP and Apache OpenNLP were the top two choices. Because the Apache license has fewer restrictions than the GPL license, and most other features were comparable between the two libraries, Apache Open NLP was chosen for model development.
Apache OpenNLP is a publicly available library which supports a variety of tasks including tokenization, sentence segmentation, part-of-speech tagging, entity extraction, chunking, parsing, and co-reference resolution. The library also provides maximum entropy based machine learning. All these functionalities are available through their application programming interface (API).
The quality tools team developed their model using the Microsoft Visual Studio Integrated Development Environment (IDE) [38] and the Microsoft C# programming language [39].
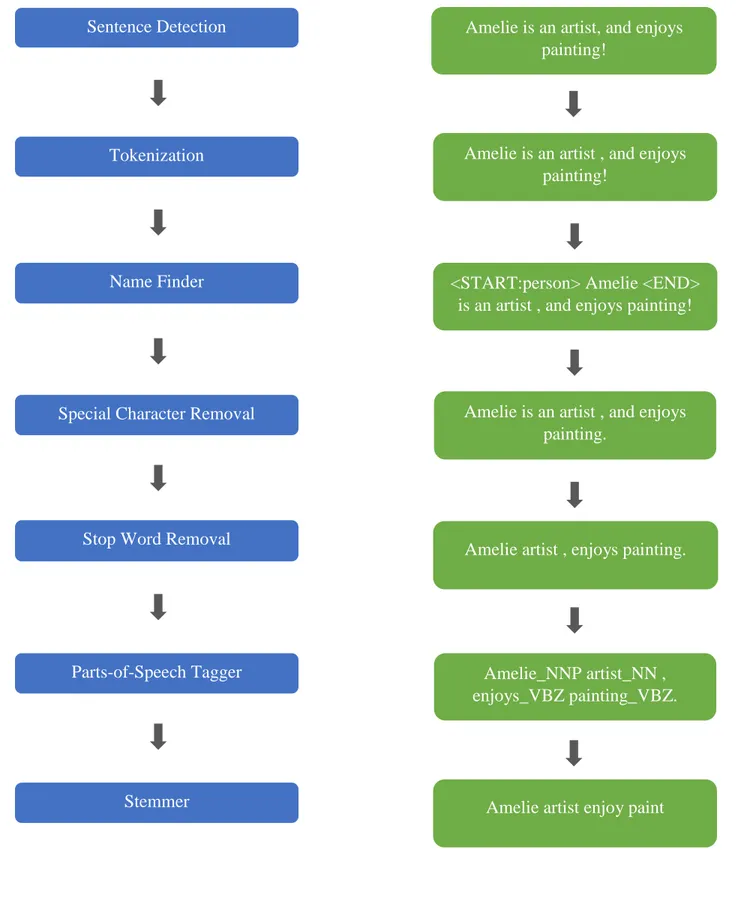
The first step in processing call logs is sentence detection. The OpenNLP sentence detector uses punctuation characters to identify where a sentence ends. Once the sentence boundaries are identified, the OpenNLP tokenizer breaks the character sequence into pieces, or tokens. Tokens can be loosely thought of as words or terms such as punctuations. For example, when a Whitespace tokenizer is used, non-whitespace sequences are identified as tokens. The tokens are then passed to the OpenNLP Name Finder which detects named entities in tokens, and removes them. Special characters are then stripped from each token, before comparing each word to a set list of stop words. Stop words are a user generated list of words that are not relevant for text analysis. Examples include prepositions and pro-nouns such as of, for, then, her, their, and so on. Stop words are then removed from the token, and the token is passed to the OpenNLP Parts-of-Speech
44
tagger. This tagger parses the given text and assigns parts of speech to each word based on the form the word assumes. For example, the word duck could be a noun when referring to the bird or a verb when referring to the action. The tagged text is then handed to a stemmer, such as the Porter stemmer [40], which is used to transform the words into their stems. Stemming identifies words with similar meaning by removing the suffixes associated with the word. For example, the words
connect, connecting, and connected have a common stem connect and have similar meanings. The
resulting stemmed tokens are added to a training array. The steps involved in processing the call logs are as shown on the left side of Figure 6. An example is as shown on the right side of Figure 6. The example text is ‘Amelie is an artist, and enjoys painting!’.
45 Sentence Detection
Tokenization
Name Finder
Special Character Removal
Stop Word Removal
Parts-of-Speech Tagger
Stemmer
Amelie is an artist, and enjoys painting!
Amelie is an artist , and enjoys painting!
<START:person> Amelie <END> is an artist , and enjoys painting!
Amelie is an artist , and enjoys painting.
Amelie artist , enjoys painting.
Amelie_NNP artist_NN , enjoys_VBZ painting_VBZ.
Amelie artist enjoy paint
46
This training array is passed to a maximum entropy classification machine learning model. Maximum entropy is a methodology for estimating probability distributions from data [41]. The basic principle behind this technique is that when no data is available, the probability distribution should be as uniform as possible. Labeled training data is used to derive a set of constraints that characterize the expectations from the distribution. The iterative algorithm finds the maximum entropy distribution given these constraints. The inputs to the algorithm consist of the training array which was made up of call logs, meta-data such as product family, and the labeled category. The testing dataset is processed the same way as the training dataset, as shown in Figure 6.
4.2.2 Model Configuration Parameters
The model includes compile time parameters to specify options such as the number of call logs and the number of categories. The following knobs are available:
- Training size – This is the minimum number of call logs to pick up from each call category. This was set to twenty based on past projects at Dell.
- Minimum category count – The minimum number of call logs needed for a category to be included in the training set. If a category had fewer logs than this count, it was not included. Based on past projects at Dell, this was set to twenty.
- Number of logs – This was the number of logs to select for each category. This was to ensure that the training set was not skewed towards the most represented sample. Based on past projects at Dell, this was set to the minimum of [200 samples or maximum of (number of call logs/4 or training size)].
47
- Minimum confidence – This specified the confidence threshold above which the model could output its prediction for a call log. This was set to 5%. The higher the confidence threshold, the higher the accuracy on a smaller set of corpus. The lower the confidence threshold, the lower the accuracy on a larger set of corpus.
4.2.3 Model Development
The model development process began by modifying the existing code for soft call root cause analysis. Code modifications involved changing where the data was pulled from, modifying how it was processed, and changing the output format.
The database with the customer support agent notes was queried, and the results were obtained in Excel format. The Excel file was formatted to have the following pieces of information:
- Call ID, Product family and Title of the call. The Title is a brief description of the call. - Call text documented by the customer support agent.
- Call categories generated from manual categorization. As discussed in Section 2.3, calls are categorized into anywhere from one to eleven categories based on their content. Each call then is assigned a final category from picking the first (by sequence) of the eleven categories. The total number of categories associated with a log can therefore be twelve. The code was modified to take in relevant fields from the Excel file and populate data structures with this information. All associated functions were modified to use the twelve categories corresponding to each soft call. Lastly, the output of the model was modified to display the call logs where the model and the manual categorization differed as well as to include the accuracy, precision, and recall for each category.
48 4.2.4 Model Accuracy Threshold
Based on the threshold set by the quality and the quality tools team, the desired accuracy of the model was 65% on 100% of the call logs (or corpus). Accuracy is computed as follows:
Accuracy = Count of correctly identified call logs/Total number of call logs
An accuracy below the specified threshold would not be acceptable, and would render the model incapable of further use.
4.3
Initial Accuracy of Model
The model was run using the chosen dataset, which was one month of call logs on the product line with the most number of contacts. To simplify the debug process, a week of call logs was chosen as a starting point. Because the model was not trained on categories with fewer than twenty call logs, the model had incorrect predictions if those call categories were in the testing set. The initial accuracy of the model after the modifications were made for the soft call use-case was 64%. This will be referred to as the initial accuracy.
4.4
Model Refinement Process
To improve the accuracy of the model, call logs with mismatching call categories were examined. Reading the call logs provided information on why the model chose the category it did. Based on these observations, the code was modified and the model was re-run to compute the new accuracy. This was an iterative process. The sub-sections below discuss the various iterations.
49 4.4.1 Uniform Use of Case
The manual categorization was insensitive to case and did not uniformly use the same case. For example, some call logs were categorized as “Microsoft Office” while a few others were categorized as “microsoft office”. The model correctly identified the category, but used either case based on the text in the log. When the model used the lower case and the call was tagged using upper case, or vice-versa, the model marked that call as an incorrect prediction. By standardizing the case used in the manual categorization, the model correctly predicted the category a higher number of times, thus increasing its accuracy to 66%.
4.4.2 Manual Categorization Error
In some instances, the model was tagging the call logs correctly, even though it didn’t match the results from the manual categorization. Examining the methodology for manual categorization revealed that there was an error in the formulas used to categorize the call. Once this error was fixed, the manual categories were updated. The model was re-run but there was no significant change to the accuracy. There are a few possible reasons - only a few logs were affected by this change, or the model predictions were incorrect in both scenarios, or the number of newly predicted correct tags were offset by the number of newly predicted incorrect tags.
4.4.3 Match against All Manual Categories
For some call logs, both, the manual category and the category predicted by the model were correct. For example, a customer call regarding a driver issue after looking through existing
50
documentation and not finding a solution, could be categorized as a driver issue or as a documentation issue. Both would be correct because making relevant changes to either would prevent future calls regarding this issue. In these cases, picking one final category is tricky. The manual categorization methodology categorizes calls into eleven possible categories from the thirty total categories, and picks the first category as the final category. In the above example, the call log would be categorized as driver issue and documentation issue. However, because the first category in this case is driver issue, the final category assigned to the call log would be driver
issue. This selection is arbitrary. If the model chose documentation issue, the result should still be
marked as a correct prediction.
The code was modified so that the training set remained unaltered, but the testing set contained all eleven categories along with the final category. If the model’s categorization matched any of the eleven categories, the result was marked as correctly predicted. When the model was re-run, the accuracy increased to 72%.
4.4.4 Removal of Digits
Call logs contain digits such as phone numbers of the Dell customer service line. These numbers are not relevant to call categorization. The model was modified to strip out the digits from the customer call and re-run. The model accuracy increased by 0.5%.
51
Figure 7: Improvement of Accuracy with Each Model Refinement
4.5
Final Accuracy of the Model
After the model refinements were complete, the dataset was changed to a month of call logs. When the model was run on this dataset, the accuracy of model was 72.4%, which was well above the acceptable threshold of 65%.
Precision and recall were computed for each category. Precision is a measure for how many of the selected items are relevant, while recall is a measure for how many of the relevant items are selected [42]. Precision and recall are computed as shown below:
Precision = Count of correctly identified instances/Total number of identified instances
52
The precision and recall for each category, expressed as a percentage, is as shown in Figure 8.
Figure 8: Precision and Recall for Each Call Category
The number at the top of each bar represents the number of call logs for that category, after applying the Number of logs parameter, as discussed in Section 4.2.2. The graph is sorted by the number of call logs used for training starting with the highest number on the left and ending with the lowest on the right.
Recall and precision correlate with the number of samples in most instances. The higher the number of samples, the higher the precision and recall. The categories where there is an anomaly are k and l. There is a sharp drop in the precision and recall for Category k despite the