DEVELOPMENT OF A SEAMLESSLY INTEGRATED FACTORY
PLANNING SOFTWARE TOOL (PROTOTYPE) TO EVALUATE
AND OPTIMIZE SURFACE MOUNT MANUFACTURING LINES
By: Vijay Mehra
B.S. Operations Research and Industrial Engineering -- Cornell University (1990)
B.A. Economics -- Cornell University (1990)
Submitted to the Departments of Management
and
Civil & Environmental Engineering (Intelligent Engineering Systems Laboratory) In Partial Fulfillment of the Requirements for the Degrees of
MASTER OF SCIENCE IN MANAGEMENT and
MASTER OF SCIENCE IN CIVIL AND ENVIRONMENTAL ENGINEERING
at the
MASSACHUSETTS INSTITUTE OF TECHNOLOGY May 1995
© Massachusetts Institute of Technology, 1995. All rights reserved A, Signature of Author Certified by Certified by Accepted by Accepted by
MIT Sloat /Sool of Management (Manufacturing Track) Department of Civil & Environmental Engineering (Intelligent Engineering Systems Laboratory) May, 12 1995
_--Professor Johfn Wiliams nt of Civil &-Environmental Engineering
(Intelligent Engineering Systems Laboratory)( Thesis Supervisor
.rofessor Larry Wein MIT Sloan School of Management
Professor Joseph M. Sussman Graduate Officer Department of Civil and Environmental Engineering
11
I Jeffrey A. Barks Associate Dean, Sloan Mast r' And Bachelor's ProgramMASSACWNi7sin mrar
JUN
21
1995
LIBRAHIt:
A
R
K
;·'''-Abstract
DEVELOPMENT OF A SEAMLESSLY INTEGRATED FACTORY
PLANNING SOFTWARE TOOL (PROTOTYPE) TO EVALUATE AND
OPTIMIZE SURFACE MOUNT MANUFACTURING LINES
By Vijay Mehra
Submitted to the Departments of Management
and
Civil & Environmental Engineering (Intelligent Engineering Systems Laboratory) on May 12, 1995
In Partial Fulfillment of the Requirements for the Degrees of Master of Science in Management
and
Master of Science in Civil and Environmental Engineering ABSTRACT
Surface Mount Technology (SMT) has revolutionized manufacturing in the electronics industry and lies at the core of most electronics component assembly lines today. An SMT line might comprise of a combination of the following operations (which are typically linked by an automated conveyor):
* Solder paste application
* High-speed automated assembly
-- "Common" size/shape components -- "Odd" size/shape components
* Manual assembly * Thermal treatment * Component test * Unit assembly * Unit test * Unit pack * Unit shipment
Each of the above operations might be accomplished by using one or more types of equipment and each operation on each piece of equipment could typically constitute from anywhere between one to ten and one to a thousand sub-steps.
Needless to say, the sheer number of total steps and sub-steps (and their
interdependencies) that need to be accounted for from the beginning to the end of the line is overwhelming and any attempt to evaluate the performance of a given line (in terms of expected throughput, expected bottlenecks, expected WIP, etc.) will have to use
sophisticated stochastic simulation tools in order to generate accurate and meaningful results. These tools emulate important attributes of an SMT line such as:
* The steps and sub-steps of each operation.
* The interdependencies between each of the operations.
* The expected failures/down times corresponding to each operation and the
subsequent impacts on upstream and downstream operations.Development of a Seamlessly Integrated Factory Planning Software Tool (Prototype) to Evaluate and Optimize Surface Mount Manufacturing Lines Page 2
Abstract
* The flow of product from one operation to another.
* The setup times (for each operation) when the line has to change from one product to another product.
However, even the most popular commercially available simulation tools that are used in the industry today have significant learning curves associated with them. To climb these learning curves takes a significant amount of time and effort and hence it is typical for a select group of people within an organization to develop this functional expertise and become "simulation experts". The line managers and engineers -- who need to
periodically assess the performance of their lines and determine what changes need to be made to line layouts, product mixes and process flows to enhance line performance --have to therefore hire the experts in order to use simulation tools to evaluate their manufacturing environments. This process takes time (each simulation effort is
undertaken as a "mini-project"), is costly (the manager has to bear the project costs) and it can even come in the way of managers resorting to the use of simulation tools to evaluate their manufacturing environments.
This thesis aims at enabling line managers/engineers to directly evaluate the performance of their lines by providing them with a software tool to seamlessly configure, execute and evaluate complex stochastic simulation models representing their manufacturing environments. This tool (referred to as the Prototype Factory Planning Tool) will thereby transparently bring stochastic simulation into frequent use. It will transform stochastic simulation into an enabling technology used by managers when they are faced with critical decisions (pertaining to line layouts, product mixes, process flows, etc.) in order to evaluate and optimize the performance of their manufacturing lines.
In addition, this thesis also addresses the software requirements and software architecture pertaining to the enhancement of the Prototype Factory Planning Application into a full-blown version. The latter application will permit the user to evaluate the line
performance against product cost and product quality metrics in addition to the
throughput related metrics available in the prototype application. (The latter application was not developed during the author's internship since it is a multi-person, multi-year effort and is hence beyond the scope of his thesis).
Thesis Supervisor: Professor John Williams
Title: Associate Professor of Civil & Environmental Engineering
Development of a Seamlessly Integrated Factory Planning Software Tool (Prototype) to Evaluate and Optimize Surface Mount Manufacturing Lines Page 3
Table of Contents
TABLE OF CONTENTS
1.0 INTRODUCTION ... 14
1.1 Problem Description ... 14
1.2 Thesis Goal ... 19
1.3 Thesis Layout -- "Top-Down" Approach ... . 20
2.0 ACKNOW LEDGMENTS ... 22
3.0 THESIS METHODOLOGY ... .... ... 24
3.1 Chapter Overview ... 24
3.2 Gathering the Voice of the Customer ... . 24
3.3 Literature Search/Industry Benchmark ... . 25
3.3.1 Research Work at Some Universities/Corporations... 25
3.3.2 Commercially Available Software Applications... ... 27
3.3.3 SEMATECH Efforts Relevant to Thesis Topic... 29
3.4 Determination of Pilot Customer Site... ... 30
3.5 Overview of Primary Iterative Processes... ... 31
3.5.1 Periodic Meetings -- Continuous Feedback from Customers 31 3.5.2 Weekly Team Meetings -- "Yo One"... 33
3.5.3 Dissemination of Project Information... 33
3.5.4 Project Schedule Methodology... 34
4.0 THESIS RESULTS ... 36
4.1 Chapter Overview... ... 36
4.2 Manufacturing Scenario Planning ... ... 36
4.2.1 Four Scenarios Seamlessly Configured and Evaluated ... 37
4.2.2 Cycle Time Reduction... ... 39
4.3 Platform for Future Factory Planning Software Tools... 39
5.0 SOFTWARE REQUIREMENTS (HIGH LEVEL)... 40
5.1 Chapter Overview... 40
5.2 Introduction... 40
5.2.1 Purpose... 40
5.2.2 Scope... 41
5.2.3 Definitions, Acronyms and Abbreviations... 41
5.2.4 References... 42 5.2.5 Overview... 42 5.3 General Description... 43 5.3.1 Product Perspective... ... 43 5.3.2 Product Functions... ... 43 5.3.3 User Characteristics... 44 5.3.4 General Constraints... ... 44
5.3.5 Assumptions and Dependencies... 45
Development of a Seamlessly Integrated Factory Planning Software Tool (Prototype) to Evaluate and Optimize Surface Mount Manufacturing Lines Page 4
Table of Contents 5.4 Specific Requirements... 45 5.4.1 Functional Requirements... 45 5.4.1.1 Line Layout... ..0. 45 5.4.1.1.1 Introduction... 45 5.4.1.1.2 Inputs... ... 45 5.4.1.1.3 Processing... ... 46 5.4.1.1.4 Outputs ... 46 5.4.1.2 Line Evaluation... .. ... 46 5.4.1.2.1 Introduction... 46 5.4.1.2.2 Inputs... ... 47 5.4.1.2.3 Processing ... ... 49 5.4.1.2.4 Outputs... ... 49
5.4.1.3 Board Assignment to Lines... . 50
5.4.1.3.1 Introduction... 50
5.4.1.3.2 Inputs ... 50
5.4.1.3.3 Processing ... ... 50
5.4.1.3.4 Outputs... ... 51
5.4.1.4 Board Family Generation... 51
5.4.1.4.1 Introduction... 51 5.4.1.4.2 Inputs... ... 51 5.4.1.4.3 Processing... ... 51 5.4.1.4.4 Outputs ... 52 5.4.1.5 Board Sequencing ... 52 5.4.1.5.1 Introduction... 52 5.4.1.5.2 Inputs ... 52 5.4.1.5.3 Processing... ... 52 5.4.1.5.4 Outputs ... 52
5.4.1.6 Front End Throughput Optimization... 52
5.4.1.7 Scenario and Data Editing... 53
5.4.1.7.1 Introduction... 53
5.4.1.7.2 Inputs... ... 53
5.4.1.7.3 Processing ... 54
5.4.1.7.4 Outputs... ... 54
5.4.2 External Interface Requirements... ... 55
5.4.2.1 User Interfaces... .. ... 55
5.4.2.2 Software Interfaces... ... 55
5.4.2.3 Communications Interfaces... 55
5.4.3 Design Constraints... 56
5.4.4 Other Requirements... 56
Development of a Seamlessly Integrated Factory Planning Software Tool (Prototype) to Evaluate and Optimize Surface Mount Manufacturing Lines Page 5
Table of Contents
6.0 SOFTWARE ARCHITECTURE (HIGH LEVEL)... ... 57
6.1 Chapter Overview... 57
6.2 Architecture Requirements... 57
6.3 Architecture Assumptions... 57
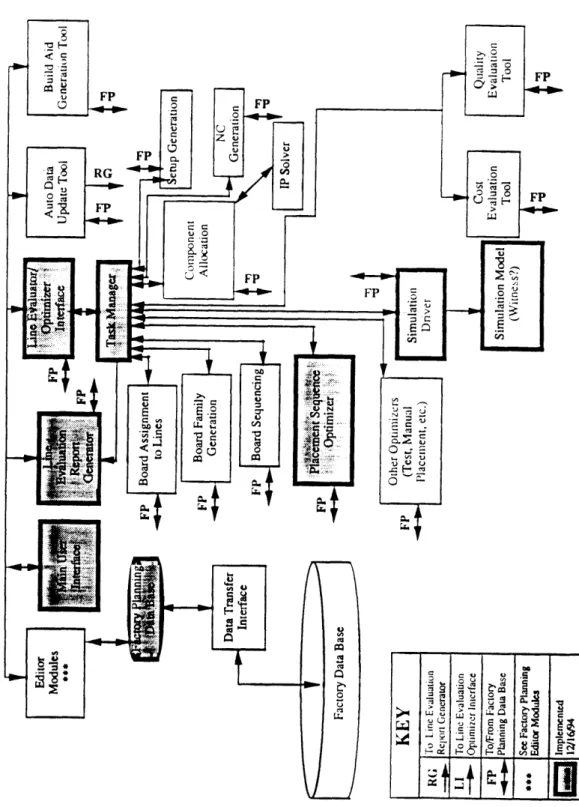
6.4 Software M odules... ... 58
6.4.1 Main User Interface... ... 60
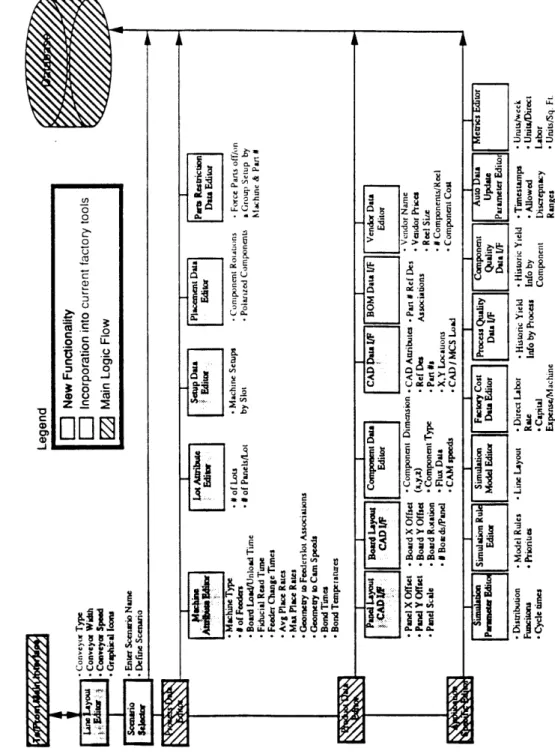
6.4.2 Editor Modules... ... 60
6.4.3 Line Evaluator/Optimizer Interface... 62
6.4.4 Task M anager ... 62
6.4.5 Board Assignment to Lines... 63
6.4.6 Board Family Generation... 63
6.4.7 Board Sequencing ... 64
6.4.8 Component Allocation... ... 64
6.4.9 Placement Sequence Optimizer... 65
6.4.10 Simulation Driver... ... 65
6.4.11 Simulation Model (Witness)... ... 66
6.4.12 Line Evaluation Report Generator... 67
6.4.13 Cost Evaluation Tool... ... 67
6.4.14 Quality Evaluation Tool... ... 68
6.4.15 Integer Programming Solver... 68
6.4.16 NC Generation... 69
6.4.17 Setup Generation... ... 69
6.4.18 Data Transfer Interface... ... 70
6.4.19 Factory Planning Data Base... 70
6.5 Software Modules Developed for Pilot Application... 71
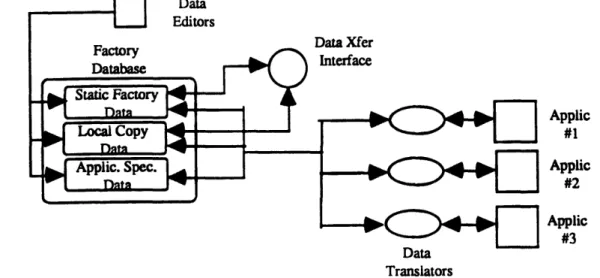
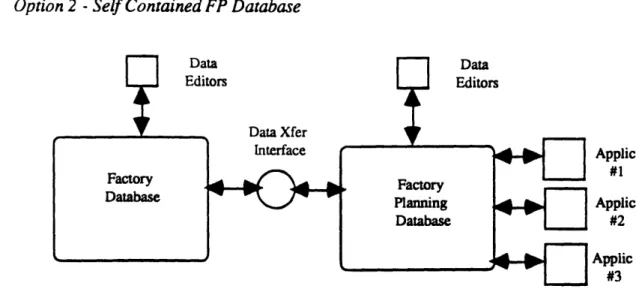
6.6 Architectural Issues Pertaining to the Factory Planning Data Base... 71
7.0 SOFTWARE REQUIREMENTS (SIMULATION DRIVER)... 77
7.1 Chapter Overview ... 77
7.2 Introduction... 77
7.2.1 Purpose... 77
7.2.2 Scope ... 77
7.2.3 Definitions, Acronyms and Abbreviations... 78
7.2.4 References... ... 78 7.2.5 Overview... 78 7.3 General Description... 79 7.3.1 Product Perspective... 79 7.3.2 Product Functions... 79 7.3.3 User Characteristics ... 82 7.3.4 General Constraints... 82
7.3.5 Assumptions and Dependencies... ... 82
7.4 Specific Requirements ... 82
7.4.1 Functional Requirements... 83
7.4.1.1 Line Configuration Data Reading Function... 83
7.4. 1.1.1 Introduction... ... 83
7.4.1.1.2 Inputs... ... 83
7.4.1.1.3 Processing ... 83
7.4.1.1.4 Outputs... 83
Development of a Seamlessly Integrated Factory Planning Software Tool (Prototype) to Evaluate and
Table of Contents
7.4.1.2 Production Data Definition Function... 84
7.4.1.2.1 Introduction... 84
7.4.1.2.2 Inputs... 84
7.4.1.2.3 Processing... 86
7.4.1.2.4 Outputs... ... 86
7.4.1.3 Simulation Model Configuration & Execution Function ... ... 86
7.4.1.3.1 Introduction... ... 86
7.4.1.3.2 Inputs... 86
7.4.1.3.3 Processing... ... 90
7.4.1.3.4 Outputs... ... 90
7.4.1.4 Line Evaluation Report Configuration Function... 90
7.4.1.4.1 Introduction... ... 91
7.4.1.4.2 Inputs ... 91
7.4.1.4.3 Processing ... 91
7.4.1.4.4 Outputs... ... 91
7.4.1.5 Oracle Communication Logon Function... 91
7.4.1.5.1 Introduction... ... 91
7.4.1.5.2 Inputs... 91
7.4.1.5.3 Processing... 91
7.4.1.5.4 Outputs... ... 91
7.4.1.6 Oracle Communication Logoff Function... 92
7.4.1.6.1 Introduction... ... 92
7.4.1.6.2 Inputs ... 92
7.4.1.6.3 Processing... ... 92
7.4.1.6.4 Outputs ... 92
7.4.1.7 Integer Conversion to ASCII String Function... 92
7.4.1.7.1 Introduction... ... 92
7.4.1.7.2 Inputs ... 92
7.4.1.7.4 Processing... ... 93
7.4.1.7.4 Outputs... ... 93
7.4.1.8 Reverse String Function... 93
7.4.1.8.1 Introduction... ... 93
7.4.1.8.2 Inputs... ... 93
7.4.1.8.3 Processing ... ... 93
7.4.1.8.4 Outputs... ... 93
7.4.1.9 Retrieve Route Cycle Time Data Structure Information Function... 94
7.4.1.9.1 Introduction... ... 94
7.4.1.9.2 Inputs... ... 94
7.4.1.9.3 Processing ... ... 94
7.4.1.9.4 Outputs... ... 95
Development of a Seamlessly Integrated Factory Planning Software Tool (Prototype) to Evaluate and Optimize Surface Mount Manufacturing Lines Page 7
Table of Contents
7.4.1.10 Comparison of Records (by production sequence)
in the Product Information Data Structure ... 95
7.4.1.10.1 Introduction... ... 95
7.4.1.10.2 Inputs... ... 95
7.4.1.10.3 Processing ... ... 95
7.4.1.10.4 Outputs... 95
7.4.1.11 Comparison of Records (by process step) in the Temporary Data Structures... 95
7.4.1.11.1 Introduction... ... 95
7.4.1.11.2 Inputs ... 96
7.4.1.11.3 Processing ... 96
7.4.1.11.4 Outputs... 96
7.4.1.12 Build Routing/Cycle Time File Function... 96
7.4.1.12.1 Introduction... ... 96
7.4.1.12.2 Inputs... ... 96
7.4.1.12.3 Processing ... 96
7.4.1.12.4 Outputs... 97
7.4.1.13 Build Production Order File Function... 97
7.4.1.13.1 Introduction... ... 97
7.4.1.13.2 Inputs ... ... 97
7.4.1.13.3 Processing... 98
7.4.1.13.4 Outputs ... 98
7.4.1.14 Build ASCII File Function... 98
7.4.1.14.1 Introduction... ... 98
7.4.1.14.2 Inputs ... ... 99
7.4.1.14.3 Processing... 99
7.4.1.14.4 Outputs... 110
7.4.1.15 Run Simulation Function... 110
7.4.1.15.1 Introduction... 110
7.4.1.15.2 Inputs ... ... 110
7.4.1.15.3 Processing... 111
7.4.1.15.4 Outputs ... 111
7.4.1.16 Extract Results Data Function... 111
7.4.1.16.1 Introduction... 111
7.4.1.16.2 Inputs ... ... 111
7.4.1.16.3 Processing... 111
7.4.1.16.4 Outputs ... 111
7.4.1.17 Store Report Data in Data Base Function... 112
7.4.1.17.1 Introduction ... 112
7.4.1.17.2 Inputs... 112
7.4.1.17.4 Processing... 112
7.4.1.17.4 Outputs ... 112
Development of a Seamlessly Integrated Factory Planning Software Tool (Prototype) to Evaluate and
Table of Contents
7.4.2 External Interface Requirements... 112
7.4.2.1 User Interfaces ... 112
7.4.2.2 Software Interfaces... 112
7.4.2.3 Communications Interfaces... 113
7.4.3 Design Constraints ... 113
8.0 SOFTWARE REQUIREMENTS (TASK MANAGER)... 114
8.1 Chapter Overview ... 114
8.2 Introduction... 114
8.2.1 Purpose... ... 114
8.2.2 Scope ... 114
8.2.3 Definitions, Acronyms and Abbreviations... 115
8.2.4 References... 115 8.2.5 Overview ... 115 8.3 General Description ... 115 8.3.1 Product Perspective ... 115 8.3.2 Product Functions ... 116 8.3.3 User Characteristics ... 116 8.3.4 General Constraints ... 116
8.3.5 Assumptions and Dependencies... 117
8.4. Specific Requirements ... 117
8.4.1 Functional Requirements. ... 117
8.4.1.1 Software Execution Function... 117
8.4.1.1.1 Introduction... 117
8.4.1.1.2 Inputs ... 117
8.4.1.1.3 Processing... ... 117
8.4.1.1.4 Outputs ... ... 119
8.4.1.2 Count Scenarios Function... 120
8.4.1.2.1 Introduction... ... 120
8.4.1.2.2 Inputs... 120
8.4.1.2.3 Processing... . 120
8.4.1.2.4 Outputs... ... 120
8.4.1.3 Read Scenarios Function... 120
8.4.1.3.1 Introduction... 120
8.4.1.3.2 Inputs... 120
8.4.1.3.3 Processing... 120
8.4.1.3.4 Outputs... 121
8.4.2 External Interface Requirements... 121
8.4.2.1 User Interfaces... 121
8.4.2.2 Software Interfaces... 121
8.4.2.3 Communications Interfaces... 121
8.4.3 Design Constraints... 121
Development of a Seamlessly Integrated Factory Planning Software Tool (Prototype) to Evaluate and
Table of Contents
9.0 SOFTWARE REQUIREMENTS (USER INTERFACE) ... 123
9.1 Chapter Overview ... 123
9.2 Introduction...123
9.2.1 Purpose ... 123
9.2.2 Scope ... 123
9.2.3 Definitions, Acronyms and Abbreviations... 124
9.2.4 References... 124
9.2.5 Overview ... 124
9.3 General Description... 124
9.3.1 Product Perspective ... 124
9.3.2 Product Modules, Screens and Their Functions... 125
9.3.3 User Characteristics... 127
9.3.4 General Constraints... ... 127
9.3.5 Assumptions and Dependencies... 128
9.4 Specific Requirements ... 128
9.4.1 Functional Requirements... 128
9.4.1.1 Main User Interface Module... 128
9.4.1.1.1 Main Menu Screen... 128
9.4.1.1.1.1 Introduction... 128
9.4.1.1.1.2 Inputs... ... 131
9.4.1.1.1.3 Processing ... 131
9.4.1.1.1.4 Outputs ... 132
9.4.1.2 Line Evaluator/Optimizer Module... 132
9.4.1.2.1 Scenario and Report Selection Screen ... 132
9.4.1.2.1.1 Introduction... 132
9.4.1.2.1.2 Inputs... ... 134
9.4.1.2.1.3 Processing ... 134
9.4.1.2.1.4 Outputs... ... 134
9.4.1.3 Line Evaluation Report Generator Module... 134
9.4.1.3.1 Line Throughput Results Screen... 134
9.4.1.3.1.1 Introduction... 134
9.4.1.3.1.2 Inputs... ... 137
9.4.1.3.1.3 Processing... 137
9.4.1.3.1.4 Outputs... 137
9.4.1.3.2 Product Related Results Screen... 137
9.4.1.3.2.1 Introduction... 137
9.4.1.3.2.2 Inputs... ... 140
9.4.1.3.2.3 Processing ... 140
9.4.1.3.2.4 Outputs... 140
9.4.1.3.3 Machine Related Results Screen... 141
9.4.1.3.3.1 Introduction... 141
9.4.1.3.3.2 Inputs... 143
9.4.1.3.3.3 Processing... 143
9.4.1.3.3.4 Outputs... 143
Development of a Seamlessly Integrated Factory Planning Software Tool (Prototype) to Evaluate and Optimize Surface Mount Manufacturing Lines Page 10
Table of Contents
9.4.1.3.4 WIP Related Results Screen... 144
9.4.1.3.4.1 Introduction... 144
9.4.1.3.4.2 Inputs ... 146
9.4.1.3.4.3 Processing ... 146
9.4.1.3.4.4 Outputs... 146
9.4.1.4 Editor Module... 147
9.4.1.4.1 Scenario Selection Screen... 147
9.4.1.4.1.1 Introduction... 147
9.4.1.4.1.2 Inputs... 149
9.4.1.4.1.3 Processing... 149
9.4.1.4.1.4 Outputs... ... 149
9.4.1.4.2 Scenario Data Editor Screen... 149
9.4.1.4.3 Report Selection Screen... 151
9.4.1.4.3.1 Introduction... 151
9.4.1.4.3.2 Inputs... 153
9.4.1.4.3.3 Processing ... 153
9.4.1.4.3.4 Outputs ... 153
9.4.1.4.4 Line Evaluation Report Configuration Editor Screen... 153
9.4.1.4.4.1 Introduction... 153
9.4.1.4.4.2 Inputs... 156
9.4.1.4.4.3 Processing... 156
9.4.1.4.4.4 Outputs... ... 156
9.4.1.4.5 Line Layout Editor Screen... 156
9.4.1.4.5.1 Introduction... 156
9.4.1.4.5.2 Inputs... 159
9.4.1.4.5.3 Processing... 159
9.4.1.4.5.4 Outputs... ... 161
9.4.1.4.6 Board Assignment to Lines Editor Screen ... 161
9.4.1.4.6.1 Introduction... 161
9.4.1.4.6.2 Inputs... 163
9.4.1.4.6.3 Processing... 163
9.4.1.4.6.4 Outputs... ... 163
9.4.1.4.7 Board Family Setup Editor Screen... 163
9.4.1.4.7.1 Introduction... 163
9.4.1.4.7.2 Inputs... 165
9.4.1.4.7.3 Processing... 165
9.4.1.4.7.4 Outputs ... ... 165
9.4.1.4.8 Board Sequencing Editor Screen... 165
9.4.1.4.8.1 Introduction... 165
9.4.1.4.8.2 Inputs... 167
9.4.1.4.8.3 Processing... 167
9.4.1.4.8.4 Outputs... ... 167
Development of a Seamlessly Integrated Factory Planning Software Tool (Prototype) to Evaluate and
Table of Contents
9.4.2 External Interface Requirements...
9.4.2.1 Software Interfaces...
9.4.2.2 Communications Interfaces...
167 167 167 9.4.3 Design Constraints... 167 10.0 INTEGRATED DATA MODEL FOR PILOT APPLICATION...10.1 Chapter Overview ... 10.2 Business Model (Normalized)...
10.2.1 Entity Attribute Descriptions... 10.3 Data Model for Prototype Application (De-normalized)...
10.3.1 Entity Attribute Descriptions (Database Schema)... 11.0 PROJECT REVIEW AND NEXT STEPS...
11.1 Chapter Overview... 11.2 Strengths and Weaknesses of Project Methodology... 11.3 N ext Steps ... 168 168 169 170 174 175 179 179 179 180
Development of a Seamlessly Integrated Factory Planning Software Tool (Prototype) to Evaluate and
Table of Contents
FIGURES
Figure 1 Causal Loop Diagram Depicting Problem Domain and
Interacting Phenomenons... 16
Figure 2 Feedback at Each production Step... 32
Figure 3 Continuous Feedback During the Software Development Process... 33
Figure 4 Typical Scheduling Methodology for Software Development Projects ... 35
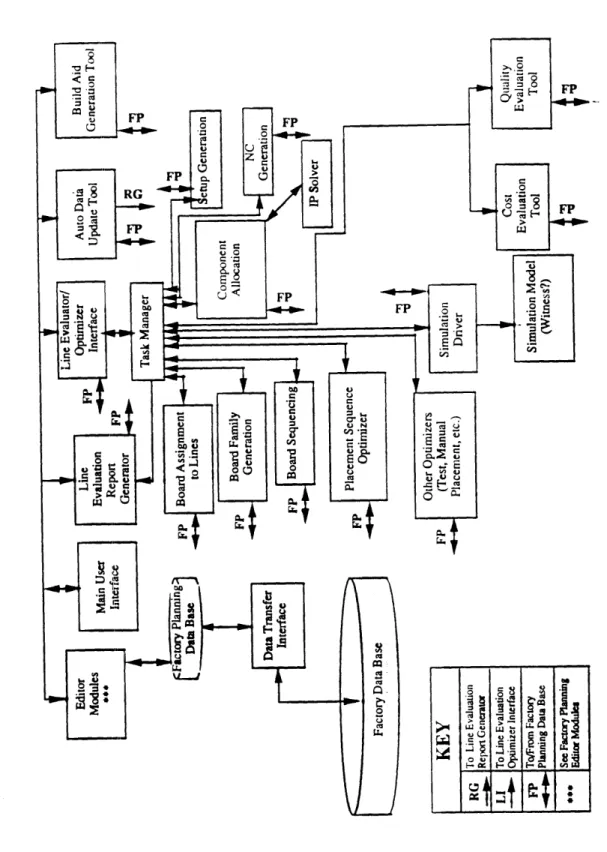
Figure 5 Software Architecture (High Level)... 59
Figure 6 Factory Planning Application Editor Modules... 61
Figure 7 Software Modules Developed for Pilot Application... 73
Figure 8 Representation of the Application Specific Tables (ASTs) Approach for the Factory Planning Database Implementation... 74
Figure 9 Representation of the Independent Database Approach for the Factory Planning Database Implementation... 75
Figure 10 M ain M enu Screen ... 130
Figure 11 Scenario and Report Selection Screen... 133
Figure 12 Line Throughput Results Screen ... 136
Figure 13 Product Related Results Screen ... 139
Figure 14 Machine Related Results Screen... 142
Figure 15 WIP Related Results Screen... 145
Figure 16 Scenario Selection Screen... 148
Figure 17 Scenario Data Editor Screen ... 150
Figure 18 Report Selection Screen... 152
Figure 19 Line Evaluation Report Configuration Editor Screen... 155
Figure 20 Line Layout Editor Screen... 158
Figure 21 Board Assignment to Lines Editor Screen... 162
Figure 22 Board Family Setup Editor Screen... 164
Figure 23 Board Sequencing Editor Screen... 166
Figure 24 Business Model (Normalized)... 169
Figure 25 Data Model for Prototype Application (De-normalized)... 174
TABLES Table 1 Evaluation of (Weighted) Key Characteristics Associated With Pilot Customer Site ... 31
Table 2 Comparison of the two Approaches for the Factory Planning
Data Base...
76
Table 3 Entity Attribute Descriptions (Business Model)...
170
Table 4 Entity Attribute Descriptions (Database Schema)...
175
END NOTES ...
181
BIBLIOGRAPHY ... 182
Development of a Seamlessly Integrated Factory Planning Software Tool (Prototype) to Evaluate and
Chapter 1
1.0 INTRODUCTION
This thesis adheres to the Leaders For Manufacturing (LFM) Program thesis guidelines and fulfills the author's thesis requirements pertaining to the following two degrees:
* Master of Science in Management (Manufacturing Track)
* Master of Science in Civil and Environmental Engineering (Intelligent Engineering Systems Laboratory)
This thesis is written on the basis of the author's six and a half month LFM internship at Motorola Manufacturing Systems located in Schaumburg, IL.
1.1 Problem Description
As Motorola continues to try and play catch up to rapidly increasing consumer demand, it resorts to both short term solutions -- such as purchasing faster automated chip placement equipment and replacing selective manual manufacturing operations with automation
--and long term solutions such as constructing additional factories. Each of these approaches creates a dynamically evolving manufacturing environment wherein
manufacturing operations are continuously subject to product and process changes. As a result, line and factory managers are confronted with the complex task of optimizing line throughput, minimizing costs and ensuring quality products in an environment which is constantly subject to change.
One of the most useful methodologies that is used to conduct quantitative analyses to determine optimal line layouts, process configurations, etc. is that of stochastic
simulation. It is considered to be highly reliable in predicting expected line throughput, identification of the bottleneck work center, build up of WIP on the line and additional
important parameters because the uncertainties that exist on the manufacturing floor
(such as machine breakdowns, variations in time to fix the machines, variations in
machine processing cycle times, etc.) can be modeled using random variables and
distribution functions which map the expected behavior of such uncertainties.However, although stochastic simulation in the above context is known to be a powerful tool to conduct analyses of changing manufacturing environments, its use is often limited because of the inherent complexity in building a simulation model to represent a given
Development of a Seamlessly Integrated Factory Planning Software Tool (Prototype) to Evaluate and Optimize Surface Mount Manufacturing Lines Page 14
Chapter 1
manufacturing environment. Such models can take from between a few weeks to a few months to construct and evaluate. Moreover, the problem is further compounded by the fact that each of the commercially available stochastic simulation applications is fairly intricate to use and a substantial amount of learning is required before these applications can be used in a meaningful manner. Hence, stochastic simulation tools are probably not being used as widely and as frequently as they should be in order to address the needs of managers who have to make critical decisions in rapidly changing manufacturing
environments.
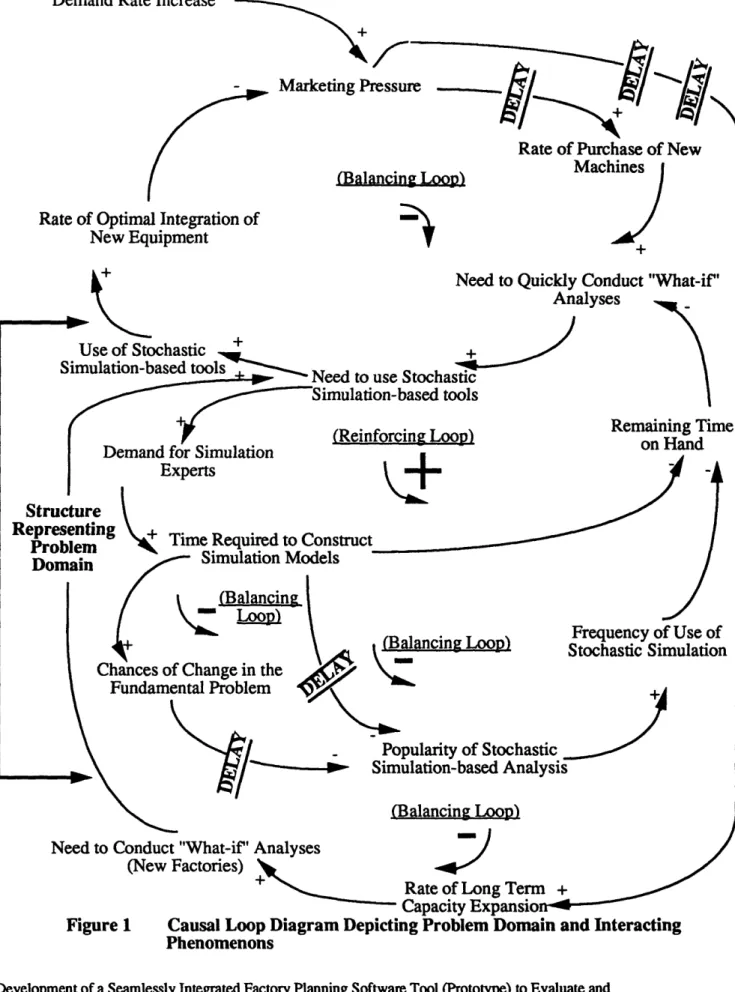
The problem is explicitly described by the causal loop diagram (adopted from the discipline of Systems Dynamics) depicted in Figure 1 on the following page.
Development of a Seamlessly Integrated Factory Planning Software Tool (Prototype) to Evaluate and Optimize Surface Mount Manufacturing Lines Page 15
Chapter 1
Demand Rate Increase
±
Marketing P1
(Balancing Loop) Rate of Optimal Integration of
New Equipment
RN
Rate of Purchase of New
Machines + + Need to Quickly An Use of Stochastic + Simulation-based tool;0 2_ (Reinforcing Loop) Experts Conduct "What-if" alyses Remaining Time on Hand Structure Representid Problem Domain to Construct.i w · Models
alancing Loop) Stochastic SimulationFrequency of Use of
Popularity of Stochastic Simulation-based Analysis
3$
(Balancing Loop)Need to Conduct "What-if" Analyses
(New Factories)
+ Rate of Long Term +
Capacity Expansio
---Figure 1 Causal Loop Diagram Depicting Problem Domain and Interacting Phenomenons
Development of a Seamlessly Integrated Factory Planning Software Tool (Prototype) to Evaluate and Optimize Surface Mount Manufacturing Lines Page 16
I
~I
i
1
Chapter 1
The variables that are used to describe the problem are defined as follows:
Variable Name
Demand Rate Increase Marketing Pressure
Rate of Purchase of New Machines
Need to Quickly Conduct "What-if' Analyses
Need to use Stochastic Simulation-based Tools
Use of Stochastic Simulation-based Tools
Rate of Optimal Integration of New Equipment
Demand for Simulation Experts
Time Required to Construct Simulation Models
Remaining Time on Hand
Chances of Change in the Fundamental Problem
Popularity of Stochastic Simulation-based Analysis Frequency of use of
Stochastic Simulation Rate of Long Term Capacity Expansion
Description
Rate of increase in market demand Marketing pressures on factories to meet customer orders
Rate of purchase of newer and faster manufacturing equipment (at existing factories)
Need to quickly construct different scenarios to determine how to optimally integrate new equipment into existing manufacturing environments
Need to use stochastic simulation-based tools to conduct analyses described above Use of stochastic simulation-based tools to conduct analyses described above
Rate of optimal integration of new equipment into existing manufacturing environments
Need (demand) for experts in stochastic simulation
Time required to construct elaborate, sophisticated and representative stochastic simulation models
Time remaining to address other manufacturing/organizational needs Chances of the nature of the problem changing by the time the solution is generated (this is conceivable especially if formulating the solution takes a few months) Popularity of stochastic simulation as an
tool (at a given factory)
Frequency of use of stochastic simulation as an analysis tool (at a given factory)
Rate of construction of new factories
Development of a Seamlessly Integrated Factory Planning Software Tool (Prototype) to Evaluate and Optimize Surface Mount Manufacturing Lines Page 17
Chapter 1
Need to Conduct "What-if' Need to conduct "what-if' analyses to Analyses (New Factories) optimally design line layouts for new
factories Figure 1 Explanation
The arcs in Figure 1 indicate the links between the different variables described above. The polarity of each link is indicated near the arrowhead for each arc. The polarity depicts the relationship between the direction of change of the two variables connected by
the corresponding arc. For example, when marketing pressure increases, the rate of purchase of new machines increases whereas when the rate of optimal integration of new
equipment increases, the marketing pressure decreases. (The "+" indicates that a change in the preceding variable in a given direction causes a change in the following variable in the same direction. The "-" indicates that a change in the preceding variable in a given direction causes a change in the following variable in the opposite direction).
There are five feedback loops depicted in the diagram -- each of which indicates a cause and effect relationship that arises as a result of a number of interacting variables. There are four Balancing Loops and one Reinforcing Loop. A Balancing Loop depicts behavior wherein the net result of traversing the loop is to weaken or lessen the stimulus that is depicted at the start of the loop. For instance, an increase in marketing pressure impacts a number of other variables in the top most loop structure which eventually cause the rate of optimal integration of new equipment to increase which causes the marketing pressure to decrease. A Reinforcing Loop depicts behavior wherein the net result of traversing the loop is to strengthen or increase the stimulus that is depicted at the start of the loop. For instance, an increase in the need to quickly conduct "what-if" analyses causes an increase in the need to use stochastic simulation-based tools which in turn causes an increase in demand for simulation experts. This causes an increase in the time required to construct simulation models which causes a decrease in the remaining time on hand which in turn further aggravates the need to quickly conduct "what-if' analyses.
One of the most important aspects of Figure 1 is that of the different delays that are depicted along certain arcs. Each "DELAY" label indicates that there is a significant relative delay between the cause and effect relationship of the two connecting variables (relative compared to the other arcs in the diagram). Furthermore, in one instance, there are actually two "DELAY" labels depicted side by side to indicate that this delay is much
longer than the other delays depicted in the diagram. As described below, it is important
Development of a Seamlessly Integrated Factory Planning Software Tool (Prototype) to Evaluate and Optimize Surface Mount Manufacturing Lines Page 18
Chapter 1
to note the existence of these delays in order to understand the overall impact they have in the system depicted in Figure 1.
The diagram depicts that there is at least one delay in each of the Balancing Loops whereas there is no delay in the Reinforcing Loop. This is important because it indicates that the cause and effect relationships of the Reinforcing Loop will be felt much sooner than those of the Balancing Loops. When we examine the cause and effect relationships of the Reinforcing and Balancing Loops, we realize that this means that in the short run, an increase in marketing pressure will (subsequently) cause an increase in the need to quickly conduct "what-if' analyses which (since it is at the start of the Reinforcing Loop) will eventually generate a snow-ball effect and further aggravate the need to conduct
"what-if' analyses. In other words, the simulation experts can be expected to be
"resourced-out" in the short run. However, as the effects of the balancing loops play out over the long run, the frequency of use of stochastic simulation analyses at individual
factory sites could be expected to wane -- not because there is no need for such analyses, but because there is not enough time to construct elaborate models required to conduct such analyses. (This implies that the amount of repeat business of the simulation experts would be expected to decrease in the long run). The most important outcome implied by Figure 1, however, is that in the long run, managers would be deprived of making as informed decisions as they might make on the basis of the use of stochastic simulation models.
1.2 Thesis Goal
This thesis project will significantly reduce the lengthy cycle time of constructing
stochastic simulation models to evaluate surface mount manufacturing environments and will thereby increase the frequency, in the long run, of utilizing stochastic simulation-based analyses to evaluate different manufacturing environments.
The aim of this thesis is to develop a software application that will enable managers to seamlessly configure, execute and evaluate sophisticated, representative and elaborate stochastic simulation models (in Witness) to analyze most surface mount manufacturing environments. Managers will be free to evaluate different manufacturing environments against any set of metrics chosen from those listed below. In addition, this software application will serve as the core of a larger Factory Planning software application wherein the user can analyze a given manufacturing environment according to cost and
Development of a Seamlessly Integrated Factory Planning Software Tool (Prototype) to Evaluate and
Chapter 1
quality metrics in addition to the metrics listed below. (Additional tools will have to be integrated into this software application for this purpose and this thesis addresses the primary architectural issues that will facilitate this integration).
Metrics Against Which a Given Manufacturing Environment Can be Evaluated * WHAT IS THE EXPECTED LINE THROUGHPUT?
* Printed Circuit Board statistics for each product -- Number entering production
-- Number shipped -- Number scrapped -- Number assembled -- Number rejected
-- Average Cycle time (entire production process)
* Device Statistics
-- Bottleneck machine identification -- For each machine
-- % Busy -- % Idle -- % Stopped * Downstream blocking * Setup * Machine Error * Repair
-- Number of Operations completed
* WIP Statistics
-- Average WIP on the line for each type of product (printed circuit board)
-- WIP level between front end and test -- Maximum WIP for a given scenario -- Minimum WIP for a given scenario
-- Which product in the scenario corresponds to the maximum WIP? -- Which product in the scenario corresponds to the minimum WIP? 1.3 Thesis Layout -- "Top-Down" Approach
The core of this thesis (chapters five through nine) follows a "top-down" approach. The reader is introduced to the various functions of the Factory Planning Application (at a high level) in Chapter Five. (These cover all the proposed functions, over and above those that will be implemented for the prototype application). Thereafter, in Chapter Six, the reader is presented with an overview of the various software modules that will
provide these functionalities. (These include all the proposed software modules, over and above those that will be developed for the prototype application).
Development of a Seamlessly Integrated Factory Planning Software Tool (Prototype) to Evaluate and Optimize Surface Mount Manufacturing Lines Page 20
Chapter 1
It is expected that after reading Chapter Five and Chapter Six, the reader will have a holistic understanding of the different functions and corresponding software modules pertaining to the Factory Planning Application. Subsequently, chapters Seven through Nine journey the reader through the detailed requirements for the software modules developed for the Prototype application.
Development of a Seamlessly Integrated Factory Planning Software Tool (Prototype) to Evaluate and Optimize Surface Mount Manufacturing Lines Page 21
Chapter 2
2.0 ACKNOWLEDGMENTS
The author would like to offer special thanks to the following people whose continual support and guidance proved invaluable in this project.
* Peggy Eastwood * Alex Lach * Bob Rush
In addition, the author wishes to thank Dave Liljegren of Motorola Manufacturing Systems whose expertise in the field of stochastic simulation was paramount in making this project succeed.
Furthermore, the author wishes to explicitly thank the following members of the Factory Planning software development team, without whose help this thesis would not have been possible.
* Sharath Kalvakota * Roger Larson * Mike Sorkis * Karen Vilt
Next, the author is extremely grateful to all the cross-functional team members at the pilot factory site (Motorola Wireless Data Group). These include:
* Laurinda Bellinger * Chuck Coughlin * Pete Hassler * Deishin Lee
* Thilo Semmelbauer
In addition, the author is grateful to all the staff members at Motorola Manufacturing Systems and Motorola Wireless Data Group who assisted in this effort at different points in time.
Next, the author would like to acknowledge MITs Leaders For Manufacturing Program for being instrumental in making this thesis project come to fruition.
Finally, the author would like to acknowledge all individuals who have contributed in this effort and have not been listed above.
Development of a Seamlessly Integrated Factory Planning Software Tool (Prototype) to Evaluate and
Chapter 2
TO ROSINA AND SIDDHARTH FOR THE WARMTH AND COMFORT YOU
HAVE GIVEN ME DURING THIS PROJECT
Development of a Seamlessly Integrated Factory Planning Software Tool (Prototype) to Evaluate and Optimize Surface Mount Manufacturing Lines Page 23
Chapter 3
3.0 THESIS METHODOLOGY 3.1 Chapter Overview
This chapter describes the key elements of the processes used to complete this thesis project. Section 3.2 highlights the means by which the voice of the customer was gathered. Section 3.3 outlines some of the findings from an effort to conduct a literature search/industry benchmark pertaining to the functionalities envisioned in the Factory Planning Application. The next section describes the method by which the pilot factory site was selected. Finally, Section 3.5 describes some of the key iterative efforts that were carried out throughout the project and were instrumental in ensuring the on-time completion of the project.
3.2 Gathering the Voice of the Customer
In order to gather the voice of the customer in as efficient a manner as possible, the following steps were undertaken:
* A project initialization meeting was held between key members of the project team, some of their colleagues who had worked with them on significant projects in the past, a manager who was identified as one of the key "Lead Users" for the project and
the project manager. During this meeting, all the information known about the project at that time was discussed and a very rough outline of the next few steps was determined.
* The above meeting was followed by a series of "brain storming" sessions by the core members of the project team wherein the different types of primary scenarios that occur on the shop floor were envisioned, the needs arising from these scenarios were outlined and the specific functions that the Factory Planning software would have to
include to address these needs were identified.
* Information generated as a result of the above steps was refined and condensed into a three page document which provided:
-- A brief description of the proposed Factory Planning software.
-- A list of the problems encountered on the shop floor that the Factory Planning software was intended to address.
-- A brief description of the primary functions that would be included in the Factory Planning application.
-- A list of metrics that would be used to format the output of the Factory Planning software.
This document was then discussed/circulated (with a cover letter outlining the overall project) amongst seven "Lead Users" at Motorola factories located in different parts of the United States.
Development of a Seamlessly Integrated Factory Planning Software Tool (Prototype) to Evaluate and Optimize Surface Mount Manufacturing Lines Page 24
Chapter 3
Feedback from the aforementioned "Lead Users" was used to rank the proposed functions of the Factory Planning software in order of importance. This feedback also served as a "sanity check" to ensure that the project ream was on the right track. The team used the information generated by the steps described above to make a
presentation to the potential pilot factory site and highlight the benefits of the Factory Planning software. On the basis of this presentation, the potential pilot factory site
subsequently volunteered to function as the pilot site. The software requirements for the Factory Planning Application were then iteratively refined (see Section 3.5.1) by the cross functional team comprising of the project development team, users and other staff from the pilot factory site.
3.3 Literature Search/Industry Benchmark
Prior to commencing the development of the software requirements for the Factory Planning software, an informal literature search was conducted to determine the scope of the work that has been done (if any) in the realm of Factory Planning as defined by the functionalities desired by our "Lead Users". For each of the papers that were found to be relevant to some degree, a brief synopsis is provided in the following text.
3.3.1 Research Work at Universities/Corporations
Optimization of SMT Systems by Computer-Aided Planning, Simulation and Monitoring3
This paper describes some of the work done at the University of Erlangen-Nuremberg where an entire SMT line is built in a model factory to further the purposes of research and education. The portion of the paper of relevance to this thesis pertains to he use of computer aided simulation techniques to optimize the throughput of the SMT line and to also determine buffer sizes, idle times of machines, occupied feeders and other
parameters of the SMT line. However, there are no details pertaining to the nature of the simulation models generated, their ease of use, degree of complexity, accuracy, etc.
Factory Control Inteerated With Operational Planning
This paper is part of a research project conducted at the Asea Brown Boveri Corporate Research Laboratory in Baden, Switzerland and describes the integration of a factory control system with a decision support system to facilitate operational planning.
The relevant portion of this paper describes the use of a graphical and interactive simulation system which is used as a decision support tool. The simulator enables the user to simulate a given factory and monitor important line performance parameters such
Development of a Seamlessly Integrated Factory Planning Software Tool (Prototype) to Evaluate and
Chapter 3
as machine statistics (% of time the machine is busy or idle), queue lengths in front of every machine, etc. However, the relevance of this application to surface mount
manufacturing operations cannot be determined from the paper. Furthermore, the ease of use of the simulator as a decision support tool is unclear. (One of the goals of this thesis is to seamlessly integrate a simulator into the Factory Planning environment so that managers/engineers can benefit from the use of a simulator without having to climb the learning curve associated with the intricacies of the simulator.
SEMATECH's Semiconductor Workbench for Integrated Modeling (SWIM)
SWIM is a modeling environment currently being developed by the Semiconductor Manufacturing Technology (SEMATECH) consortium of companies. It will enable users to construct and evaluate diverse semiconductor manufacturing models from the same platform using a common user interface. Users will be able to construct the following types of models (developed at SEMATECH) via the SWIM environment:
* Cost/Resource Model * Cost of Ownership Model
The SWIM environment also incorporates ManSim (a commercially available factory simulation package) and STATA (a commercially available statistics package) which will be used from within the SWIM environment to conduct analyses at the fab, cell or
equipment levels. These and other applications will be automatically executed from within the SWIM environment wherein the required data will be seamlessly transferred between applications. As a result, it is hoped, the non-productive engineering activity of entering the same data in different models will be eliminated and the total time required to construct and evaluate elaborate models for semiconductor manufacturing will be significantly reduced.
Owing to the fact that there is little commonality between the semiconductor fabrication
process and the printed circuit board assembly process from a manufacturing standpoint,
the SWIM tools cannot be directly incorporated into the Factory Planning environment.
However, some of the core philosophies behind the SWIM environment have beenincorporated into the Factory Planning environment and in this context, a perusal of
SEMATECH's efforts regarding the development of the SWIM environment has proven
to be valuable.
Development of a Seamlessly Integrated Factory Planning Software Tool (Prototype) to Evaluate and Optimize Surface Mount Manufacturing Lines Page 26
Chapter 3
3.3.2 Commercially Available Software ADnlications4
Our bench marking efforts also enabled us to determine if there were any commercially available software applications that could be used to serve the needs of this thesis project. Furthermore, this search also enabled the author and the project team to generate an approximate assessment of the degree of sophistication of the relevant commercially available software applications and benchmark the functionalities envisioned to be a part of the Factory Planning Application with those of commercially available software
applications in the industry.
Although the literature search did not reveal any existing software applications that suited our needs, a few of the applications had some degree of overlap with the functionalities identified by our "Lead Users" and hence deserve mention here -- they are briefly
described below in alphabetical order. (In addition, some of the philosophies behind the Factory Planning Application and SEMATECH's efforts to develop the SWIM platform are very closely linked and deserve special mention. These are described in Section 3.3.3 below).
Achilles
Manufacturer Information: IMT Systems, Inc.
444 Castro Street, Suite 711 Mountain View, CA 94041
This tool provides "what-if" analyses capabilities and control capabilities for semiconductor wafer fabrication. It can be used for mid-shift problem solving and simulates in detail, the processes, machines and wafer lots of a specific factory
environment. The output includes throughput reports by process step and workstation, equipment statistics such as utilization rates, queue lengths, cycle times, bottleneck identification, etc. This tool can also be initialized by integrating it to an existing CAM system to ensure accurate model initialization and calibration. However, from the depth of the information found on this tool, it appears that it is geared specifically towards semiconductor fabrication operations as opposed to surface mount assembly operations for printed circuit board assembly.
Development of a Seamlessly Integrated Factory Planning Software Tool (Prototype) to Evaluate and
Chapter 3
CIMBridge
Manufacturer Information: Mitron Corporation
15256 N.W. Greenbrier Parkway Beaverton, Oregon 97006
CIMBridge is an integrated printed circuit board design and manufacturing tool which links board design data with manufacturing systems. The tool accepts data from diverse CAD systems, converts the data to a neutral format and thereafter generates machine placement NC programs for various machines on the assembly line. The tool has limited functionality pertaining to estimating the cycle time impacts (on a given station/machine) of changing printed circuit board layouts.
However, the tool does not have the capability to enable the user to conduct sophisticated "what-if" analyses in terms of allocating different products to different lines, changing the line layouts, process flows, product lot sizes, etc. Hence, it does not adequately serve the needs of Factory Planning as described in this thesis. Furthermore, there is a significant amount of learning that has to be accomplished prior to using this tool effectively, and this contradicts the ease of use requirement of the Factory Planning Application.
Paragon
Manufacturer Information: Tecnomatix Technologies Inc. 39830 Grand River Avenue Suite B-3, Novi, MI 48375
This tool provides Computer Aided Process Engineering capabilities to assist decision making pertaining to the printed circuit board assembly process. Although this tool
provides some key functions that aid the design and implementation of the printed circuit
board assembly process (such as graphically viewing the board layout, graphically
defining the line layout that will be used to assemble the board, automatically creating
some of the machine NC programs to place components on the board, etc.), these
functions are either already provided by software previously developed in-house at Motorola or are envisioned to be included in some of the applications currently under development in the company.Most importantly, the level of sophistication of the line operation simulations that can be generated via Paragon are not considered to be nearly as advanced as those that can be
Development of a Seamlessly Integrated Factory Planning Software Tool (Prototype) to Evaluate and Optimize Surface Mount Manufacturing Lines Page 28
Chapter 3
generated via the Factory Planning prototype application. Furthermore, there is a significant learning curve associated with using the Paragon computer aided process planning tools and this defeats one of the core purposes of the Factory Planning Application -- to provide managers with the capability of quickly configuring and evaluating elaborate "what-if" manufacturing scenarios by transparently driving sophisticated stochastic simulation models.
Simfactory 2.5/Simprocess
Manufacturer Information: CACI products Co.
(Subsidiary of CACI International, Inc.) 3333 N. Torrey Pines Court
La Jolla, CA 92037
This software application is used to conduct simulation-based analyses for Factory Planning and business process re-engineering. It addresses issues pertaining to layout design, capacity planning, rework and repair analyses, material handling and maintenance planning. It provides graphical outputs with critical parameters such as equipment
utilization, queue levels, transporter utilization, raw material consumption and
throughput. It is not clear from the depth of literature search conducted whether or not this software application would be ideally suitable to simulate surface mount
manufacturing operations. Furthermore, the defacto software tool used for constructing stochastic simulation models at Motorola Manufacturing Systems (the author's internship site) is Witness and hence by default, Witness would be used as the tool in which
simulation models are seamlessly configured by the Factory Planning software application.
3.3.3 SEMATECH Efforts Relevant to Thesis Topic
SEMATECH has been developing an integrated software environment for evaluating and optimizing Semiconductor manufacturing processes. This environment -- also referred to above -- is called the Semiconductor Workbench for Integrated Modeling (SWIM) and some of the philosophies behind the SWIM architecture are similar to those of the Factory Planning Application.
Most notably, there are two significant commonalities behind the approaches adopted in the SWIM and Factory Planning architectures. Firstly, both architectures allow for third
Development of a Seamlessly Integrated Factory Planning Software Tool (Prototype) to Evaluate and Optimize Surface Mount Manufacturing Lines Page 29
Chapter 3
party software tools to be exchanged for specific software modules. The Factory Planning architecture accommodates this by:
* A highly modular structure
* Requiring that global variables are not use across different software modules * Stipulating the specific data flows to and from each software module -- a
module from the Factory Planning Application can thereby be swapped with another software module which provides the same functionality by ensuring that the data flows before and after the swap remain unchanged.
The SWIM architecture allows for such an exchange by including a detailed, integrated data model which describes the relationships between the various entities/attributes
associated with the different software modules within the SWIM environment. Any module within the environment can be interchanged with a module external to the environment so long as the relationships between the various entities/attributes that are affected by the exchange are preserved.
Secondly, both the SWIM application and the Factory Planning Application support data source independence in that they can be ported from one factory to another with relative ease, in spite of the fact that the data repositories at the two factories might be
dramatically different. This is accomplished in each case by tying the different software applications to an auxiliary database which in turn is linked to the local data repository at a given factory by means of what the author refers to as a data transfer interface. Hence, when the SWIM/Factory Planning Applications are ported from one factory to another, only the data transfer interface has to be changed to match the local data repository at a given factory -- the individual software modules (that make up the SWIM/Factory Planning Applications) remain unchanged.
3.4 Determination of Pilot Customer Site
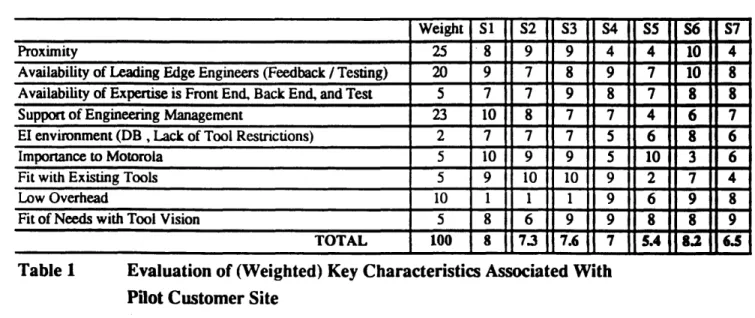
As described above, members of the project team had contacted "Lead Users" to develop an initial assessment of the voice of the customer for the Factory Planning Application. These users were located at different Motorola factories across the United States and our project team evaluated each of these factories as a potential pilot customer site according to the key characteristics described below. Each of these characteristics was assigned a weight according to the degree of importance the project team associated with that
characteristic and the sum of the weights was made to equal 100. (The seven sites
Development of a Seamlessly Integrated Factory Planning Software Tool (Prototype) to Evaluate and Optimize Surface Mount Manufacturing Lines Page 30
Chapter 3
considered are listed as S1 through S7 in order to hide their real identity). According to this ranking system, Motorola's Wireless Data Group (WDG) was selected as the potential pilot customer site. (This was only confirmed after the project team made a presentation to WDG regarding the capabilities envisioned for the Factory Planning Application and obtained buy-in from WDG as a result).
Key Characteristics Related to Pilot Customer Site
Weight Sl S2 S3 S4 S5 S6 S7
Proximity 25 8 9 9 4 4 10 4
Availability of Leading Edge Engineers (Feedback / Testing) 20 9 7 8 9 7 10 8
Availability of Expertise is Front End, Back End, and Test 5 7 7 9 8 7 8 8
Support of Engineering Management 23 10 8 7 7 4 6 7
El environment (DB , Lack of Tool Restrictions) 2 7 7 7 5 6 8 6
Importance to Motorola 5 10 9 9 5 10 3 6
Fit with Existing Tools 5 9 10 10 9 2 7 4
Low Overhead 10 1 1 1 9 6 9 8
Fit of Needs with Tool Vision 5 8 6 9 9 8 8 9
TOTAL 100 8 7.3 7.6 7 5.4 8.2 6.5
Table 1 Evaluation of (Weighted) Key Characteristics Associated With Pilot Customer Site
3.5 Overview of Main Processes
The following sub-sections document some of the key processes that were followed during the course of this thesis project. The processes were followed keeping in mind the
business aspects of this effort, the thesis requirements of the project and the project management practices followed at Motorola Manufacturing Systems at the time of
undertaking this thesis project.
3.5.1 Periodic Meetings -- Continuous Feedback From Customers
Throughout the project life cycle (after the pilot customer site had been confirmed), periodic meetings were held which comprised of cross-functional members from the project development and customer site teams. The composition of the cross-functional groups that met during each of these meetings was determined prior to each meeting according to the meeting agenda. For instance, if database integration issues needed to be addressed, members from the customer site's CIM group attended the meetings. On the other hand, if the design of the user interface was to be reviewed, potential users from the
Development of a Seamlessly Integrated Factory Planning Software Tool (Prototype) to Evaluate and
Chapter 3
pilot customer site were invited to the meeting. The frequency of these meetings was determined according to the constantly evolving project schedule (discussed below). On average, these meetings were held on a weekly basis.
The goal of the periodic meetings was to ensure that the software development team was on the right track at all times. Owing to the extremely tight project schedule (discussed below), it was imperative to obtain frequent feedback from the customer site and to take corrective action accordingly. This process is akin to that of inspection at every stage of an in-line manufacturing process wherein the worker at each station ensures that his/her output caters to the needs of his/her most immediate downstream customer. (This process is depicted in Figure 2 below).
PRIMARY SEPARATOR: PHYSICAL SPACE
Figure 2 Feedback at Each Production Step 1
In the case of the software development process used in this project, the only difference is that the stages of software development (analogous to the different manufacturing stages) are primarily separated by time instead of by physical space as is the case with
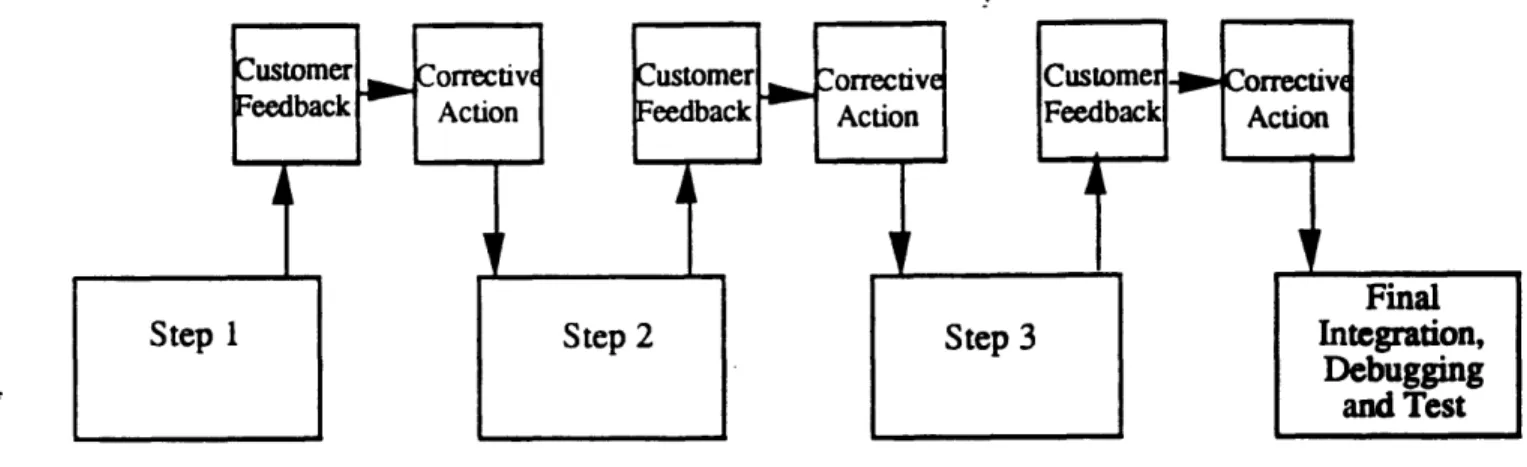
manufacturing processes on the shop floor. Hence, the phenomenon of continuous feedback employed in the software development process for this project can be depicted as shown in Figure 3 below.
Development of a Seamlessly Integrated Factory Planning Software Tool (Prototype) to Evaluate and Optimize Surface Mount Manufacturing Lines Page 32
Chapter 3
PRIMARY SEPARATOR: TIME
Figure 3 Continuous Feedback During the Software Development Process 3.5.2 Weekly Team Meetings -- "Yo One"
Weekly team meetings were held by the software development team to discuss and address any issues internal to the team. Although we did not follow a formal "Yo-One" ceremony 2, each of these meetings served the purpose of the team coming to agreement on important issues pertaining to the project development effort. In some cases, the team agreed upon the actions taken for the completion of certain tasks and agreed to move on. In other cases, the team agreed on what approaches it should adopt to tackle particular problems.
3.5.3 Dissemination of Project Information
In order to ensure that project information was disseminated in a timely and comprehensive manner, two policies were established.
Firstly, the project team submitted a single weekly report to the project manager, senior management, customer site and all other personnel who needed to be kept up to date with
the project's progress. These reports highlighted major accomplishments for the given week, major efforts under way at the time and significant problems that the project team was encountering. The reports also documented the estimated completion dates for milestones coming up in the following week.
Development of a Seamlessly Integrated Factory Planning Software Tool (Prototype) to Evaluate and Optimize Surface Mount Manufacturing Lines Page 33
Chapter 3
Secondly, all significant documents (such as software architecture and requirements documents, activity logs, major issues/to dos, etc.) were maintained on a file server which could be accessed by all members of the project team who needed to have access to such information.
3.5.4 Project Schedule Methodology
Since the author's internship had a specific end date, this project did not enjoy the degree of flexibility that is inherent to most thesis projects. Furthermore, since the author felt very strongly that to ensure that the project benefits were fully realized it was imperative to complete and implement the prototype application prior to the end of his internship, the project was essentially scheduled backwards from the completion date.
In the case of most software projects, the completion dates for individual tasks and sub-tasks are constantly revised (and often pushed further out in time) with the progression of the project, thereby resulting in delays in the target project completion date. Figure 4 is a simple schematic depicting this phenomenon. As the figure shows, a single initial delay in a task which is on the project's critical path maps onto the other critical paths of the project and causes the original completion date to be pushed out further in time. Of course, in addition to the delays depicted in the schematic, there will be other delays owing to the fact that the critical path often changes as individual tasks and sub-tasks get re-scheduled, thereby exacerbating the overall project delay even further.
Development of a Seamlessly Integrated Factory Planning Software Tool (Prototype) to Evaluate and Optimize Surface Mount Manufacturing Lines Page 34
Initial Delay in Critical Path Task
Subsequent Delay in i I Critical Path Task
Subsequent Delay in Critical Path Task
Sub Cr
Psequent Delay in itical Path Task
TIME Project Start Date KEY
Tasks on
Critical Path Tasks not on Critical PathFigure 4 Typical Scheduling Methodology f
Original Target layin
CompletionDate Completion Date
Revised Target Caused by Delay
Completion Date in Critical Path Task
or Software Development Projects However, in this project, the due date was considered fixed and the completion times for the individual tasks and sub tasks were constantly re-evaluated in order to ensure that the due date did not get postponed. As a result, the prototype Factory Planning Application was implemented on time in spite of repeated concerns raised by team members that it simply could not be done according to the proposed schedule. (This scheduling
technique is often used by aggressive software and systems integration consulting firms. These firms nurture this capability into a core competence upon which they compete with larger firms in their industry5).
Development of a Seamlessly Integrated Factory Planning Software Tool (Prototype) to Evaluate and
Optimize Surface Mount Manufacturing Lines Page 35
Chapter 3 I I I,, I--I I I I I I I~l~ I I I U I I I I