Analyzing gameplay data to inform feedback loops in the Radix Endeavor
Meng-Tzu ChengNational Changhua University of Education [email protected]
Louisa Rosenheck MIT Education Arcade
[email protected] Chen-Yen Lin
Eli Lilly and Company [email protected]
Eric Klopfer MIT Education Arcade
[email protected] Abstract
The purpose of this study is to explore some of the ways in which gameplay data can be analyzed to yield results that feed back into the learning ecosystem. There is a solid research base showing the positive impact that games can have on learning, and useful methods in educational data mining. However, there is still much to be explored in terms of what the results of gameplay data analysis can tell stakeholders and how those results can be used to improve learning. As one step toward addressing this, researchers in this study collected back-end data from high school students as they played an MMOG called The Radix Endeavor. Data from a specific genetics quest in the game were analyzed by using data mining techniques including the classification tree method. These techniques were used to examine the relationship between tool use and quest completion, how use of certain tools may influence content-related game choices, and the multiple pathways available to players in the game. The study identified that in this quest use of the trait examiner tool was most likely to lead to success, though a greater number of trait decoder tool uses could also lead to success, perhaps because in those cases players solving problems about genetic traits at an earlier point. These results also demonstrate the multiple strategies available to Radix players that provide different pathways to quest completion. Given these methods of analysis and quest-specific results, the study applies the findings to suggest ways to validate and refine the game design, and to provide useful feedback to students and teachers. The study suggests ways that analysis of gameplay data can be part of a feedback loop to improve a digital learning experience.
Educational games have been shown to have a positive impact on learning, and have become much more common in classrooms in recent years (Cheng, Su, Huang, & Chen, 2014; Ke, 2008; Lee, Luchini, Michael, Norris, & Soloway, 2004). Along with this, progress data and learning analytics have come to be expected elements of any educational software offering. But how can those large amounts of data be leveraged to support learning in meaningful ways? This involves careful design of the data collection, methods of analysis, and delivery of results into one coherent system. Because the cross-fertilization of data analytics and educational games remains in its infancy, few researchers to date have really begun to tackle the unstructured information in gameplay data that describes a continuum of gaming-learning interactions.
This paper makes a new contribution by exploring some of the ways in which gameplay data can be analyzed to yield results that feed back into the learning ecosystem. It does this in the context of one quest within The Radix Endeavor, an MMOG designed at the MIT Education Arcade. After describing the context and learning goals of the game, and the data set that was collected during a pilot project, the paper will present the ways in which that data set was analyzed to best describe players’ choices and interactions within the game. It will then explore how those results can be interpreted and to whom they are most meaningful, working under the principle that even the most sophisticated analytics are only useful when presented clearly to the people that are in a position to make a difference in the learning process. 2. Literature review
2.1. Learning in massively multiplayer online games (MMOGs)
Learning does not only involve acquiring content knowledge but also supporting motivation, and establishing skills and ways of thinking. In the past, this has not been easy to realize in traditional classroom settings due to physical and time constraints. However, research over the past decade has revealed that digital educational games can support meaningful and authentic learning, in deeper ways than more conventional forms of teaching (e.g. Connolly, Boyle, MacArthur, Hainey, & Boyle, 2012; Papastergiou, 2009; Vogel et al., 2006; Wouters, van Nimwegen, van Oostendorp, & van der Spek, 2013). When they play video games, people practice a set of 21st century skills that can be applied to studying and working in the
real world (Prensky, 2006). This is especially true for games that include game design elements based on solid learning theories (Qian & Clark, 2016). Gee (2013) also argues that gaming has the potential to increase the impact and effectiveness of the work of individuals, by bringing about synchronized intelligence, where humans and digital tools complement each other’s abilities in order to achieve new goals. In addition, the National Research Council has reported that in the field of science learning in particular, simulations and games have potential to advance multiple learning goals including conceptual understanding, science process skills, discourse and argumentation, etc. (Honey & Hilton, 2011). Research into learning games has also revealed some of the game elements that best enable content learning as well as inspire interest, creativity, and social interaction (Squire, 2011). These value-added features that are specifically designed to support learning were in fact found to magnify learning according to a metastudy in which games with enhanced designs showed an effect size of .34 as compared with the equivalent standard versions. These enhancements include additional scaffolding, collaborative and competitive social features, more context, improved interfaces, and extended game play (Clark, Tanner-Smith, & Killingsworth, 2015). All of this evidence explains why the Joan Ganz Cooney Center’s Level Up Learning survey reported that 74% of teachers are currently using digital games for instructional purposes with their students (Takeuchi et al., 2014).
Of the various genres of video games, massively multiplayer online games (MMOGs) is one that has been specifically designed and widely used for educational purposes to enable student interactions, develop new literacies, and conduct problem solving and scientific inquiry (e.g. Annetta, Minogue, Holmes, & Cheng, 2009; Barab, Thomas, Dodge, Carteaux, & Tuzun, 2005; Reisoğlu, Topu, Yılmaz, Yılmaz, & Göktaş, 2017; Sabourin, Rowe, Mott, & Lester, 2012). MMOGs are a type of highly graphical online game in which individuals explore a virtual environment simultaneously and interact with each other through their avatars (Steinkuehler, 2004). Research has indicated that MMOGs possess many unique features that support student learning (Kong, Kwok, & Fang, 2012). For example, the gaming context of MMOGs creates immersive presence combining actional, symbolic, and sensory factors. The more a virtual immersive experience is perceived by individuals, the more learning is enhanced through multiple perspectives, situated learning, and facilitation of transfer (Dede, 2009). The use of an avatar, the player’s virtual representation in the game world, provides individuals with identities to perform and engage in authentic learning tasks. Only when individuals commit themselves to a new identity and have an opportunity to
mediate interactions between their real-world and in-game identities, can active learning and critical thinking take place (Gee, 2007). The virtual environments of MMOGs are situated within complex and sometimes ill-structured problem spaces in which players take on the role of problem solvers. They work through challenges by manipulating systems and
variables within the game world. The process of problem solving in MMOGs requires players to assess situations, analyze data, perform actions, evaluate the consequences of those
actions, and draw appropriate conclusions, and these steps are key to cognitive development (Deniz, Victor, Dirk, Xun, & Raymond, 2014; Eseryel, Ge, Ifenthaler, & Law, 2011). MMOGs also include rich narrative storylines that have the power to turn the virtual world into a contextual and authentic network of narrative spaces (Jenkins, 2004). The narratives are usually embedded in the gaming context in the form of sequences of small tasks, called quests, in which non-player characters request the help of the players. The motivation to complete quests and advance in the game fosters student exploration and discovery, and subsequently, facilitates desired learning behaviors (Dickey, 2007). In short, the
implementation of MMOGs in educational settings actually finds its roots in ecological psychology as its theoretical foundation. Emphasis is placed on a dynamic, reciprocal
relationship between the mind and its surrounding environment, and a learning process that is embodied and embedded in everyday cognition (Young, Schrader, & Zheng, 2006).
Many studies have been conducted to empirically investigate the effectiveness of using MMOGs for learning. Annetta et al. (2009) created an MMOG, Mr. I.M. Megabucks and
Mrs. I.M. Megabucks, to facilitate student learning about genetics. Their study used a
knowledge test as post-intervention for examining students’ understandings and a classroom observation protocol for assessing student engagement. The results indicated a significantly higher level of engagement while interacting with the game, yet no difference was found in student learning. A study by Warren and Dondlinger (2008) examined the impact of a
curriculum-based, MMOG learning environment, Anytown, on student writing abilities using a quasi-experimental, pretest-posttest comparison design. After the implementation, both increased voluntary student writing and improved performance on writing tasks were found. Quest Atlantis is another game that incorporates many of the design features of an MMOG such as a virtual environment, narrative, and online community, which have been shown to support learning (Hickey et al., 2009; Barab et al., 2010; Peppler & Solomou, 2011). More specifically, Global Village is a game developed within the Quest Atlantis universe for students to learn about geography (Tüzün, Yılmaz-Soylu, Karakuş, İnal, & Kızılkaya, 2009).
Students’ achievement and motivation were examined using mixed methods, collecting quantitative data of pre and post achievement tests and qualitative data of observations and interviews. The study revealed that the game-based learning environment benefited students’ intrinsic motivation and learning about world continents and countries.
In addition to the more traditional assessments, questionnaires, observations, and interviews, many researchers are now focusing on analyzing log-file data to reveal more stories behind the scenes regarding the interactions between student in-game behaviors and learning. Eseryel et al. (2011) conducted a year-long implementation of McLarin’s Adventures, an MMOG that asked students to play as researchers to colonize an uninhabited, uncharted planet, for examining the interplay between a learner’s motivation, engagement, and complex problem-solving outcomes. Besides the use of complex problem scenarios for assessing complex problem solving, and motivation inventory for examining intrinsic motivation, student engagement during gameplay was assessed by the number of tasks completed and the time spent on the game as recorded in log files. In addition, Ketelhut (2007) has examined the relationship between students’ self-efficacy and scientific inquiry skills by engaging students in a scientific inquiry-based curriculum delivered by an MMOG called River City. In this study, database log files were used to assess students’ scientific inquiry skills including making observations, posing questions, examining books and other sources, and using tools. 2.2. Educational data mining
As the databases that record all player-system interactions in the game tend to become quite large and complex, an interest in employing data mining techniques to explore patterns in the log files (event data) has been increasing in recent years. Data mining refers to “the process of analyzing data from different perspectives and summarizing it into useful information” (Sangeetha & Rajeshwari, 2012). The main objective of this is to identify values and
relationships from a large dataset and describe the data in an understandable and interpretable way. It includes techniques such as association rules – discovering relations between
variables, classification and regression – developing models that classify data/ explain the relationship between independent and dependent variables and predict future data trends, and cluster analysis – grouping a set of heterogeneous data objects according to some attributes (Hegland, 2001; Lotfi, Amine, & Mohammed, 2014). In particular, educational data mining (EDM), one of the branches of data mining, is a method of scientific inquiry concerned with
the use of data mining methods to better understand teaching and learning by exploring the unique types of data that come from educational settings (Baker, 2010). EDM also refers to learning analytics (Baker & Siemens, 2014), a growing research field that has garnered much attention recently. By extracting implicit and meaningful patterns from large datasets,
techniques in learning analytics offer opportunities to discover things about how students solve problems, and deal with learning issues that could not previously be addressed (Baker & Yacef, 2009; Kerr, 2015; Peña-Ayala, 2014; Romero & Ventura, 2007). The major assumption of EDM is that well-designed telemetry, the data associated with specific software events and student actions, reflects students’ implicit cognitive processes (Chung, 2015).
When it comes to educational games, the use of EDM techniques enables so-called stealth assessment by providing meaningful and robust evidence that can inform both feedback and game design. Stealth assessment is evidence-based, and treats learning as dynamically contextualized within gameplay. It measures learning using embedded tasks to assess how players are progressing relative to targeted competencies, and by analyzing a sequence of actions within complex tasks in the gaming environment (Rowe, Asbell-Clarke, & Baker, 2015; Shute, 2011). Shute and colleagues (2009; 2012; 2013) have done extensive work with “stealth assessments” embedded into learning games. Using the evidence-centered design method (ECD), a systematic framework for designing stealth assessment which satisfies the requirements of validity and reliability, researchers have developed ways to make sense of the rich and complex data stream in order to inform instruction and enhance learning (Mislevy et al., 2014; Rowe, Asbell-Clarke, & Baker, 2015; Shute, Ventura, Bauer, & Zapata-Rivera, 2009). On the basis of ECD, Groff, Clarke-Midura,
Owen, Rosenheck, and Beall (2015) suggest a more practical balanced design method consisting of content, evidence, and task models. This serves as a design lens for creating a more effective learning game where the learning constructs, game mechanics, and play behaviors and performance are aligned. On the other hand, Owen (2015) proposes an empirical framework to elaborate how EDM methods can be used for opitimizing design of learning games. This framework provides principles and guidelines for different stages of learning game development. By leveraging analytic techniques including visualization, association mining, and predictive modeling throughout game design process, a
user-adaptive, fully scaffolded gameplay experience for learning is supported. In the present study, the balanced design method was adopted for developing The Radix Endeavor, and this
process is described in more detail later.
The report on Data-Intensive Research in Education (Dede, 2015) describes a variety of ways that data mining is being used in educational games and simulations, and a systematic review conducted by Liu, Kang, Liu, Zou, and Hodson (2017) reveals that learner performance and game design strategies are the topics most often researched through learning analytics in educational games. Additional examples show that an increasing focus has been placed on using data mining techniques to analyze player behaviors – indicators about how players interact with the game’s systems. For example, Hawlitschek and Köppen (2014) conducted a study to examine player behaviors through playing 1961, an educational history game. Two clusters, intensive objective exploration and intensive interaction with non-player characters, were revealed. In the study by Cheng, Lin, and She (2015), log data files of student in-game behaviors were retrieved and cluster analysis was also employed to investigate the interplay of learning outcomes, gaming performance, and the use of in-game characters in the digital gaming context of Virtual Age. Three clusters showed distinct trends: low learning
outcomes/low gaming performance, high learning outcomes, and high gaming performance. They subsequently suggested that data mining is a potentially useful trend in education because it can discover hidden information that tells us more about not only the consequences but the processes of learning through gaming. By using the techniques of classification and regression trees, DiCerbo and Kidwai (2013) created a detector for classifying player
behaviors as serious or not serious pursuits of a specific gameplay goal. Rowe, Asbell-Clarke, and Baker (2015) developed models that demonstrate students’ implicit knowledge of
fundamental physics by detecting their in-game strategies. In addition to the provision of new insights on how students behave in the game, other studies emphasize the application of EDM techniques to inform improvements of learning systems. For example, Kerr (2015) examined and identified students’ strategies using cluster analysis and was able to redesign the educational game accordingly. As a result of the data-driven modifications, construct-irrelevant behaviors were significantly reduced. In fact, many empirical studies to date have provided evidence supporting the data-driven design approach for understanding cognitive states and improving educational game development (e.g. Freire, Serrano-Laguna, Iglesias, Martínez-Ortiz, Moreno-Ger, & Fernández-Manjón, 2016; Hauge, Berta, Fiucci, Manjón, Padrón-Nápoles, & Nadolski, 2014; Levy, 2014; Loh, Sheng, & Ifenthaler, 2015; Owen, 2014).
While there are many useful applications of data-intensive research currently, the report on Data-Intensive Research in Education (Dede, 2015) also calls for more work to be done in a number of areas in order to develop the field of EDM. Most relevant to this study are the needs for developing new forms of educational assessments and developing new types of analytical methods. With this current state of the field in mind, the present study seeks to explore the interactions between student learning and their in-game behaviors in Radix by using data mining techniques, including the classification tree method. The focus of the research is on in-game tool usage involved in quest completion, given that these actions were designed to manifest students’ implicit understanding about Mendelian genetics. The three main research questions addressed here include:
(1) How do students interact with game mechanics to complete a quest in Radix?
(2) How can these results be used to validate or revise the game design and quest design? (3) What insights can this analysis provide in the form of feedback for both teachers and
students?
3. The Radix Endeavor
The Radix Endeavor (www.radixendeavor.org) is an inquiry-based online game for STEM learning developed at the MIT Education Arcade. It is an MMO-style game in that it is set in a virtual multiplayer world that is fairly open-ended and exploratory but that has set
sequences of tasks for players to work through. The Radix world contains embedded biological and mathematical systems that involve the world’s realistic but fictional flora, fauna, and civilizations. Players take on game tasks, or quests, that guide them to probe the game’s systems and develop a firsthand understanding of math and biology concepts in a variety of topic areas. The game is exploratory, leaving a lot of experimenting and problem-solving up to the players. It incorporates a wide variety of content as well as STEM practices and even soft skills. It is a long-form game, meant to be played over the course of a semester and revisited during each relevant curricular unit. In addition, it presents opportunities for players to collaborate both in and outside of the game, leading to a unique deep learning experience (Figure 1).
Figure 1. Players breed bugs and view the results of the offspring’s traits.
One content area included in the Radix game is Mendelian genetics, which makes up one of the major quest lines and includes a sequence of 14 quests. Players start out exploring myzle flowers, discovering that they have phenotypes of color, height, and electricity. They search for flowers with each variety and turn them in to complete the early quests. Next they move on to breeding flowers. Game characters present their backstory which provides a reason that they need flowers of a certain phenotype. Players must figure out for themselves which genotypes to collect, then find those flowers and use the breeding station to obtain seeds and grow the offspring flowers. They can breed as many generations as they choose, to see what happens when they use different genotypes as parents. This is the core mechanic through which Radix players experiment with dominant and recessive traits and discover for themselves how different inheritance patterns work. In addition to turning in the correct variety of offspring to complete the quests, players are often asked to show how someone else could reproduce their results. They do this by creating a Punnett square that shows the
likelihood of different varieties of offspring given the specified parental genotypes. The sequence of genetics quests leads players through a progression of exploring a number of inheritance patterns as well as dihybrid crosses. The quests provide an experience through which players are interacting with a simulated system to construct their own understanding of
Mendelian genetics.
As they work through the genetics quest line, players have access to four main tools that help them accomplish their goals. For each task players must identify on their own which tool would be most useful, and which objects to use it with.
Trait Examiner: This tool lets players examine a plant or animal and find out what its phenotypes are. For example, when this tool is used on a myzle flower, a player may find out that its color is red, and its height is tall. Based on this players may decide whether to breed the organism.
Trait Decoder: This tool lets players find out the genotype of a plant or animal. For example, when used on a glumbug, a player may find out that it has antenna length genes LL and toxicity genes Tt. This information by itself doesn’t tell players how those genes manifest, but it becomes meaningful when combined with other information or experiments.
Breeding Station: This tool lets players choose two parent plants or animals and breed them to obtain offspring. After dragging the parents into the breeder, players can then see some basic statistics on the genotypes of the brood and interact with the offspring.
Punnett Tool: This tool is optionally available during the breeding process. It lets players fill in a Punnett square with the traits they are interested in and drag the alleles into the corresponding cells to complete the diagram.
This paper focuses on data for one particular quest, called “Bake Me a Cake,” which is the 11th quest in the genetics sequence. In it, the non-player character Aubergene requests two nontoxic glumbugs bred by the player, as well as a Punnett square to show which parents should be selected to breed more nontoxic bugs. This quest was chosen because it comes after the bulk of initial exploration into traits and varieties, and it involves some interesting
experimentation to discover which varieties of a trait are dominant and recessive. Players have multiple pathways by which they can build their understanding and succeed at the quest, depending on which tools they use and how they make meaning out of the results obtained from each attempt. “Bake Me a Cake” and other genetics quests were designed to encourage
experimentation and lead players through a semi-open-ended learning process, which can be examined through the back-end game data.
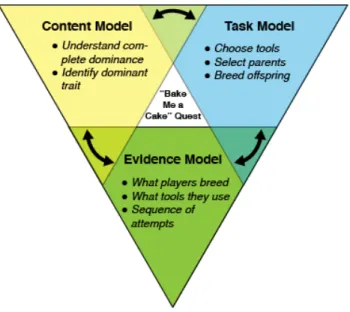
To integrate the targeted constructs and assessments into the learning process, designers used the Balanced Design method (Groff et al., 2015), which is based on the Conceptual
Assessment Framework from Evidence Centered Design (Mislevy, Almond, & Lukas, 2003). This method clearly delineates three elements: the content model – the skills players are meant to learn; the task model – what players do in the game that helps them learn those skills; and the evidence model – the observable actions or data that are collected to show what players have learned. In the “Bake Me a Cake” quest the content model consists of players understanding the complete dominant inheritance pattern, and more specifically being able to identify the dominant variety of a trait. In the task model, players experiment with selecting parents and breeding offspring with the required traits. Lastly, the evidence model for this quest includes what players chose to breed, what tools they used, and the sequence of attempts they made. As shown in Figure 2, these models work together to support the
learning construct of the quest.
Figure 2. How learning constructs are embedded into the “Bake Me a Cake” quest. 3.1. The Radix Pilot
Radix launched as a free tool available across the US and internationally in late January 2014. During the pilot period which ran through August 2015, Radix had over 18,000 user
accounts, and was being played in all 50 states and 7 different countries. While the game was designed with high school math and biology teachers in mind, Radix has been used by upper elementary, middle, and high school teachers as well as by a few instructors at community colleges and universities. Outside of the formal school environment, the game has also been picked up by various after school groups, enrichment programs, and the homeschool
community who are using it with a wide variety of ages. During the pilot period, informal marketing and outreach was done to recruit teachers to participate in the pilot at various levels. This included reaching out to local and national teacher networks to publicize the game, as well as a number of press articles and blog posts showcasing the project and its opportunities for participation. Teachers created accounts for their students to play, but players who heard about the game via other channels were also able to create player accounts not associated with a school or teacher. During the pilot period, there were a total of 12278 student accounts and 4244 player accounts created. Participating teachers were provided with some professional development opportunities and implementation resources but they were encouraged to tailor their implementations and use the game as they saw fit in their
classroom. Most of them had their students play relevant quest lines at the time they were covering a given topic area in their class. Outside of school players naturally played as much or little as they chose to, working through quest lines according to their interests.
4. Methods
4.1. Data sources
The Radix game collected back-end data for all users as they played the game, storing data securely in a database hosted on an Amazon cloud server. This study focuses on the player usage data collected by the game, in particular tool usage and quest attempts. In terms of tool usage, an event was logged every time a user used the trait examiner, trait decoder, breeding station, or Punnett square functions in the game. An event was also logged every time a player attempted to turn in a quest (hand in required objects to complete a quest). Each quest attempt was logged as a success or a failure, and if it was a failure the event was marked with one of the following failure codes, or reasons for quest failure:
FT: Turned in the wrong type of object(s) F1: Submitted an incorrect Punnett square F2: Submitted glumbugs of the wrong variety
F3: Submitted an incorrect Punnett square and glumbugs of the wrong variety F4: Submitted object(s) that were not created by the player himself
All events logged are associated with a unique user id and a timestamp. Using this
information each player’s tool usage and quest attempts could be sequenced to examine not only their action frequencies but their quest progression as well. For example, the data can show how many times a player submits the wrong type of object, and how many times they submit the wrong variety, before ultimately succeeding. In addition, the data can also show which tools players use, how often, and in what order. All of this information has enabled researchers to find play patterns across all users who worked on this genetics quest. While the larger pilot study included many other types of game data, surveys, interviews, and
observations, those data were not analyzed for this particular study. Table 1, while not comprehensive, provides a sample of what the dataset might look like for a player who used some tools, made an unsuccessful quest attempt, and subsequently completed the quest. Table 1.
A sample representation of the Radix event log dataset.
event_id character_id event_type timestamp success quest_id step_num failure_code
1 72 trait_decoder_use 1396275455 2 72 trait_examiner_use 1396275464 3 72 quest_attempt 1396275485 0 GN1.5 0 F1 4 72 breeding_station_use 1396275508 5 72 quest_attempt 1396275511 1 GN1.5 0 6 72 quest_attempt 1396275649 1 GN1.5 1 7 72 quest_completed 1396275733 1 GN1.5 1
on the “Bake Me a Cake” quest during the pilot period, resulting in gameplay data from 339 participants. The study design is based on the model illustrated in Figure 2, in which the various types of data in the evidence model provide insight into how the content model develops for each player: tool-related actions show how players are experimenting in service of solving the problem; quest attempts and the associated failure codes describe the sequence of players’ inquiry; and the bug genotypes they choose to breed are evidence for their level of understanding of the inheritance pattern.
4.2. Data Analysis
4.2.1. Descriptive statistics by quest completion
The following analyses were performed in the “Bake Me a Cake” quest. Tool usage data including trait examiner, trait decoder, breeding station, and Punnett tool, were collected from the time participants began the quest until the last action participants took. The last action is the indicator of a participant’s quest completion status, showing whether they eventually succeeded or never completed the quest. Participants who completed the quest may have actually contributed tool usage data in both completion categories, if they had some unsuccessful turn-in attempts before eventually completing the quest. A participant who completed the quest without any unsuccessful attempts (i.e. on the first try) would only contribute usage data associated with a successful turn-in; whereas a participant who completed the quest but had at least one unsuccessful turn-in would contribute usage data associated with both the successful turn-in and the one unsuccessful turn-in that occurred just before the successful turn-in. Contrarily, participants who never completed the quest would only contribute usage data associated with the last unsuccessful turn-in. The tool usage data are summarized by students’ quest completion status, and the reasons for unsuccessful attempts (the failure codes described above) are also presented.
4.2.2. Association between quest completion status and tool usage
The association between quest completion status and tool usage was evaluated using polychoric correlation (Ekström, 2011; Olsson, Drasgow, & Dorans, 1982). We utilized polychoric correlation as it is, to the best of our knowledge, one of the few correlation measures designed for a pair of binary and continuous outcomes. Typical correlation
measures, such as Pearson or Spearman correlations, are not appropriate for this type of data, but more suitable for continuous or ordinal data. The correlation was based on student-level data (n=339), and the polycor package version 0.7-8 in R was used to carry out the analysis. The relationship between the genotype of glumbugs bred, as one key learning objective in the quest, and tool utilization was also investigated. For this, the percentage of glumbugs brought to the breeding station with homozygous genotypes is summarized by the amount of trait examiner use.
4.2.3. Modeling the probability of quest completion based on tool usage
A classification tree was utilized to model the probability of quest completion based on tool usage, with the size of the tree tuned by 20-fold cross-validation. Because classification trees are able to tease out interactions between predictors and visualize the decision process, this tool was ideal for our research objective of investigating how individual tools complement each other and contribute to quest completion. In addition, the classification tree partitioned each predictor using a binary split, providing teachers and game designers with knowledge about how many times students utilized the tool in order to adequately understand it. In the classification tree, the use of four individual tools – examiner, decoder, Punnett square and breeding station – were used as predictors, and the quest success as the outcome variable. The unit of analysis was also based on student level. Each student would contribute one record to the classification tree model. If a student never succeeds on the quest, the cumulative tool use up to the last turn-in event would be the predictor and the quest status would be incomplete. On the other hand, if a student completes the quest, the cumulative tool use would be the predictor and the quest status would be complete. We utilized student-level data at their last known event since a student could experience several failures before completing the quest. Our main concern about including the data collected from the same student during the intermediate steps was the data dependency that could potentially bias the classification tree model.
To avoid over-fitting the data, a tree pruning process was performed to simplify the tree structure and enhance interpretability. A 20-fold cross-validation was used to select the number of nodes in the classification tree based on minimizing the model deviance. Five- or ten-fold cross-validation is recommended as the number of folds for practical use (Friedman, Hastie, & Tibshirani, 2001). The smaller the fold, the smaller the cross-validation variance
would be, but the larger the bias. We chose a fold size of 20 to reduce the cross-validation error. R tree package, version 1.0-34, using CART algorithm as computation implementation, was utilized to conduct the analysis. The model deviance and classification error, Kappa statistic, weighted Gini index (Friedman, Hastie, and Tibshirani, 2001), and area under curve (AUC) were used as evaluation measures of goodness-of-fit for classification. All statistical analyses were done in R version 3.0.1 or later.
4.2.4. Additional methods considered
Our goal with the Radix data collection mechanisms was that data collected during gameplay and the appropriate data analysis methods would help validate and continually improve the learning designs. To ascertain the best EDM methods for this, we experimented with additional data mining techniques to investigate the association between quest status and various tools as well as other activities, apart from the correlation analysis and classification tree presented. This was done through contingency tables and inter-tool association using correlation analysis and clustering. However, we have only presented the correlation analysis and classification tree as they were deemed most pertinent to the study objectives. While a clustering technique may identify subgroups of students sharing similar patterns of tool use, and inter-tool association may shed some light on students’ understanding of individual tools and how each tool complements the others, these non-supervising learning techniques focus on the students’ activities without connecting their activities and the outcome, and thus cannot provide insightful feedback to game designers or users.
5. Results
The first step in understanding how players interacted with the “Bake Me a Cake” quest was to look at overall rates of quest attempts and completions, as well as the failure codes
associated with unsuccessful attempts. A total of 339 participants undertook the quest. Among them, 303 (89%) completed the quest eventually and 113 of the completers never made an unsuccessful attempt. Table 2 shows the failure codes associated with unsuccessful attempts among students who eventually succeeded and who never succeeded. For
participants who eventually succeeded, the reasons for quest failure on their way to success mostly lay in submitting objects that were not bred by the player himself (F4) (35.5%). Yet for those who never succeeded, the most common failure code was F1: submitted an incorrect
Punnett square (37.7%). Table 2.
The number and percentage of failure codes made by participants who eventually succeeded and who never succeeded.
F0 F1 F2 F3 F4 FT Eventually succeeded 47 (11.3%) 104 (24.6%) 9 (2.1%) 74 (17.5%) 150 (35.5%) 39 (9.2%) Never succeeded 13 (12.3%) 40 (37.7%) 1 (0.9%) 29 (27.4%) 2 (1.9%) 21 (19.8%) After understanding some of the obstacles in the process of quest completion, the next step was to examine how tools were used by different types of Radix participants during that process. To do this, the cumulative amount of tool use was calculated at the point of a successful turn-in, and at the most recent previous unsuccessful turn-in (Figure 3). To make sense of these results, one must keep in mind the play pattern of Radix in which players conduct experiments using in-game tools, then attempt a quest turn-in, then repeat the process if they were not successful. So in many cases, players have been using a certain strategy, or trying multiple strategies, and using the feedback from their experiments to refine that strategy. The initial tool use patterns describe their unsuccessful strategies, while the tool use patterns found at successful turn-in can show how they changed their strategy leading to quest success.
Figur
e 3. Mean number of uses of each tool. (top left: decoder use; top right: Punnett square use; bottom left: examiner use; bottom right: breeding station use)
At successful turn-in, the mean number of decoder uses was 3.14, the examiner was 5.25, the Punnett square was 1.95, and the breeding station was 3.09. The use of these tools and their associations with quest completion status were investigated by looking at the mean tool use stratified by the completion status. At the last unsuccessful turn-in before turning in the correct glumbugs, the average decoder use was 3.07, whereas that number only slightly increased to 3.14 at successful turn-in. The number of uses of the Punnett tool and breeding station also increased at most 25% from the last in before success to the successful turn-in. However, the number of examiner uses increased from 3.07 to 5.25. This 70% increase in use leading to quest success strongly suggests that the trait examiner was a key tool in the quest completion process.
The association of greater use of the examiner and quest completion was also evidenced through the correlation coefficient shown in Table 3 (r*=0.61, p<0.01). Table 3 also indicates
that use of the breeding station (r*=0.12, p>0.05), decoder (r*=0.01, p>0.05), and Punnett
Table 3.
The correlation coefficients between successful turn-ins and the number of uses of each tool (n=339).
Examiner use Decoder use Punnett square use Breeding station use
Correlation (r*) 0.61** 0.01 0.09 0.12
95% CI (0.46,0.75) (-0.17,0.21) (-0.10,0.29) (-0.07,0.32)
**p<0.01
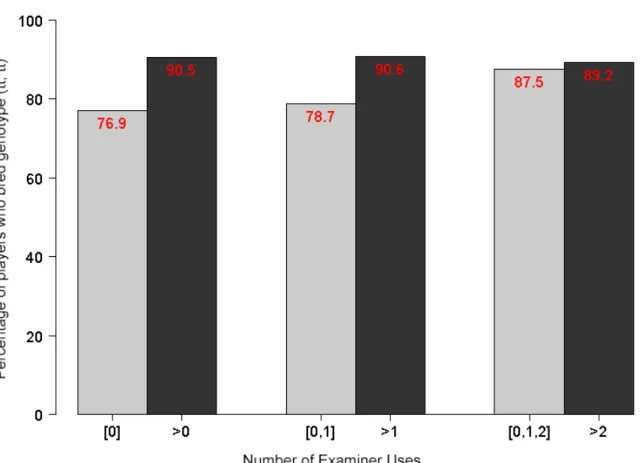
Given that the analyses conducted so far point toward the trait examiner as the most useful tool for this quest, the next step was to dig deeper by looking at the relationship between the use of the trait examiner and the combination of glumbug genotypes that players chose to bring to the breeding station. This is where tool use intersects with content knowledge and game strategy. Figure 4 shows that among participants who never used the examiner in this quest, the percentage of those that chose to breed homozygous non-toxic glumbugs (tt,tt) was 76.9%. This percentage increased to 90.5% among those who used the examiner at least once. This genotype combination is the most interesting to look at because in this genetics task (tt, tt) is the optimal solution as it would definitely produce non-toxic offspring. The results here imply that in this quest, the participants tended to use the trait examiner to find homozygous non-toxic glumbugs to breed, which is how the use of this tool can lead them to success.
Figure 4. Comparing the amount of trait examiner use with the selection of genotype combination (tt, tt) for breeding.
An increasing trend was observed again by contrasting participants who used the examiner none or once and those who used the examiner at least twice (78.7% vs. 90.6%). However, as long as participants used the examiner either once or twice, their percentage of breeding the optimal genotype was close to those who used the examiner more than three times (87.5% vs. 89.2%). These results suggest that the use of the examiner increases the likelihood of
breeding the optimal genotype. However, players were able to gain the benefit of the examiner within one or two uses, as evidenced by the fact that higher numbers of examiner use had diminishing returns in leading players to breed the optimal genotypes.
In Radix in general, and in this quest in particular, certain tools are used to gather information (about genotypes and phenotypes) and other tools are used to create artifacts (such as Punnett squares and glumbug offspring). Even the tools that create artifacts however, also provide players with additional feedback about their mental models and game strategies. The feedback they get from creating a Punnett square or trying a certain cross can be used to
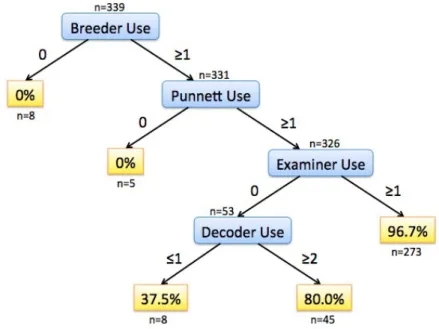
inform their next steps in a quest. For this reason, the combination of tools that players use and the frequency with which they use each one has a meaningful relationship to their content understanding and its development. To get a more comprehensive view of the relationship between quest success rates and tool usage patterns, a classification tree technique was utilized. The classification tree was pruned using 20-fold cross-validation, and we evaluated the model’s goodness of fit using various measures. The Kappa statistic and AUC were 0.60 and 0.84, both ranging from 0 to 1 with larger values suggesting better fit, indicating
moderate to substantial agreement and good prediction accuracy (Viera & Garrett, 2005; Hosmer & Lemeshow, 2000; Kabakchieva, 2012). In addition, the Gini index, model
deviance and classification error were 0.11, 134.7, and 5.3%, respectively. These 3 measures have the reverse directionality where smaller values suggest a better fit. The resulting tree is shown in Figure 5, and from it we see a number of possible player outcomes. If players never used the breeding station and/or Punnett square, the possibility of completing the quest was zero. This is because players must breed at least once and create a Punnett square in order to have the correct objects to turn in. If the player used the breeding station and Punnett tool at least one time each, and they also used the examiner at least once, the possibility of success jumped to 96.7%. Alternatively, if the player used the breeding station and Punnett tool one or more times, but didn’t use the examiner at all, they still had a success rate of 80% as long as they used the decoder at least twice; otherwise, the possibility of success dropped to 37.5% with zero or one decoder uses. In essence, a lack of trait examiner usage can be made up for with additional decoder uses, displaying multiple pathways to success in this quest.
usage patterns.
6. Discussion
Digital games, especially online games set in rich virtual worlds, now afford the opportunity to collect large amounts of data. Certainly many game designers and developers are taking advantage of that possibility, building robust back-end data systems into their software
(Drachen, Thurau, Togelius, Yannakakis, & Bauckhage, 2013). The important questions to be asked however, are how do we make that data meaningful, and who is it useful for? The methods of analysis used in this study and the resulting usage patterns indicate some useful ways that gameplay data can provide insights in two main areas. The first is for game designers to know how players are interacting with and learning from their game, and how that supports or impedes the way they intended the game to be played. The second is for players themselves as well as their teachers to get information on how they are progressing through the game, and to provide help they may need based on strategies and misconceptions identified in the data.
In the “Bake Me a Cake” quest, analysis of the gameplay data revealed common mistakes for different types of players, which tools players found most useful in solving the quest, and common pathways players took to arrive at quest completion. This data doesn’t speak directly to student learning or content acquisition, but rather it focuses on choices players make that enable them to interact with game content in various ways. Different combinations of these findings have implications in different areas of game design and implementation. This presents a rich area for understanding gameplay patterns and how they lead to success on game tasks, which can ultimately bring out content understanding and skill building (Hawlitschek & Köppen, 2014).
RQ1 asks how students interact with game mechanics to complete quests, and data from this study provides a clearer picture of that for the “Bake Me a Cake” quest. We saw that while players did use the trait decoder tool, it wasn’t as likely to lead to success as the examiner tool, which was the key to quest completion for more players. Digging deeper into the choice between these two tools, the classification tree shows that successful players either use the examiner or the decoder but they require more decoder uses to find success. It is useful for
quest designers to know that different players come up with different strategies, as evidenced by their actions, because this may also speak to their understanding of genetics content. Some players base their breeding decisions on the phenotypes of the bugs and are able to find success that way, perhaps refining their hypothesis later on during the breeding step. Other players choose to get more detail about the genotypes, perhaps figuring out the dominant-recessive pattern before breeding their bugs. Those players may not need to examine the phenotypes since they have figured them out based on the genotypes. Both strategies are valid and can lead to success, and therefore both should be supported by the game’s available tools. More broadly, the data paints a picture of Radix gameplay in which players have to consciously choose between the available tools and in which they may find multiple pathways to success. This was one of the original design goals of the game in order to provide players with a sense of agency, create an open-ended problem space, and enable players to develop strategies that build off of their existing content knowledge or gameplay styles. While the quantitative gameplay data alone can’t explain exactly why players end up going down their chosen pathways, the study shows that this kind of tool use data can tell designers where differences exist and offer clues as to which ones tend to be most successful. RQ2 asks what impact the data can have on game design and quest design. In this case, the data validates the design goal of supporting multiple pathways. It also enables designers to carefully consider the quest experience from the perspective of players using each strategy, even if those strategies were not anticipated. If players that choose the decoder pathway seem to struggle earlier on, for instance, relevant scaffolds could be built in to guide them along their chosen pathway. While it is difficult to guess at where these supports are needed, data describing emergent behaviors can indicate where the learning experience can be improved. While teachers may not be directly playing Radix, they are one of the key stakeholders given that they must work out how best to implement the game in their classroom and help students use it as a learning tool. We know that teachers want access to student data but it has to be data that can clearly inform their instruction. Often this is most useful when it is related to interactions with the content, in this case genetic crosses. Comparing groups of players who did and did not breed the optimal genotypes, and groups of players who used the trait examiner varying amounts, suggested that using the examiner was helpful to players as they then figured out which genotype would help accomplish their task. Teachers would be interested to know which combination of groups struggling students fall into. Armed with information on what genotype choices they were making, as well as which tools they had
tried, they could then provide tailored instruction to students. In some cases a teacher might suggest students use the trait examiner and work with them on what traits they were looking for. In other cases, if a student was already using the examiner, a teacher might know that they need more help with how inheritance patterns work. This type of data doesn’t presume to identify what exactly students’ misconceptions are, but rather it arms the teacher with information she can use to tailor instruction at the class or even student level.
Another potential strength of digital games is that they can contain built-in systems to provide just-in-time feedback to players based on some real-time analysis of their actions. This is a bit different than an adaptive system as it doesn’t make choices for the player but rather offers them tips and calls attention to areas of the game they may not have engaged with. Much of this analysis can be based on the behavior and outcomes of previous players. In this study it was found that players who eventually completed the quest and players who never were successful committed errors with different frequencies. If the game were to track this, it might presume that players who submitted something they hadn’t bred themselves would eventually figure out what to do, based on behavior patterns of previous players. On the other hand, players who are submitting incorrect Punnett squares are historically less likely to complete the quest and therefore the game could be designed to intervene earlier, offering a tutorial quest on genotypes or an outside resource on probability. Similar feedback could be provided based on the classification tree analysis of previous players. Based on which tools had been used by the current players and how much, the game could offer a variety of help resources to scaffold players’ in-game interactions and content understanding. Using this data-backed strategy, players would have more resources available to overcome obstacles without waiting for a teacher’s assistance. RQ3 asks how the data can inform feedback systems for teachers and players. By analyzing data from the evidence model, we gain insights into how players are developing their content models (as described in figure 2), and therefore how the game and teachers can intervene to support that development.
By conducting these analyses on actual player data collected during the Radix pilot, some useful strategies for collecting, analyzing, and using gameplay data have been developed. These are strategies that have not been widely explored or applied in the field of game-based learning. While the scope of this study was limited to one quest, similar methods could be used to compare player behavior across quests and even across questlines and topic areas. This would help researchers understand player progress over time and throughout the game.
Along with that type of work, the next steps would be to make use of these methods in the actual learning environment. This would mean developing real-time analysis into the software, as well as a mechanism for communicating actionable results to both teachers and students. For example possibilities include adding a series of student flags to the teacher dashboard to inform teachers where each student is struggling or excelling, and adding hints and additional content resources to the student experience.
Beyond Radix, the methods explored here can be applied to analytics and feedback systems in other digital games. The types of data and findings discussed in this paper are likely to be relevant in other educational MMOGs, but more holistically this approach to designing and utilizing data can be adapted to games in other genres as well. Looking at player choices and the outcomes of gameplay for distinct player groups, then translating that into useful
feedback to aid designers, teachers, and students, can lead to increased relevance and personalization of game-based analytics (El-Nasr, Drachen, & Canossa, 2013). Building systems for data collection, analysis, and results delivery directly into the software can help produce games that are more clearly aligned with learning goals and that are more easily integrated into a classroom curriculum. This means that teachers will be more likely to adopt the game and that students will get more out of the gameplay experience, thereby improving both instructional and learning experiences.
References
Annetta, L. A., Minogue, J., Holmes, S. Y., & Cheng, M.-T. (2009). Investigating the impact of video games on high school students’ engagement and learning about genetics.
Computers & Education, 53(1), 74-85.
doi:http://dx.doi.org/10.1016/j.compedu.2008.12.020
Baker, R. (2010). Data Mining for Education. International Encyclopedia of Education, 7, 112-118.
Baker, R. & Siemens, G. (2014). Educational data mining and learning analytics. In K. Sawyer (Ed.) Cambridge Handbook of the Learning Sciences (2nd ed., pp. 61-75).
New York: Springer.
Baker, R. & Yacef, K. (2009). The state of educational data mining in 2009: A review and future vision. Journal of Educational Data Mining, 1(1), 3-17.
Quest Atlantis, a game without guns. Educational Technology Research and Development, 53(1), 86-107. doi:10.1007/bf02504859
Barab, S.A., Dodge, T., Ingram-Goble, A., Volk, C., Peppler, K., Pettyjohn, P., & Solomou, M. (2010). Pedagogical dramas and transformational play: Narratively-rich games for learning. Mind, Culture, and Activity 17(3), 235–264.
Cheng, M.-T., Lin, Y.-W., & She, H.-C. (2015). Learning through playing Virtual Age: Exploring the interactions among student concept learning, gaming performance, in-game behaviors, and the use of in-in-game characters. Computers & Education, 86, 18-29. doi:http://dx.doi.org/10.1016/j.compedu.2015.03.007
Cheng, M.-T., Su, T., Huang, W.-Y., & Chen, J.-H. (2014). An educational game for learning human immunology: What do students learn and how do they perceive? British
Journal of Educational Technology, 45(5), 820-833. doi:10.1111/bjet.12098
Chung, G. K. W. K. (2015). Guidelines for the design and implementation of game telemetry for serious games. In C. S. Loh, Y. Sheng, & D. Ifenthaler (Eds), Serious Games
Analytics: Methodologies for performance measurement, assessment, and improvement (pp. 59-79). Springer International Publishing.
Clark, D. B., Tanner-Smith, E., & Killingsworth, S. (First Online 2015). Digital games, design, and learning: A systematic review and meta-analysis. Review of Educational Research. DOI: 10.3102/0034654315582065, first published on April 16, 2015. http://journals.sagepub.com/doi/pdf/10.3102/0034654315582065
Connolly, T. M., Boyle, E. A., MacArthur, E., Hainey, T., & Boyle, J. M. (2012). A systematic literature review of empirical evidence on computer games and serious games. Computers & Education, 59(2), 661-686.
doi:http://dx.doi.org/10.1016/j.compedu.2012.03.004
Dede, C. (2009). Immersive interfaces for engagement and learning. Science, 323(5910), 66-69. doi:10.1126/science.1167311
Dede, C. (Ed.). (2015). Data-Intensive Research in Education: Current Work and Next Steps. Retrieved from CRA Website:
http://cra.org/wp-content/uploads/2015/10/CRAEducationReport2015.pdf
Deniz, E., Victor, L., Dirk, I., Xun, G., & Raymond, M. (2014). An investigation of the interrelationships between motivation, engagement, and complex problem solving in game-based learning. Journal of Educational Technology & Society, 17(1), 42-53. DiCerbo, K. E. & Kidwai, K. (2013). Detecting player goals from game log files. Paper
TN.
Dickey, M. D. (2007). Game design and learning: a conjectural analysis of how massively multiple online role-playing games (MMORPGs) foster intrinsic motivation.
Educational Technology Research and Development, 55(3), 253-273.
doi:10.1007/s11423-006-9004-7
Drachen, A., Thurau, C., Togelius, J., Yannakakis, G. N., & Bauckhage, C. (2013). Game Data Mining. In M. Seif El-Nasr, A. Drachen, & A. Canossa (Eds.), Game Analytics:
Maximizing the Value of Player Data (pp. 205-253). London: Springer London.
Ekström, J. (2011). A generalized definition of the polychoric correlation coefficient. Retrieved from UCLA eScholarship website:
http://escholarship.org/uc/item/583610fv
El-Nasr, M. S., Drachen, A., & Canossa, A. (2013). Game analytics: Maximizing the value of
player data. London: Springer Science & Business Media.
Eseryel, D., Ge, X., Ifenthaler, D., & Law, V. (2011). Dynamic modeling as a cognitive regulation scaffold for developing complex problem-solving skills in an educational massively multiplayer online game environment. Journal of Educational Computing
Research, 45(3), 265-286. doi:10.2190/EC.45.3.a
Freire, M., Serrano-Laguna, Á., Iglesias, B. M., Martínez-Ortiz, I., Moreno-Ger, P., &
Fernández-Manjón, B. (2016). Game learning analytics: Learning analytics for serious games. Learning, design, and technology, 1-29.
Friedman, J., Hastie, T., & Tibshirani, R. (2001). The elements of statistical learning (Vol. 1). Springer, Berlin: Springer series in statistics.
Gee, J. P. (2007). What video games have to teach us about learning and literacy. New York: Palgrave Macmillan.
Gee, J. P. (2013). The anti-education era: Creating smarter students through digital learning. Macmillan.
Groff, J. Clarke-Midura, J., Owen, V. E., Rosenheck, L., & Beall, M. (2015). Better learning in games: A balanced design lens for a new generation of learning games [white paper]. Cambridge, MA: MIT Educational Arcade and Learning Games Network. Hauge, J. B., Berta, R., Fiucci, G., Manjón, B. F., Padrón-Nápoles, C., & Nadolski, R. (2014,
July). Implications of learning analytics for serious game design. In 2014 IEEE 14th
International Conference on Advanced Learning Technologies (pp. 230-232). IEEE.
Hawlitschek, A., & Köppen, V. (2014). Analyzing player behavior in digital game-based
European Conference on Games Based Learning, Berlin, Germany. Hegland, M. (2001). Data mining techniques. Acta Numerica, 10, 313-355.
Hickey, D., Ingram-Goble, A., & Jameson, E. (2009). Designing Assessments and Assessing Designs in Virtual Educational Environments. Journal of Science Education and
Technology, 18, 187-208.
Hosmer, D. W. & Lemeshow, S. (2000). Applied Logistic Regression (2nd ed). New York:
John Wiley & Sons.
Honey, M. A., & Hilton, M. (Eds.). (2011). Learning science through computer games and
simulations. National Academies Press.
Jenkins, H. (2004). Game design as narrative architecture. Retrieved from http://www.electronicbookreview.com/thread/firstperson/lazzi-fair
Ke, F. (2008). Computer games application within alternative classroom goal structures: cognitive, metacognitive, and affective evaluation. Educational Technology Research
and Development, 56(5), 539-556. doi:10.1007/s11423-008-9086-5
Kerr, D. (2015). Using data mining results to improve educational video game design.
Journal of Educational Data Mining. 7(3), 1-17.
Ketelhut, D. J. (2007). The Impact of student self-efficacy on scientific inquiry skills: An exploratory investigation in River City, a multi-user virtual environment. Journal of
Science Education and Technology, 16(1), 99-111. doi:10.1007/s10956-006-9038-y
Kong, J. S.-L., Kwok, R. C.-W., & Fang, Y. (2012). The effects of peer intrinsic and extrinsic motivation on MMOG game-based collaborative learning. Information &
Management, 49(1), 1-9. doi:http://dx.doi.org/10.1016/j.im.2011.10.004
Lee, J., Luchini, K., Michael, B., Norris, C., & Soloway, E. (2004). More than just fun and
games: assessing the value of educational video games in the classroom. Paper
presented at the CHI '04 Extended Abstracts on Human Factors in Computing Systems, Vienna, Austria.
Levy, R. (2014). Dynamic Bayesian network modeling of game based diagnostic assessments. CRESST Report 837. Los Angeles, CA: University of California, National Center for Research on Evaluation, Standards, and Student Testing (CRESST).
Liu, M., Kang, J., Liu, S., Zou, W., & Hodson, J. (2017). Learning Analytics as an Assessment Tool in Serious Games: A Review of Literature. In M. Ma & A. Oikonomou (Eds.), Serious Games and Edutainment Applications : Volume II (pp. 537-563). Cham: Springer International Publishing.
Loh, C. S., Sheng, Y., & Ifenthaler, D. (2015). Serious games analytics: Methodologies for performance measurement, assessment, and improvement. Springer International Publishing.
Lotfi, E., Amine, B. & Mohammed, B. (2014). Players performances analysis based on educational data mining case of study: Interactive waste sorting serious game.
International Journal of Computer Applications, 108(11), 13-18.
Mislevy, R. J., Almond, R. G., & Lukas, J. F. (2003). A brief introduction to evidence‐ centered design. ETS Research Report Series, 2003(1), i-29.
Mislevy, R. J., Oranje, A., Bauer, M. I., von Davier, A. A., Hao, J., Corrigan, S., . . . John, M. (2014). Psychometric considerations in game-based assessment [white paper].
GlassLab Research, Institute of Play.
Olsson, U., Drasgow, F., and Dorans, N. J. (1982), The polyserial correlation coefficient,
Biometrika, 47, 337–347.
Owen, V. E. (2014). Capturing in-game learner trajectories with ADAGE (Assessment Data
Aggregator for Game Environments): A cross-method analysis. Unpublished
dissertation. The University of Wisconsin-Madison.
Owen, V. E. (2015). Using learning analystics to support educational game development: A
data-driven design apporach. Paper presented at the American Educational Research
Association (AERA) annual meeting, Chicago, IL.
Papastergiou, M. (2009). Digital game-based learning in high school computer science education: Impact on educational effectiveness and student motivation. Computers &
Education, 52(1), 1-12. doi:http://dx.doi.org/10.1016/j.compedu.2008.06.004
Peña-Ayala (2014). Educational data mining: A survey and a data mining-based analysis of recent work. Expert Systems with Applications, 41(4), 1432-1462.
Peppler, K., A. & Solomou, M. (2011). Building Creativity: Collaborative Learning and Creativity in Social Media Environments. On The Horizon, 19(1), 13 - 23. Prensky, M. (2006). Don't bother me mon—I'm learning! St. Paul, MN: Paragon house. Qian, M. & Clark, K. R. (2016). Game-based Learning and 21st century skills: A review of
recent research. Computers in Human Behavior, 63, 50-58.
Reisoğlu, I., Topu, B., Yılmaz, R., Yılmaz, T. K., & Göktaş, Y. (2017). 3D virtual learning environments in education: a meta-review. Asia Pacific Education Review, 18(1), 81-100.
Romero, C. & Ventura, S. Educational data mining: A survey from 1995 to 2005. Expert
Rowe, E., Asbell-Clarke, J., & Baker, R. S. (2015). Serious games analytics to measure implicit science learning. In C. S. Loh, Y. Sheng, & D. Ifenthaler (Eds), Serious
Games Analytics: Methodologies for performance measurement, assessment, and improvement (pp. 343-360). Springer International Publishing.
Sabourin, J., Rowe, J., Mott, B. W., & Lester, J. C. (2012). Exploring inquiry-based problem-solving strategies in game-based learning environments. In S. A. Cerri, W. J. Clancey, G. Papadourakis, & K. Panourgia (Eds.), Intelligent Tutoring Systems: 11th
International Conference, ITS 2012, Chania, Crete, Greece, June 14-18, 2012. Proceedings (pp. 470-475). Berlin, Heidelberg: Springer Berlin Heidelberg.
Sangeetha, K. V., & Rajeshwari, P. (2012). Data mining and warehousing. Journal of
Computer Applications, 5(1), 35-43.
Shute, V. J. (2011). Stealth assessment in computer-based games to support learning. In S. Tobias and J. D. Fletcher (Eds.), Computer Games and Instruction (pp. 503–524). Charlotte, NC: Information Age Publishers.
Shute, V. J., & Ke, F. (2012). Games, learning, and assessment. In D. Ifenthaler , D. Eseryel, & X. Ge (Eds), Assessment in game-based learning (pp. 43-58). Springer New York. Shute, V. J. & Ventura, M. (2013). Measureing and supporting learning in games: Stealth
assessment. Cambridge, MA: The MIT Press.
Shute, V. J., Ventura, M., Bauer, M. I., & Zapata-Rivera, D. (2009). Melding the power of serious games and embedded assessment to monitor and foster learning: Flow and grow. In U. Ritterfeld, M. Cody, & P. Vorderer (Eds.), Serious games: Mechanisms
and effects (pp. 295-321). Mahwah, NJ: Routledge, Taylor and Francis.
Squire, K. (2011). Video Games and Learning: Teaching and Participatory Culture in the
Digital Age. Technology, Education--Connections (the TEC Series). New York, NY:
Teachers College Press.
Steinkuehler, C. A. (2004). Learning in massively multiplayer online games. Paper presented at the 6th international conference on Learning sciences, Santa Monica, California. Takeuchi, L. M., & Vaala, S. (2014). Level up learning: A national survey on teaching with
digital games. New York: The Joan Ganz Cooney Center at Sesame Workshop.
Tüzün, H., Yılmaz-Soylu, M., Karakuş, T., İnal, Y., & Kızılkaya, G. (2009). The effects of computer games on primary school students’ achievement and motivation in geography learning. Computers & Education, 52(1), 68-77.
doi:http://dx.doi.org/10.1016/j.compedu.2008.06.008
statistic. Family Medicine, 37(5), 360-363.
Vogel, J. J., Vogel, D. S., Cannon-Bowers, J., Bowers, C. A., Muse, K., & Wright, M. (2006). Computer gaming and interactive simulations for learning: A meta-analysis.
Journal of Educational Computing Research, 34(3), 229-243.
doi:10.2190/flhv-k4wa-wpvq-h0ym
Warren, S. J., & Dondlinger, M. J. (2008). A MUVE towards PBL writing: Effects of a digital learning environment designed to improve elementary student writing. Journal
of Research on Technology in Education, 41(1), 113-140.
Wouters, P., van Nimwegen, C., van Oostendorp, H., & van der Spek, E. D. (2013). A meta-analysis of the cognitive and motivational effects of serious games. Journal of
Educational Psychology, 105(2), 249-265. doi:10.1037/a0031311
Young, M., Schrader, P. G., & Zheng, D. (2006). MMOGs as learning environments: An ecological journey into Quest Atlantis and the Sims Online. Innovate: Journal of
online education, 2(4). Retrieved from http://nsuworks.nova.edu/cgi/viewcontent.cgi? article=1135&context=innovate