HAL Id: hal-01267760
https://hal.archives-ouvertes.fr/hal-01267760
Submitted on 29 May 2020HAL is a multi-disciplinary open access archive for the deposit and dissemination of sci-entific research documents, whether they are pub-lished or not. The documents may come from
L’archive ouverte pluridisciplinaire HAL, est destinée au dépôt et à la diffusion de documents scientifiques de niveau recherche, publiés ou non, émanant des établissements d’enseignement et de
Aphids at crossroads: when branch architecture alters
aphid infestation patterns in the apple tree
Sylvaine Simon, Karine Morel, Emilie Durand, Géraldine Brevalle, Thierry
Girard, Pierre-Eric Lauri
To cite this version:
Sylvaine Simon, Karine Morel, Emilie Durand, Géraldine Brevalle, Thierry Girard, et al.. Aphids at crossroads: when branch architecture alters aphid infestation patterns in the apple tree. Trees - Structure and Function, Springer Verlag, 2012, 26 (1), pp.273-282. �10.1007/s00468-011-0629-8�. �hal-01267760�
Version définitive du manuscrit publié dans / Final version of the manuscript published in : Trees, 2011, vol.26, n.1, 273-282
nuscript Manuscrit d’auteur
/ Author manuscript Manuscrit
d’auteur / Author manuscript
Aphids at crossroads: when branch architecture alters aphid infestation patterns in the apple 1
tree 2
3
Simon S.1, Morel K.1, Durand E.1, Brevalle G.1, Girard T.1, Lauri P.É.2 4
5
1 INRA, Unité Expérimentale Recherche Intégrée UE695, Gotheron, 26320
Saint-Marcel-lès-6
Valence, France 7
2 INRA, UMR AGAP, #1334, Equipe ‘Architecture et Fonctionnement des Espèces
8
Fruitières’, CIRAD Lavalette, Avenue Agropolis, TA A-108/03, 34398 Montpellier Cedex 5, 9
France 10
11
Correspondence: Sylvaine Simon. Tel.: +33 (0)475.59.92.21; Fax: +33 (0)475 58 86 26; 12
E-mail: [email protected]
13
14
15
Running title: Branch architecture and aphid infestation 16
Version définitive du manuscrit publié dans / Final version of the manuscript published in : Trees, 2011, vol.26, n.1, 273-282
nuscript Manuscrit d’auteur
/ Author manuscript Manuscrit
d’auteur / Author manuscript
Abstract
17
1. Plant architecture highly constrains pest infestation but is rarely considered in studies on 18
plant-insect interactions. We analysed the relationships between apple tree architectural 19
traits manipulated by tree training and within-branch development of Dysaphis 20
plantaginea (rosy apple aphid, RAA), a major apple pest, during its multiplication
21
wingless phase in spring. We hypothesised that the degree of branching had an effect on 22
RAA within-branch infestation. 23
2. In an experimental apple orchard, the infestation by aphid wingless forms was surveyed in 24
two consecutive spring seasons within branches manipulated to design contrasted 25
architectures differing in shoot numbers, shoot density and branching orders. 26
3. Whatever the branch management system, aphid infestation was higher on long vs. short, 27
fruiting vs. vegetative, and growing vs. non-growing shoots. Either less infested shoots or 28
less severe infestation were observed in the most branched system. A pattern of within-29
branch short-distance infestation was confirmed. Moreover, the number of branching 30
points between two shoots exerted a high constraint on this infestation pattern. 31
4. Beside possible trophic effects due to plant growth patterns already documented in the 32
literature, a high degree of branching is likely to be a key-architectural trait to constrain 33
within-branch aphid infestation. This opens new perspectives on the manipulation of 34
branch architecture as a mean giving partial control of pests towards sustainable fruit 35
production. 36
37
Key-words: branching order, Dysaphis plantaginea (rosy apple aphid), habitat complexity,
38
infestation pattern, Malus x domestica, plant architecture 39
Version définitive du manuscrit publié dans / Final version of the manuscript published in : Trees, 2011, vol.26, n.1, 273-282
nuscript Manuscrit d’auteur
/ Author manuscript Manuscrit
d’auteur / Author manuscript
INTRODUCTION
40
Training of fruit trees is used by growers to enhance yield, fruit quality and return-41
bloom in orchards (Wertheim 2005a; 2005b). Tree spatial and temporal organisation, i.e. tree 42
architecture (Bell 1991; Hallé et al. 1978), is therefore periodically modified through pruning, 43
branch bending and selective removal of fruiting and/or vegetative shoots to distribute fruits 44
and increase light penetration within the tree canopy (Costes et al. 2006; Lauri et al. 2004; 45
Lauri and Laurens 2005; Lauri et al. 2009). Because plant architecture shapes the habitat and 46
living conditions of pests and their natural enemies (Lawton 1983; Price et al. 1980), an 47
alteration of the population dynamics of pests is expected from tree training performed by 48
growers. However, this latter topic is still little documented (Kührt et al. 2006; Simon et al. 49
2007a; Stoeckli et al. 2008a). 50
Some studies on the topic revealed significant effects of fruit tree architecture 51
manipulation or aspect and height on pest and disease development (Grechi et al. 2008; Holb 52
et al. 2001; Mani et al. 1995; Prokopy et al. 2001; Simon et al. 2006; Simon et al. 2007b; 53
Stoeckli et al. 2008a), with favourable or unfavourable effects on infestation or infection 54
rates, depending on the studied pest or disease. Most of these experimental studies were 55
descriptive only. Despite proposed hypotheses to explain the observed results, mechanisms 56
were rarely investigated in fruit trees (Simon et al. 2007a). Literature on other plant models 57
(e.g. Pistacia, Martinez and Wool 2003; Cotton, Anderson and Agrell 2005; Birch, Riihimäki 58
et al. 2006) can help identifying the underlying processes which include growth patterns: 59
plant sectoriality (Araújo et al. 2006; Larson and Whitham 1997; Marquis 1996; Orians and 60
Jones 2001), habitat complexity (Finke and Denno 2006; Langellotto and Denno 2004; 61
Lawton 1983) and connectivity (Hanan et al. 2002; Skirvin and Fenlon 2003). In apple, which 62
is one of the most documented fruit tree production, effects of tree architecture were reported 63
on codling moth, Cydia pomonella (L.) (Lepidoptera: Tortricidae), (Simon et al. 2007b; 64
Version définitive du manuscrit publié dans / Final version of the manuscript published in : Trees, 2011, vol.26, n.1, 273-282
nuscript Manuscrit d’auteur
/ Author manuscript Manuscrit
d’auteur / Author manuscript
Stoeckli et al. 2008a) and the rosy apple aphid (RAA), Dysaphis plantaginea (Passerini) 65
(Hemiptera: Aphididae) (Simon et al. 2006). Both are major pests of apple trees, which may 66
cause serious damages to fruits (codling moth), shoots, fruits and branches (RAA; 67
Bonnemaison 1959; Deberardinis et al. 1994). These pests require pesticide use to be kept 68
under control. Hypotheses to explain results were related to microclimate and fruit phenology 69
for the flying pest, i.e. the codling moth, (Stoeckli et al. 2008a) and within–branch shoot 70
distribution in spring for the walking wingless RAA pest (Simon et al. 2006). Indeed, RAA 71
winter eggs laid in autumn by aphids re-emigrating on their primary host, the apple tree, hatch 72
around March in the area, and stem mothers infest buds before bloom. During a 73
parthenogenesis phase, primary and then secondary colonies develop on trees and cause 74
damage, mainly through severe leaf curling during fruit and shoot growth in spring 75
(Bonnemaison 1959). At this time, because winged forms are not present before infestation 76
peak and/or fly away from apple towards their secondary host-plant Plantago spp. 77
(Plantaginaceae) (Bonnemaison 1959), founders of new colonies within the branches are 78
mainly ‘pedestrians’ which can be seen walking on the branch axes. Branch architecture, as 79
defined by structural and growth traits, is expected to constrain the RAA’s movement patterns 80
in its walking behaviour. 81
Here we aim to identify some of the architectural parameters affecting RAA within-82
tree development in spring before it flies to its secondary host. The approach is based on the 83
study of RAA development within branches belonging to the same apple cultivar but with two 84
pruning strategies to design contrasted branch architectures. The two experimented branch 85
managements belonging to known tree training systems are first presented and their effects on 86
branch architecture assessed. Then architectural parameters of both branch managements are 87
analysed for their effects on RAA development. Our main hypothesis was that the degree of 88
Version définitive du manuscrit publié dans / Final version of the manuscript published in : Trees, 2011, vol.26, n.1, 273-282
nuscript Manuscrit d’auteur
/ Author manuscript Manuscrit
d’auteur / Author manuscript
spring when walking from one leafy shoot to another. Lastly, the potential of tree architecture 90
manipulation as a method giving partial control of orchard pests is discussed. 91
92
MATERIALS AND METHODS
93
The study was carried out in May 2007 and 2008 at the INRA (National Institute for 94
Agricultural Research) Gotheron experimental unit in South-East France (44°58’33” North, 95
4°55’45” East). Located in the middle Rhône Valley, the area has a continental climate with 96
summer Mediterranean influences. The soil in the area has a sandy-loam shallow and stony 97
structure derived from old washed out sediments of the Rhône river. 98
99
1. Experimental orchard and tree training systems
100
The experimental orchard was planted in 2001 with cv. ‘Pitchounette’ (INFEL
3318), a 101
scab Vf-resistant cultivar, grafted onto M9, which is moderately susceptible to RAA 102
(Parveaud et al. 2010). One tree out of ten was a pollinator tree. Tree density was 1110 103
trees.ha-1 with 4.5 m between-row and 2 m within-row planting distances. Each of the eight 104
North-South oriented rows of the orchard included 15 trees. All trees had a similar pest and 105
disease management, watering, fertilising, within-row chemical weeding and grass mowing in 106
the orchard alleys. During the first four years after planting, i.e. from 2001 to 2004, all trees 107
were trained to the original solaxe system (OS; Lauri and Lespinasse 2000; Willaume et al. 108
2004). In brief, the OS system is based on three main rules: a vertical trunk up to 2.5 m or 109
more, a regular distribution of 10 to 15 main branches, i.e. issued from the trunk, on average 110
along and around the trunk from 1m onwards (branches in excess are completely removed) 111
and the bending below the horizontal of all branches. There was no pruning within each 112
individual branch, except the removal of vigorous shoots (‘water shoots’) which may appear 113
on the bent portions of branches and trunk. In 2005, four blocks of two contiguous rows were 114
Version définitive du manuscrit publié dans / Final version of the manuscript published in : Trees, 2011, vol.26, n.1, 273-282
nuscript Manuscrit d’auteur
/ Author manuscript Manuscrit
d’auteur / Author manuscript
designed and each row within a block was assigned at random to one of the following training 115
systems: 116
(i) Original solaxe as in previous years, 117
(ii) Centrifugal training (CT; Lauri et al. 2004; Lauri et al. 2007) with the thinning-out of 118
young fruiting shoots in all sites where they have a poor development due to low light 119
level that is on the underside and on the proximal part of the main branches, and around 120
the trunk. This procedure, called extinction pruning (Lauri 2009), aimed at decreasing 121
branching density along the main axes of the branches to improve both the development 122
of the remaining shoots and light penetration within the tree. 123
The two training systems therefore led to trees which did not differ in their cylindrical shape, 124
but rather in their internal architecture with a contrasted spatial distribution of shoots within 125
the branches. Within each row two infested branches, four- to five-year-old, directly issued 126
from the trunk were selected on two ‘Pitchounette’ trees, one branch per tree, after petal fall 127
in late April of years 2007 and 2008. This yielded to a total of eight branches per training 128
system. These branches were selected at similar height from the ground (1 m-1.5 m) and were 129
representative of each training system in terms of volume and branching. They belonged to 130
trees which had no RAA infestation symptoms on other branches. All branches of adjacent 131
trees touching the studied branches were removed. Each selected branch was considered as an 132
independent repetition and was subjected to architectural description and RAA assessment. 133
As aphid infestation naturally occurred in the orchard and could be unevenly distributed 134
between inner and outer parts of the orchard after the return-flight of aphids from their 135
secondary host, a block design was preferred to account for a possible infestation gradient. 136
137
2. Description of branch architecture
Version définitive du manuscrit publié dans / Final version of the manuscript published in : Trees, 2011, vol.26, n.1, 273-282
nuscript Manuscrit d’auteur
/ Author manuscript Manuscrit
d’auteur / Author manuscript
Branch architecture was described by recording the position of each current-year shoot on 139
which RAA could potentially develop within the branch (Fig. 1). More precisely, two 140
concepts were used in our recording: branching order and rank of insertion on the main axis 141
of the branch. 142
- The branching order of a current-year shoot is the number of branching points between the 143
main axis of the branch and this shoot. Namely, the main axis of the branch has a branching 144
order of 0, a sub-branch inserted on the main axis has a branching order of 1, a sub-branch 145
inserted on a ‘order 1’-sub-branch has a branching order of 2, etc. 146
- The rank of insertion numbers each shoot along the main axis of the parent branch from the 147
proximal, i.e. near the trunk, to the distal parts of the branch. Each current-year shoot is then 148
characterised by a list of numbers giving the rank of insertion of each intermediate sub-branch 149
between the main axis of the branch and this shoot. For example, a current-year shoot 150
numbered ‘5-1’ is the first shoot inserted on the fifth sub-branch inserted on the main axis of 151
the branch when counting from the proximal part of the branch (Fig. 1). This description 152
permitted identification of the topological proximity of shoots and recording of the number of 153
branching points between the apices of two adjacent shoots. As an example, on Figure 1, the 154
two nearest (adjacent) neighbour shoots of ‘1-2’ shoot (order 2) are ‘1-1-1’ (order 3) and ‘1-3’ 155
(order 2) in proximal and distal topological positions, respectively, and the number of 156
branching points that a walking aphid would meet from the apex of ‘1-1-1’ shoot to ‘1-2’ 157
apex is 3. In parallel to its topological position, each shoot was described and assigned to the 158
following groups: length category (short, < 5 cm; long, ≥ 5 cm), growing status (yes/no, i.e. 159
presence of newly emitted leaves or not if growth has stopped), and reproductive status 160
(yes/no). 161
162
3. Pest management and assessment of the RAA development
Version définitive du manuscrit publié dans / Final version of the manuscript published in : Trees, 2011, vol.26, n.1, 273-282
nuscript Manuscrit d’auteur
/ Author manuscript Manuscrit
d’auteur / Author manuscript
RAA control consisting of one mineral oil and one acetamiprid applied before bloom was 164
required in all systems to permit tree growth and preserve orchard longevity. Other 165
compounds applied during the period of aphid assessments were thinning products: 166
Naphthaleneacetamide (NAD), Naphthaleneacetic acid (NAA) and carbaryl (also being 167
classified as insecticide) in 2007; NAD alone in 2008. 168
The infestation dynamics were described on the 8 selected branches per training system at 169
two consecutive dates after petal fall: at the beginning of RAA multiplication and 170
dissemination phase in spring (D1) and at RAA infestation peak (D2), i.e. 10 to 12 days after 171
the first assessment date depending on the year. Because the studied branches were isolated 172
and selected on trees with no other symptoms (see Materials and methods, section 1), the 173
observed infestation events could be considered to be mainly due to RAA within-branch 174
movements. As 2008 assessments started at the very beginning of RAA dissemination phase, 175
initial infestation levels were lower in 2008 than in 2007. Because infestation was naturally 176
occurring in the orchard, trees and branches that were assessed were different in 2007 and 177
2008. For each one-year shoot within a branch, RAA population was assigned into four 178
infestation classes: 0, no aphids; 1, only individual aphids and no progeny; 2, small colony, 179
i.e. restricted to 1 or 2 leaves; 3, large colony, spreading over 3 leaves or more. The 180
infestation severity of each branch was the mean infestation class of all shoots on that branch. 181
The percentage of RAA-infested shoots of each branch was also calculated. All other aphids, 182
mainly the Aphis spp. complex (Aphis pomi de Geer, A. spiraecola Patch) (Aphididae) were 183
recorded by a presence/absence index. However, as infestation levels by Aphis spp. were very 184
low and similar whatever the date and the training system (infestation peaked at 4.2% infested 185
shoots in 2007 and 1.7% in 2008), only RAA infestation was considered in the present 186
analysis. As natural enemies of RAA were very scarce (pers. obs.) at the time of aphid 187
Version définitive du manuscrit publié dans / Final version of the manuscript published in : Trees, 2011, vol.26, n.1, 273-282
nuscript Manuscrit d’auteur
/ Author manuscript Manuscrit
d’auteur / Author manuscript
assessment, their effect on RAA development was considered to be null or very low in the 188 present study. 189 190 4. Data analysis 191
The effect of the training system, our main studied factor, on (i) the branch architectural 192
traits and (ii) RAA infestation, was investigated through successive steps involving in each 193
case a different set of variables. 194
A first step of the analysis considered each branch as a repetition. An ANOVA (studied 195
factor: tree training; block factor) was carried out on the four following architectural and 196
infestation variables: the number of shoots per branch, shoot density (total number of current-197
year shoots of a branch per unit of length of the main axis of this branch, number of shoots.m -198
1), RAA infestation level (% infested shoots) and mean severity of the branch. Percentage data
199
were arcsin-transformed before ANOVA. The general conditions of parametric ANOVA (i.e. 200
normal distribution and independence of residuals, homoscedasticity) were checked from the 201
graph of the residuals plotted against the predicted values and Shapiro-Wilks test (Dagnélie 202
1975). A second step in the analysis considered the current-year shoots as elementary units. A 203
χ2 test was used to analyse the distribution of shoots pooled per training system (CT/OS) in 204
the three following analyses: combined shoot descriptive categories (length x reproductive 205
status x growth status), yielding to different degrees of freedom since not all combinations 206
existed; branching orders and infestation course patterns between D1 and D2. Independently 207
of the training system (shoots pooled whatever the training system), a χ2 test was also used to 208
analyse if infestation was similar (in proportion) between the two status of each descriptor 209
considered separately, e.g. were short vs. long shoots similarly infested? Statistical analysis 210
was done with Statgraphics software (Statistical graphics Corp., Rockville, MD, USA). 211
Version définitive du manuscrit publié dans / Final version of the manuscript published in : Trees, 2011, vol.26, n.1, 273-282
nuscript Manuscrit d’auteur
/ Author manuscript Manuscrit
d’auteur / Author manuscript
A regression analysis was used to analyse the short-distance infestation pattern of RAA 212
within the branch. To do so, the RAA infestation severity class of a given shoot (target shoot) 213
at date 2 (dependent variable at D2) was plotted against the mean infestation severity class of 214
its nearest adjacent shoots at date 1 (independent variable at D1). These adjacent shoots were 215
those inserted immediately in proximal and distal topological position (see Materials and 216
methods, Section 2) of this given shoot; two shoots (general case) or only one shoot (no distal 217
adjacent shoot in the case of apices, no proximal adjacent shoot for the nearest of the tree 218
trunk) were thus considered. Because shoot numbers within the different infestation classes 219
were too low to develop this analysis at branch level, calculations were made per training 220
system. The mean infestation class at D2 (Y-axis) was computed per training system for each 221
group of target shoots (when three or more shoots) having the same mean infestation class of 222
their adjacent shoots at D1 (X-axis). 223
To test our hypothesis of an effect of the number of branching points (independent 224
variable) on RAA infestation within the branch (dependent variable), the infestation severity 225
class of a given shoot at D2 was plotted against the infestation severity class of its proximal 226
shoot at D1 considering the number of branching points between these paired shoots. In our 227
topological description, considering only the proximal (and not distal) adjacent shoot was 228
supported by the fact that apices of any current-year shoot (e.g. shoot ‘1’ on Fig. 1) had no 229
distal shoot which would lead to exclude up to 376 shoots from this regression analysis in 230
2007. As our aim was to highlight a possible effect of branching per se on RAA within-231
branch development (i.e. independently of the training system), this analysis was carried out 232
on the pooled data of the 16 study branches. The mean infestation class was computed at D2 233
(Y-axis) for each group of target shoots (when three or more shoots) whose proximal shoots 234
had the same infestation class at D1 (X-axis) in the case of 1, 2, etc. branching points between 235
Version définitive du manuscrit publié dans / Final version of the manuscript published in : Trees, 2011, vol.26, n.1, 273-282
nuscript Manuscrit d’auteur
/ Author manuscript Manuscrit
d’auteur / Author manuscript
These latter two regression analyses were done using the Ordinary Least Square (OLS) 237
regression method which is appropriate for fitting bivariate lines in allometry with the 238
hypothesis of a predictive relationship between the independent variable, here in the X-axis, 239
and the dependent variable, here in the Y-axis (SMATR software, Falster et al. 2006; Warton 240
et al. 2006). Comparisons between regression lines were carried out following two steps. 241
First, slopes of all lines were compared to determine if there was a common slope, i.e. a same 242
scaling coefficient, among groups. Second, in the case slopes did not change across groups, 243
tests for shift in elevation (intercept, i.e. allometric constant) and shift along the common axis 244 were computed. 245 246 RESULTS 247
1. Architectural traits shaped by branch manipulation
248
In 2007, 2030 shoots from 8 OS branches (1104 shoots) and 8 CT branches (926 shoots), 249
were assessed (Table 1). In 2008, 3470 shoots from 8 OS branches (1282 shoots) and 8 CT 250
branches (2188 shoots) were surveyed (Table 1). There were significant differences between 251
training systems for the proportion of shoots within combined categories of descriptors 252
whenever existing (short/long x growing/stopped x fruiting/vegetative). More precisely, in 253
2007, higher proportions of fruiting shoots (including long growing and short shoots) together 254
with a lower proportion of short vegetative stopped shoots were observed in the OS compared 255
to the CT system (χ2 = 266.73, 6 d.f., P < 0.001). In 2008, the proportion of vegetative 256
growing shoots was higher in OS compared to CT branches (χ2 = 82.43, 5 d.f., P < 0.001). 257
Higher proportions of growing shoots with (2007) or without (2008) fruits were thus observed 258
in OS compared to CT branches. The number of shoots per branch (Table 1) was significantly 259
higher in CT than OS branches in 2008 (ANOVA, F1,8 = 11.02, P < 0.05). Shoot density
260
(Table 1) was also higher in CT compared to OS trees in 2008 (ANOVA, F1,8 = 22.67, P <
Version définitive du manuscrit publié dans / Final version of the manuscript published in : Trees, 2011, vol.26, n.1, 273-282
nuscript Manuscrit d’auteur
/ Author manuscript Manuscrit
d’auteur / Author manuscript
0.01). There was no significant difference between training systems (ANOVA, P > 0.05) in 262
2007 for these two architectural variables and no block effect in any year. 263
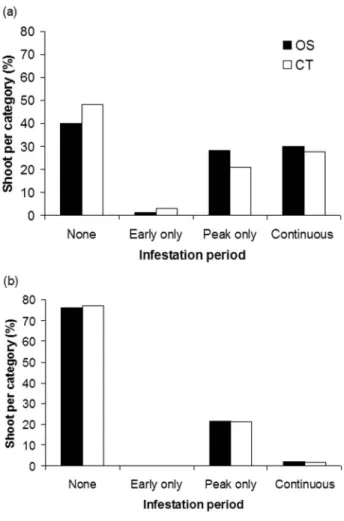
The distribution of shoots according to their branching order (Fig. 2a, b) displayed strong 264
differences between training systems in both years (2007, order 3 and 4 shoots pooled: χ2 = 265
244.43, 2 d.f., P < 0.001; 2008: χ2 = 337.52, 3 d.f., P < 0.001). Apart from the training system, 266
the proportion of shoots in the highest orders was higher in 2008 compared to 2007 (Fig. 2a, 267
b) attesting to the increased branching process which accompanies branch ageing between the 268
two years. But the proportion of shoots in branching orders 3 and 4 was higher in CT than in 269
OS branches in both years. 270
271
2. Effect of the training system on shoot infestation by RAA
272
2.1. RAA infestation and severity at branch level 273
The percentage of RAA-infested shoots and severity (Table 2) increased between the 274
two assessment dates (D1, D2) in both years. In 2007, large variations were observed between 275
branches within the same training system: RAA infestation rate at D1 was between 2.6% and 276
67.7% infested shoots in OS branches, and between 1.3% and 80.4% in CT branches. In 2008, 277
the infestation at D1 was at its beginning and the assessed branches were more 278
homogeneously infested with 0.4% to 4.7% infested shoots in CT and 0.4% to 10.0% infested 279
shoots in OS branches. Because of this high intra-training system variability, no significant 280
difference between training systems was displayed whatever the infestation variable (i.e. 281
percent infested shoots or severity) in any study year (ANOVA, P > 0.05). No significant 282
block effect or interaction block-training system could be displayed either. 283
284
2.2. RAA infestation dynamics at shoot level 285
Version définitive du manuscrit publié dans / Final version of the manuscript published in : Trees, 2011, vol.26, n.1, 273-282
nuscript Manuscrit d’auteur
/ Author manuscript Manuscrit
d’auteur / Author manuscript
Although at a given date no differences in infestation were displayed between training 286
systems in both study years, infestation courses of shoots between D1 and D2 were 287
significantly different between training systems in 2007 (Fig. 3a). Especially the proportion of 288
newly infested shoots between D1 and D2 assessment dates (“Peak only”) was higher in OS 289
than in CT branches (χ2= 25.07, 3 d.f., P < 0.001): 28.4% vs. 20.8% shoots get infested 290
between D1 and D2 in the CT and OS systems, respectively. However in 2008 (Fig. 3b), with 291
less infestation, the infestation courses were similar for both training systems: 77.0% of the 292
shoots remained non-infested, 1.8% were infested at both assessment dates and 21.2% 293
became infested between D1 and D2. 294
295
2.3. RAA infestation according to the shoot category 296
Whatever the training system, RAA infestation was higher on long vs. short shoots, on 297
fruiting vs. vegetative shoots, and on growing vs. non-growing shoots. Indeed, considering 298
pooled shoots per year there were significant differences in the distribution of shoots within 299
‘infestation status x descriptive categories’ (1 d.f.) whatever the year (2007 length: χ2 = 17.68, 300
P < 0.001; 2007 reproductive status: χ2 = 5.19, P < 0.05; 2007 growth status: χ2 = 23.40, P <
301
0.001; 2008 length: χ2 = 9.21, P < 0.01; 2008 reproductive status: χ2 = 58.87, P < 0.001; 2008 302
growth status: χ2 = 28.79, P < 0.001). 303
304
3. Effect of tree training on RAA short-distance infestation within branches
305
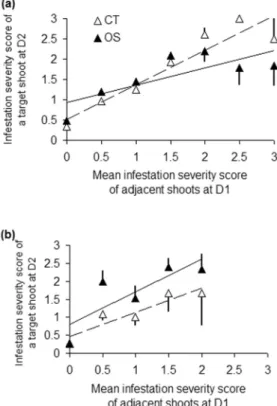
The relation between the infestation severity of a given shoot at D2 and the infestation 306
severity of its adjacent shoots at D1 (Fig. 4a, b) attested to short-distance patterns of RAA 307
infestation along the branch in both years whatever the training system: the infestation of a 308
shoot was all the more severe at D2 if adjacent shoots were severely infested at D1. This 309
relationship generally fitted with a linear regression of same slope for the two training 310
Version définitive du manuscrit publié dans / Final version of the manuscript published in : Trees, 2011, vol.26, n.1, 273-282
nuscript Manuscrit d’auteur
/ Author manuscript Manuscrit
d’auteur / Author manuscript
systems in 2007 and 2008 (P > 0.05). Whereas there was no significant difference between 311
intercepts of OS and CT branches in 2007, OS branches had a higher intercept than CT 312
branches in 2008 (Wald statistic = 3.966, P < 0.05). This latter result indicated that whatever 313
the infestation severity of adjacent shoots at D1, the infestation severity of the target shoot at 314
D2 was higher in OS than in CT branches. This held true whatever the infestation severity of 315
the target shoot at D1. 316
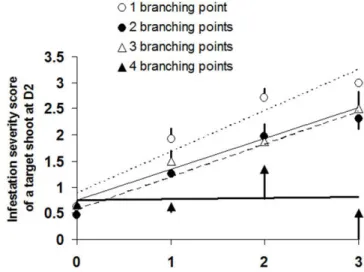
In 2007 the infestation severity at D2 of a given shoot according to the infestation 317
severity of its proximal adjacent shoot at D1 was dependent upon the number of branching 318
points decreasing between the ‘1 branching point’ and ‘4 branching points’ cases (Fig. 5; 319
significant difference in slopes, likelihood ratio statistic = 3.069, P < 0.05). The low 320
infestation level at D1 in 2008 did not permit a similar analysis. 321
322
DISCUSSION
323
1) Tree training affects RAA infestation through its effects on branch architecture
324
Aphid infestation dynamics were affected by branch architecture modulated by tree 325
training. A strong effect of extinction pruning was displayed on: (i) shoot proportions in 326
descriptive categories (length, and growth and reproductive status); and (ii) within-branch 327
shoot architecture. The extinction pruning procedure decreased the number of shoots in a 328
given year but provoked an increase in the number of shoots of higher branching order on the 329
remaining laterals in the following years. This led to an increase in shoot density, i.e. the 330
number of shoots per unit of length of the main branch axis. Such effect is not directly aimed 331
but induced by the extinction procedure. It has not been previously described and has to be 332
differentiated from the known effect of winter heading cut (Barritt 1992) which reduces the 333
length of current season- and one-year-old wood and stimulates the growth of new long 334
Version définitive du manuscrit publié dans / Final version of the manuscript published in : Trees, 2011, vol.26, n.1, 273-282
nuscript Manuscrit d’auteur
/ Author manuscript Manuscrit
d’auteur / Author manuscript
Superimposed to aggregation (Lathrop, 1928), a strong structuring effect of 336
architecture through the number of branching points between 2 shoots was observed on the 337
dispersal of individuals to colonize new shoots. Within-branch RAA infestation dynamics 338
relied on two superposed processes: within-branch aphid dissemination and/or multiplication 339
rates, which were likely to prevail since only wingless RAA forms were present along the 340
experiment in (at least partly) isolated branches. Moreover, as all training practices were 341
similar in both training systems and no or scarce competitors (other aphids) or regulators 342
(natural enemies) were observed, differences in aphid infestation were only due to the 343
intrinsic properties of the branch architecture shaped by the training system. We investigated 344
two infestation processes under natural and not controlled infestation conditions for different 345
levels of initial RAA infestation: (i) short-distance dissemination according to branching in 346
2007 when a wide range of infestation levels occurred (Fig. 5), and (ii) short-distance 347
infestation patterns according to the training system, under a low infestation background 348
(2008, Fig. 4b). These differences in initial infestation can explain different infestation 349
patterns between 2007 and 2008: the proportion of newly infested shoots between D1 and D2 350
differed in OS and CT branches in 2007 (Fig. 3a) for a similar severity increase (Fig. 4a). The 351
opposite was observed in 2008: the proportion of infested shoots was similar (Fig. 3b), but 352
severity differed (Fig. 4b). We may hypothesise that at least two interacting processes 353
occurred: 354
(i) The resource hypothesis: less propitious feeding resources, e.g. related to leaf nitrogen 355
content as well as a lower proportion of shoots suitable for aphid development (Grechi et al. 356
2010) induce a lower multiplication rate of aphids. The highest infestation of long growing 357
and fruiting shoots of our study is also related to well-known trophic relationships. This result 358
is consistent with the preferential development of fruit tree aphids on growing shoots (Grechi 359
et al. 2008) and more especially when they are long (Stoeckli et al. 2008b) in the peach - 360
Version définitive du manuscrit publié dans / Final version of the manuscript published in : Trees, 2011, vol.26, n.1, 273-282
nuscript Manuscrit d’auteur
/ Author manuscript Manuscrit
d’auteur / Author manuscript
Myzus persicae (Sulzer) (Aphididae) and apple - A. pomi cases studies, respectively. Sap
361
nutrient quality mediated by source-sink processes (also altered by sap-consumer aphids) can 362
explain such prevalence of aphids on growing and/or fruiting shoots (Larson and Whitham 363
1997). This resource hypothesis, which was not directly investigated in the present study, is 364
documented in literature. 365
(ii) The structural hypothesis: the dispersal process is constrained by both a higher degree of 366
branching and a higher shoot density. Such constrain may explain both a lower proportion of 367
newly infested shoots (2007, Fig. 3a) and a less severe RAA infestation at D2 (2008, Fig. 4b) 368
in CT compared to OS branches because of a delayed arrival of aphids on the newly infested 369
shoots. This hypothesis is supported by a lower infestation progress when aphid pathway from 370
one shoot to its distal neighbour had 4 compared to 1 branching points (Fig. 5). To the best of 371
our knowledge, as there is no previous study establishing differences in trophic resources 372
related to the degree of branching in a fruit tree (see Fig. 5, drawn independently of the 373
training system), the structural hypothesis warrants further comments. 374
375
2) Insect movement in complex habitats and applications for aphid control
376
In the structural hypothesis, each branching point can be seen as a node from a 377
geometrical point of view but as a crossroads for pedestrian foraging aphids. The number of 378
crossroads related to the branching degree affects the probability of reaching the target 379
resource, i.e. whether next or a more distant shoot (Neuvonen 1999). At 0.5 probability for 380
each direction at a crossroads, successive crossroads along the aphid pathway will then result 381
in a very low probability of reaching a topologically distant shoot, without counting increased 382
travel time due to unsuccessful forward and backward movements along the branch. Patterns 383
of connectivity (Hannunen 2002; Randlkofer et al. 2010) seen as the measure of physical 384
Version définitive du manuscrit publié dans / Final version of the manuscript published in : Trees, 2011, vol.26, n.1, 273-282
nuscript Manuscrit d’auteur
/ Author manuscript Manuscrit
d’auteur / Author manuscript
of dendritic networks applied to population dynamics (Campbell Grant et al. 2007) may help 386
to represent the within-branch movement and colonisation of aphids, and the significance of 387
shoots, sub-branches and crossroads (nodes). Branches may be seen as composed of suitable 388
habitats (shoots) and pathways of dispersal (main axes and axes of sub-branches) that may 389
present more or fewer crossroads according to the degree of branching. This also comes back 390
to plant heterogeneity and sectoriality (Orians and Jones 2001) as underlying processes 391
constraining aphid population dynamics within apple tree branches. This opens a field of 392
research to investigate these mechanisms via the study of within-tree 3D topology and 393
geometry (structural aspect) and nutritional status (physiological aspect) of shoots in relation 394
to branch architecture and RAA infestation rates. 395
At orchard level, tree architectural traits are both genetically determined for the 396
general tree habit (Lespinasse and Delort 1986; Lauri and Laurens 2005; Costes et al 2006) 397
and manipulated by cultural practices, namely tree training and pruning (Lauri 2002). Tree 398
architecture manipulation can contribute to modify (i) resource availability and access (plant-399
mediated ‘bottom up’ processes) and (ii) natural enemies’ attractiveness and success in prey 400
localisation (natural enemies-mediated ‘top down’ processes). Natural enemies were not 401
active in the present study, most probably because of their late arrival. But when considering 402
the complete apple pest complex, another important step would include tri-trophic interactions 403
among plant, pests and natural enemies. It has also to be considered that natural enemies may 404
be less efficient in complex habitats (Gingras and Boivin 2002; Legrand and Barbosa 2003; 405
Randlkofer et al. 2010; Riihimäki et al. 2006) despite increased abundance (Langellotto and 406
Denno 2004). Previous studies have demonstrated the benefits of CT for yield and fruit 407
quality (Lauri et al. 2007) and to lower aphid damage on apples (Simon et al. 2006). Although 408
expected benefits of tree training to control RAA are partial only, tree training appears to be a 409
relevant lever to consider and to combine with other protection methods. The identification of 410
Version définitive du manuscrit publié dans / Final version of the manuscript published in : Trees, 2011, vol.26, n.1, 273-282
nuscript Manuscrit d’auteur
/ Author manuscript Manuscrit
d’auteur / Author manuscript
architectural traits detrimental to pests thus contributes to design scientifically-based tree 411
training systems to decrease pesticide dependence in orchards and to contribute to sustainable 412 fruit production. 413 414 Acknowledgements 415
This work was supported by the French Ministry of Agriculture (C06-01- Pommiers; 416
Programme 142 – 27, Ctps 2007-2009). We are grateful to the staff members of Gotheron 417
experimental unit and B. Hucbourg (GRCETA Basse-Durance) for their contribution to tree 418
training and orchard management, to J.L. Hemptinne (ENFA Toulouse) and J.L. Regnard 419
(Supagro Montpellier) for stimulating discussions, and to David Biron for his helpful advice 420
on the English version. 421
422
References
423
Anderson P, Agrell J (2005) Within-plant variation in induced defence in developing leaves 424
of cotton plants. Oecologia 144:427-434 425
Araújo APA, de Paula JD, Carneiro MAA, Schoereder JH (2006) Effects of host plant 426
architecture on colonization by galling insects. Austral Ecol 31:343-348 427
Barritt BH (1992) Intensive orchard management. Good Fruit Grower, Washington State Fruit 428
Commission, Yakima, Washington 429
Bell A (1991) Plant form—an illustrated guide to flowering plant morphology. Oxford 430
University Press, Oxford 431
Bonnemaison L (1959) Le puceron cendré du pommier (Dysaphis plantaginea Pass.) – 432
Morphologie et biologie – Méthodes de lutte. Ann Epiphyt 10:257–322 433
Campbell Grant EH, Lowe WH, Fagan WF (2007) Living in the branches: population 434
Version définitive du manuscrit publié dans / Final version of the manuscript published in : Trees, 2011, vol.26, n.1, 273-282
nuscript Manuscrit d’auteur
/ Author manuscript Manuscrit
d’auteur / Author manuscript
Costes E, Lauri PÉ, Regnard JL (2006) Analysing fruit tree architecture. Implication for tree 436
management and fruit production. Hortic Rev 32:1-61 437
Dagnélie P (1975) Théorie et méthodes statistiques, Volume 2. Les Presses Agronomiques de 438
Gembloux, Gembloux 439
Deberardinis E, Baronio P, Baumgartner J (1994) The effect of aphid (Dysaphis plantaginea 440
Pass, Hom, Aphididae) feeding on apple fruit-growth. Ecol Model 72:115-127 441
Falster DS, Warton DI, Wright IJ (2006) User’s guide to SMATR: Standardised Major Axis 442
Tests & Routines. Version 2.0. Homepage: http://www.bio.mq.edu.au/ecology/SMATR/
443
Finke DL, Denno RF (2006) Spatial refuge from intraguild predation: Implications for prey 444
suppression and trophic cascades. Oecologia 149:265–275 445
Gingras D, Boivin G (2002) Effect of plant structure, host density and foraging duration on 446
host finding by Trichogramma evanescens (Hymenoptera: Trichogrammatidae). Environ 447
Entomol 31:1153-1157 448
Grechi I, Sauge MH, Sauphanor B, Hilgert N, Senoussi R, Lescourret F (2008) How does 449
winter pruning affect peach tree - Myzus persicae interactions? Entomol Exp Appl 450
128:369-379 451
Hallé F, Oldeman RAA, Tomlinson PB (1978) Tropical Trees and Forests. Springer-Verlag, 452
Berlin 453
Hanan J, Prunsinkiewicz P, Zalucki M, Skirvin D (2002) Simulation of insect movement with 454
respect to plant architecture and morphogenesis. Comput Electron Agric 35:255-269 455
Hannunen S (2002) Vegetation architecture and redistribution of insects moving on the plant 456
surface. Ecol Model 155:149-157 457
Holb IJ, Gonda I, Bitskey K (2001) Pruning and incidences of diseases and pests in 458
environmentally oriented apple growing systems: some aspects. Int J Hortic Sci 7:24-29 459
Version définitive du manuscrit publié dans / Final version of the manuscript published in : Trees, 2011, vol.26, n.1, 273-282
nuscript Manuscrit d’auteur
/ Author manuscript Manuscrit
d’auteur / Author manuscript
Kührt U, Samietz J, Dorn S (2006) Effect of plant architecture and hail nets on temperature of 460
codling moth habitats in apple orchards. Entomol Exp Appl 118:245-259 461
Langellotto GA, Denno RF (2004) Responses of invertebrate natural enemies to complex-462
structured habitats: a meta-analytical synthesis. Oecologia 139:1-10 463
Larson KC, Whitham TG (1997) Competition between gall aphids and natural plant sinks: 464
plant architecture affects resistance to galling. Oecologia 109:575-582 465
Lathrop FH (1928) The biology of apple aphids. Ohio J Sci 28(4): 177-204 466
Lauri PÉ, Lespinasse JM (2000) The Vertical Axis and Solaxe systems in France. Acta Hortic 467
513:287-296 468
Lauri PÉ (2002) From tree architecture to tree training - An overview of recent concepts 469
developed in apple in France. Journal of the Korean Society for Horticultural Science 470
43(6):782-788 471
Lauri PÉ, Willaume M, Larrive G, Lespinasse JM (2004) The concept of centrifugal training 472
in apple aimed at optimizing the relationship between growth and fruiting. Acta Hortic 473
636:35-42 474
Lauri PÉ, Laurens F (2005) Architectural types in apple (Malus X domestica Borkh.). In: Dris 475
R (ed) Crops: Growth, Quality and Biotechnology. World Food Ltd., Helsinki, pp 1300-476
1314 477
Lauri PÉ, Crété X, Ferré G (2007) Centrifugal training in apple - Appraisal of a two-year 478
experiment on cv. 'Galaxy' in southeast France. Acta Hortic 732:391-396 479
Lauri PÉ (2009) Developing a new paradigm for apple training. Compact Fruit Tree 42: 17-19 480
Lauri PÉ, Costes E, Regnard JL, Brun L, Simon S, Monney P, Sinoquet H (2009) Does 481
knowledge on fruit tree architecture and its implications for orchard management improve 482
Version définitive du manuscrit publié dans / Final version of the manuscript published in : Trees, 2011, vol.26, n.1, 273-282
nuscript Manuscrit d’auteur
/ Author manuscript Manuscrit
d’auteur / Author manuscript
Lawton JH (1983) Plant architecture and the diversity of phytophagous insects. Annu Rev 485
Entomol 28:23-39. 486
Legrand A, Barbosa P (2003) Plant morphological complexity impacts foraging efficiency of 487
adult Coccinella septempunctata L. (Coleoptera: Coccinellidae). Environ Entomol 488
32:1219-1226 489
Lespinasse JM, Delort F (1986) Apple tree management in vertical axis: appraisal after ten 490
years of experiment. Acta Hortic 160:120-155 491
Mani E, Wildbolz T, Riggenbach W (1995) Effect of pheromone trap position in large and 492
small trees and in the open field on the catch of codling moth, Cydia pomonella, males. 493
Mitt Schweiz Entomol Ges 68:69-78 494
Marquis RJ (1996) Plant architecture, sectoriality and plant tolerance to herbivores. Vegetatio 495
127:85-97 496
Martinez JJY, Wool D (2003) Differential response of trees and shrubs to browsing and 497
pruning: the effects on Pistacia growth and gall-inducing aphids. Plant Ecol 169:285-294 498
Neuvonen S (1999) Random foraging by herbivores: complex patterns may be due to plant 499
architecture. J Ecol 87:526-528 500
Orians CM, Jones CG (2001) Plants as resource mosaics: a functional model for predicting 501
patterns of within-plant resource heterogeneity to consumers based on vascular architecture 502
and local environmental variability. Oikos 94:493-504 503
Parveaud CE, Gomez C, Libourel G, et al. (2010) Assessment of the susceptibility to pests 504
and diseases of 36 apple cultivars in four low-input organic orchards in France. 505
Proceedings Ecofruit 14th International Conference on Organic Fruit-Growing, 506
Hohenheim, 22-24 February 2010 (ed. by IFOAM EU group). 507
http://www.ecofruit.net/proceedings-2010.html (accessed on 21 April 2011)
Version définitive du manuscrit publié dans / Final version of the manuscript published in : Trees, 2011, vol.26, n.1, 273-282
nuscript Manuscrit d’auteur
/ Author manuscript Manuscrit
d’auteur / Author manuscript
Price PW, Bouton CE, Gross P, McPheron BA, Thompson JN, Weis AE (1980) Interactions 509
among three trophic levels: influence of plants on interactions between insect herbivores 510
and natural enemies. Annu Rev Ecol Syst 11:41-65 511
Prokopy RJ, Wright SE, Black JL, Rull J (2001) Size of orchard trees as a factor affecting 512
behavioural control of apple maggot flies (Dipt., Tephritidae) by traps. J appl Entomol 513
125:371-375 514
Randlkofer B, Obermaier E, Casas J, Meiners T (2010) Connectivity counts: disentangling 515
effects of vegetation structure elements on the searching movement of a parasitoid. Ecol 516
Entomol 35:446–455 517
Riihimäki J, Vehviläinen H, Kaitaniemi P, Koricheva J (2006) Host tree architecture mediates 518
the effect of predators on herbivore survival. Ecol Entomol 31:227-235 519
Simon S, Lauri PÉ, Brun L, Defrance H, Sauphanor B (2006) Does manipulation of fruit-tree 520
architecture affect the development of pests and pathogens? A case study in an organic 521
apple orchard. J Hortic Sci Biotechnol 81:765-773 522
Simon S, Sauphanor B, Lauri PE (2007a) Control of fruit tree pests through manipulation of 523
tree architecture. Pest Technol 1:33-37 524
Simon S, Miranda C, Brun L, Defrance H, Lauri PÉ, Sauphanor B (2007b) Effect of 525
centrifugal tree training on pests and pathogens in apple orchards. IOBC/WPRS Bull 526
30:237-245 527
Skirvin DJ, Fenlon J (2003) Of mites and movement: the effects of plant connectness and 528
temperature on movement of Phytoseiulus persimilis. Biol Control 27:242-250 529
Stoeckli S, Mody K, Dorn S (2008a) Influence of canopy aspect and height on codling moth 530
(Lepidoptera: Tortricidae) larval infestation in apple, and relationship between infestation 531
Version définitive du manuscrit publié dans / Final version of the manuscript published in : Trees, 2011, vol.26, n.1, 273-282
nuscript Manuscrit d’auteur
/ Author manuscript Manuscrit
d’auteur / Author manuscript
Stoeckli S, Mody K, Dorn S (2008b) Aphis pomi (Hemiptera: Aphididae) population 533
development, shoot characteristics, and antibiosis resistance in different apple genotypes. J 534
Econ Entomol 101:1341-1348 535
Warton DI, Wright IJ, Falster DS, Westoby M (2006) Bivariate line-fitting methods for 536
allometry. Biol Rev 81:259-291 537
Wertheim SJ (2005a) Pruning. In: Tromp J, Webster AD, Wertheim SJ (eds) Fundamentals of 538
Temperate Zone Tree Fruit Production. Backhuys Publishers, Leiden, pp 176-189 539
Wertheim SJ (2005b) Planting systems and tree shape. In: Tromp J, Webster AD, Wertheim 540
SJ (eds) Fundamentals of Temperate Zone Tree Fruit Production. Backhuys Publishers, 541
Leiden, pp 190-203 542
Willaume M, Lauri PÉ, Sinoquet H (2004) Light interception in apple trees influenced by 543
canopy architecture manipulation. Trees - Structure and Function 18:705-713 544
545
Version définitive du manuscrit publié dans / Final version of the manuscript published in : Trees, 2011, vol.26, n.1, 273-282
nuscript Manuscrit d’auteur
/ Author manuscript Manuscrit
d’auteur / Author manuscript
Table 1. Architectural parameters measured at D1 (i.e. start of Dysaphis plantaginea 547
multiplication phase) at branch level in original solaxe (OS) and centrifugal training (CT) 548
branches in both years 549
550
2007 2008
Architectural parameters OS CT OS CT
Shoot number per branch 138.00 ± 14.46 115.75 ± 25.24 159.50 ± 23.55 272.63 ± 45.14
% long shoots1 30.83 ± 3.39 21.87 ± 2.67 9.98 ± 1.83 6.71 ± 1.98 % fruiting shoots 54.92 ± 4.88 21.39 ± 4.38 8.27 ± 4.76 12.04 ± 4.59 % growing shoots 33.28 ± 3.91 24.28 ± 4.30 25.00 ± 1.34 20.31 ± 1.41 Shoot density2 78.04 ± 3.92 80.86 ± 13.29 93.60 ± 7.86 144.08 ± 14.96
Each value is mean ± SE on 8 infested branches 551
1 Length categories: short, < 5 cm; long, ≥ 5 cm
552
2 Total number of current-year shoots of a branch per unit of length of the main axis of this branch (number of
553
shoots.m-1)
554 555
Version définitive du manuscrit publié dans / Final version of the manuscript published in : Trees, 2011, vol.26, n.1, 273-282
nuscript Manuscrit d’auteur
/ Author manuscript Manuscrit
d’auteur / Author manuscript
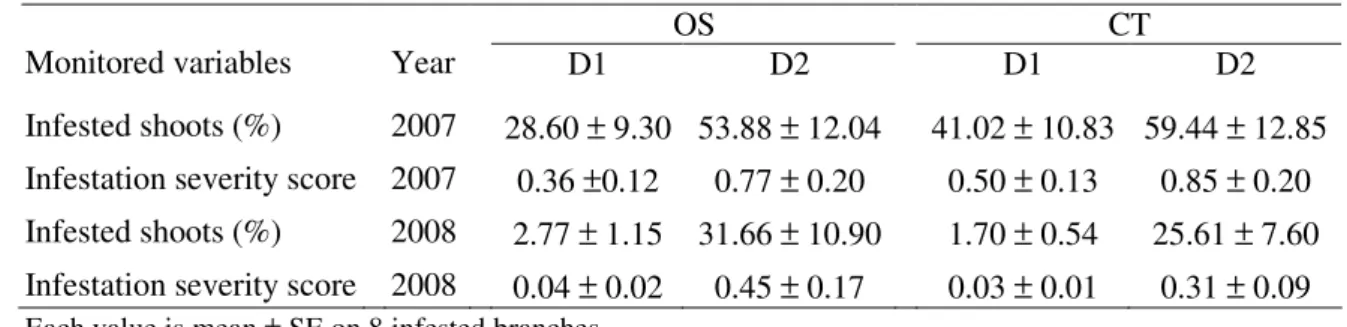
Table 2. Dysaphis plantaginea infestation at branch level in the original solaxe (OS) and 556
centrifugal training (CT) systems at D1 (i.e. start of D. plantaginea multiplication phase) and 557
D2 (D. plantaginea infestation peak) on apple in spring 2007 and 2008 558
559
OS CT
Monitored variables Year D1 D2 D1 D2
Infested shoots (%) 2007 28.60 ± 9.30 53.88 ± 12.04 41.02 ± 10.83 59.44 ± 12.85
Infestation severity score 2007 0.36 ±0.12 0.77 ± 0.20 0.50 ± 0.13 0.85 ± 0.20
Infested shoots (%) 2008 2.77 ± 1.15 31.66 ± 10.90 1.70 ± 0.54 25.61 ± 7.60
Infestation severity score 2008 0.04 ± 0.02 0.45 ± 0.17 0.03 ± 0.01 0.31 ± 0.09
Each value is mean ± SE on 8 infested branches 560
Version définitive du manuscrit publié dans / Final version of the manuscript published in : Trees, 2011, vol.26, n.1, 273-282
nuscript Manuscrit d’auteur
/ Author manuscript Manuscrit
d’auteur / Author manuscript
Figure 1. Topological annotation of a simplified branch taking into account branching order 562
and rank of insertion. Two shoots inserted at the same topological place (e.g. two “bourse 563
shoots” on the same flower cluster such as shoot ‘5’ and shoot ‘5bis’) are considered to have 564
similar branching order and one branching point between them. 565
566 567
Figure 2. Proportions of shoots per branching order in the original solaxe (OS) and centrifugal 568
training (CT) branches in (a) 2007 and (b) 2008 569
Version définitive du manuscrit publié dans / Final version of the manuscript published in : Trees, 2011, vol.26, n.1, 273-282
nuscript Manuscrit d’auteur
/ Author manuscript Manuscrit
d’auteur / Author manuscript
Figure 3. Infestation course between start and peak of spring Dysaphis plantaginea infestation 571
of shoots on apple in the original solaxe (OS) and centrifugal training (CT) branches in (a) 572
2007 and (b) 2008. 573
Version définitive du manuscrit publié dans / Final version of the manuscript published in : Trees, 2011, vol.26, n.1, 273-282
nuscript Manuscrit d’auteur
/ Author manuscript Manuscrit
d’auteur / Author manuscript
Figure 4. Relationships between Dysaphis plantaginea infestation severity of a target shoot at 575
D2 (i.e. infestation peak) and the mean infestation severity of its nearest adjacent shoots 576
(mean severity among 1 to 2 adjacent shoots) at D1 (start of D. plantaginea multiplication 577
phase) on apple in years (a) 2007 and (b) 2008 in the original solaxe (OS) and centrifugal 578
training (CT) branches. Symbols are means per severity class when three shoots or more. 579
When larger than symbols lines above or below symbols are standard errors. Regression lines 580
are computed for (a) 2007 OS (y = 0.5787x + 0.8075, r² = 0.7165, n = 6; plain line) and CT (y 581
= 1.0804x + 0.3298, r² = 0.9898, n = 6; dash line) systems; (b) 2008 OS (y = 0.899x + 0.8116, 582
r² = 0.6717, n = 5; plain line) and CT y = 0.8281x + 0.3829, r² = 0.8505, n = 4; dash line) 583
584
585 586
Version définitive du manuscrit publié dans / Final version of the manuscript published in : Trees, 2011, vol.26, n.1, 273-282
nuscript Manuscrit d’auteur
/ Author manuscript Manuscrit
d’auteur / Author manuscript
Figure 5. Relationships between Dysaphis plantaginea infestation severity of a target shoot at 587
D2 (infestation peak) and the infestation severity of its nearest proximal shoot at D1 (start of 588
D. plantaginea multiplication phase) on apple for different numbers of branching points
589
between the two shoots (2007, all shoots pooled). Symbols (means per severity class when 590
two shoots or more) and regression lines (n = 4) are represented for 1 (dotted line), 2 (dash 591
line), 3 (plain line) and 4 (bold line) branching points. When larger than symbols lines above 592
or below symbols are standard errors 593